
The financial and psychological situation of recent market entrants is improving. Furthermore, the recent rise in BTC has not been accompanied by a significant increase in open interest: little leverage has been added to the derivatives markets in recent days.
BTC Surges Again
After several weeks of decline, the Bitcoin price has managed to hold above the $110,000 threshold. While the short-term price action is a relief for recent entrants, the long-term momentum is beginning to show signs of slowing down.
While it is too early to say that this bull cycle is coming to an end, it is essential to study these dynamics to know what to expect in the coming weeks or months.
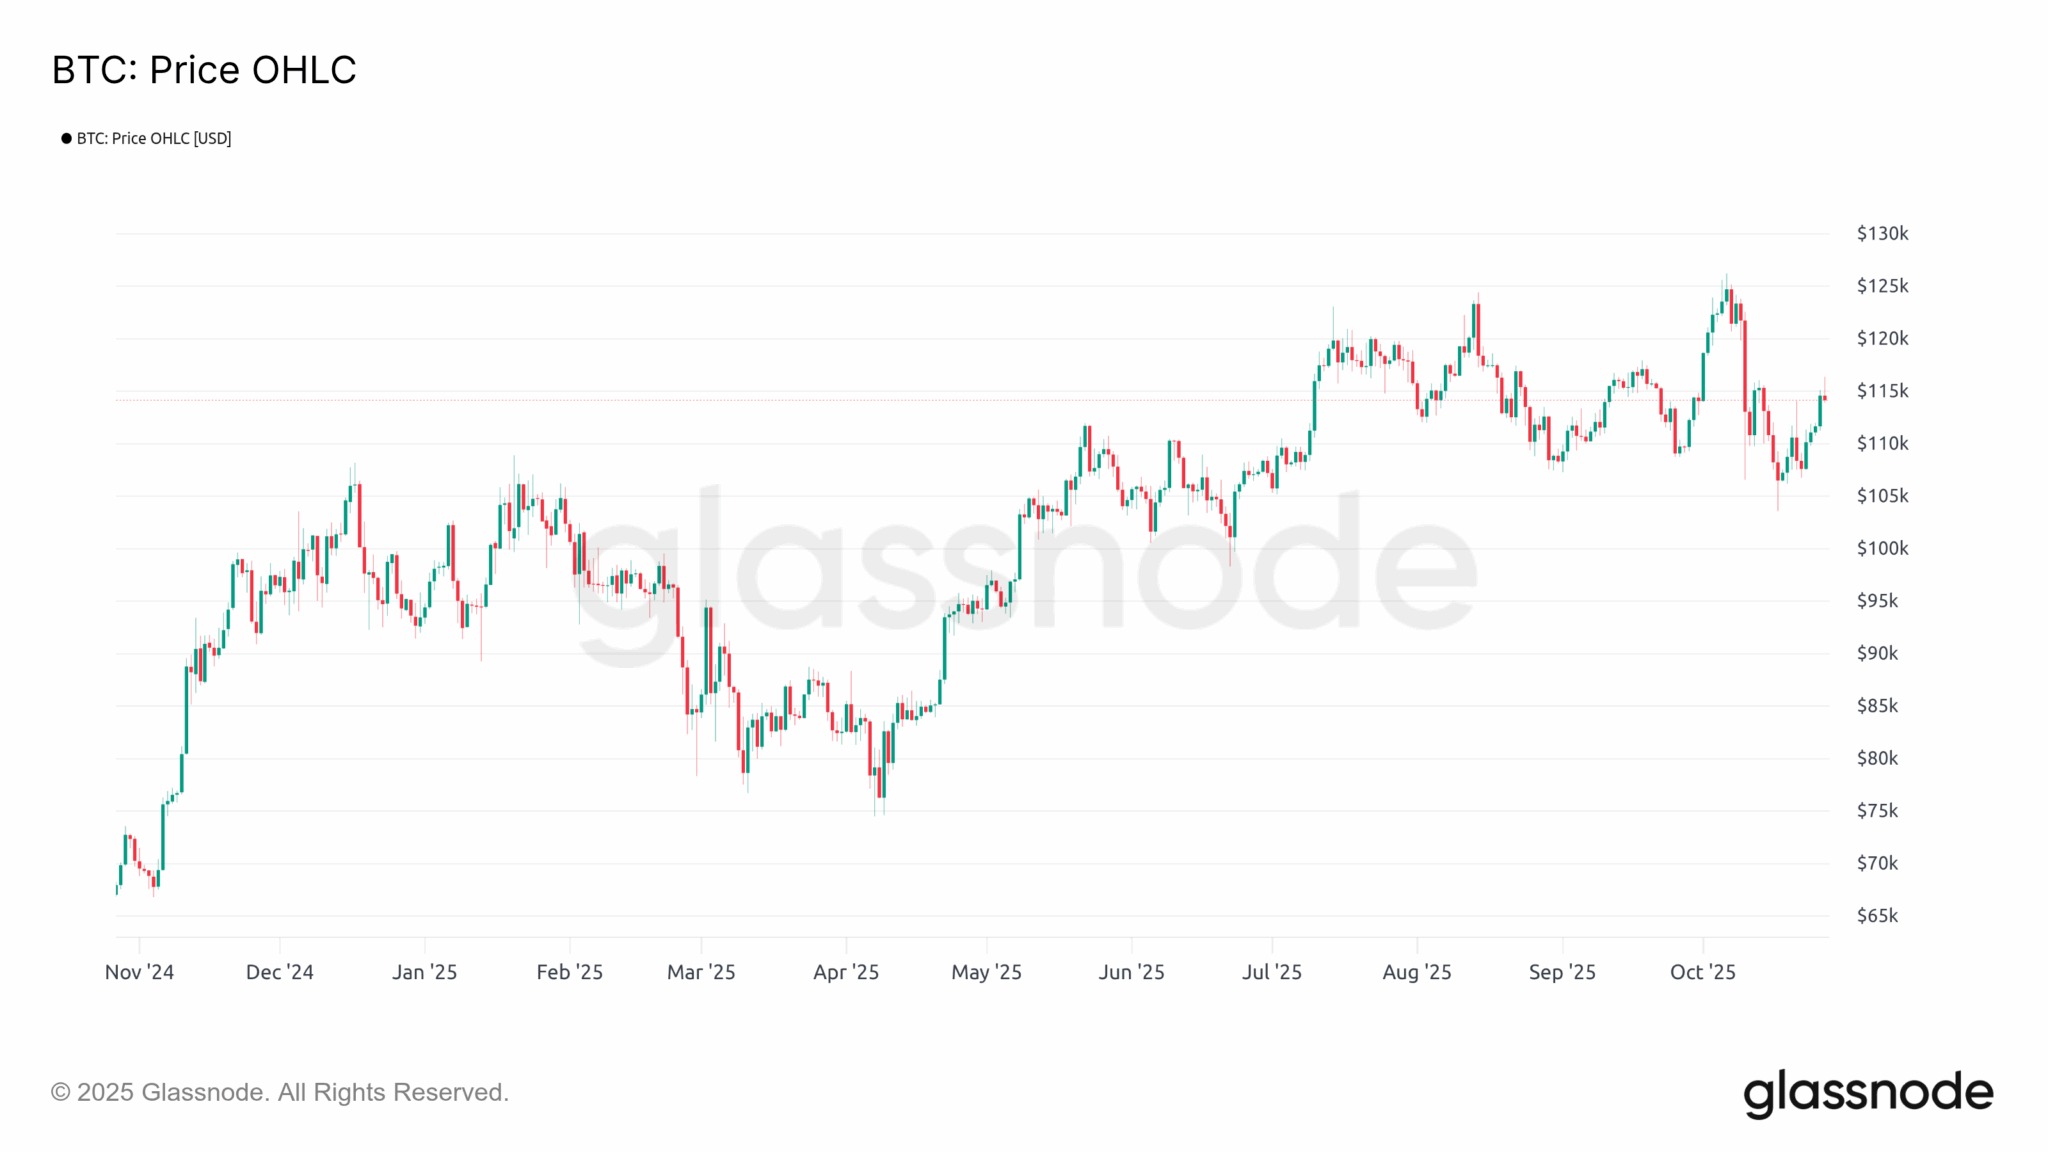
Figure 1: BTC Spot Price
After the rain comes the sunshine!
In our previous analysis, we assumed that the market was in a context conducive to the formation of a local low.
That has now happened, with BTC rebounding from $107,000 to $115,000, returning to the range we’ve been tracking for several weeks, between $108,000 and $117,000.
During this recovery, the Bitcoin price managed to climb above the average purchase price of short-term investors (STH), estimated at nearly $113,000.
Reclaiming this key level is particularly positive and indicates that the financial and psychological situation of recent market entrants is improving.
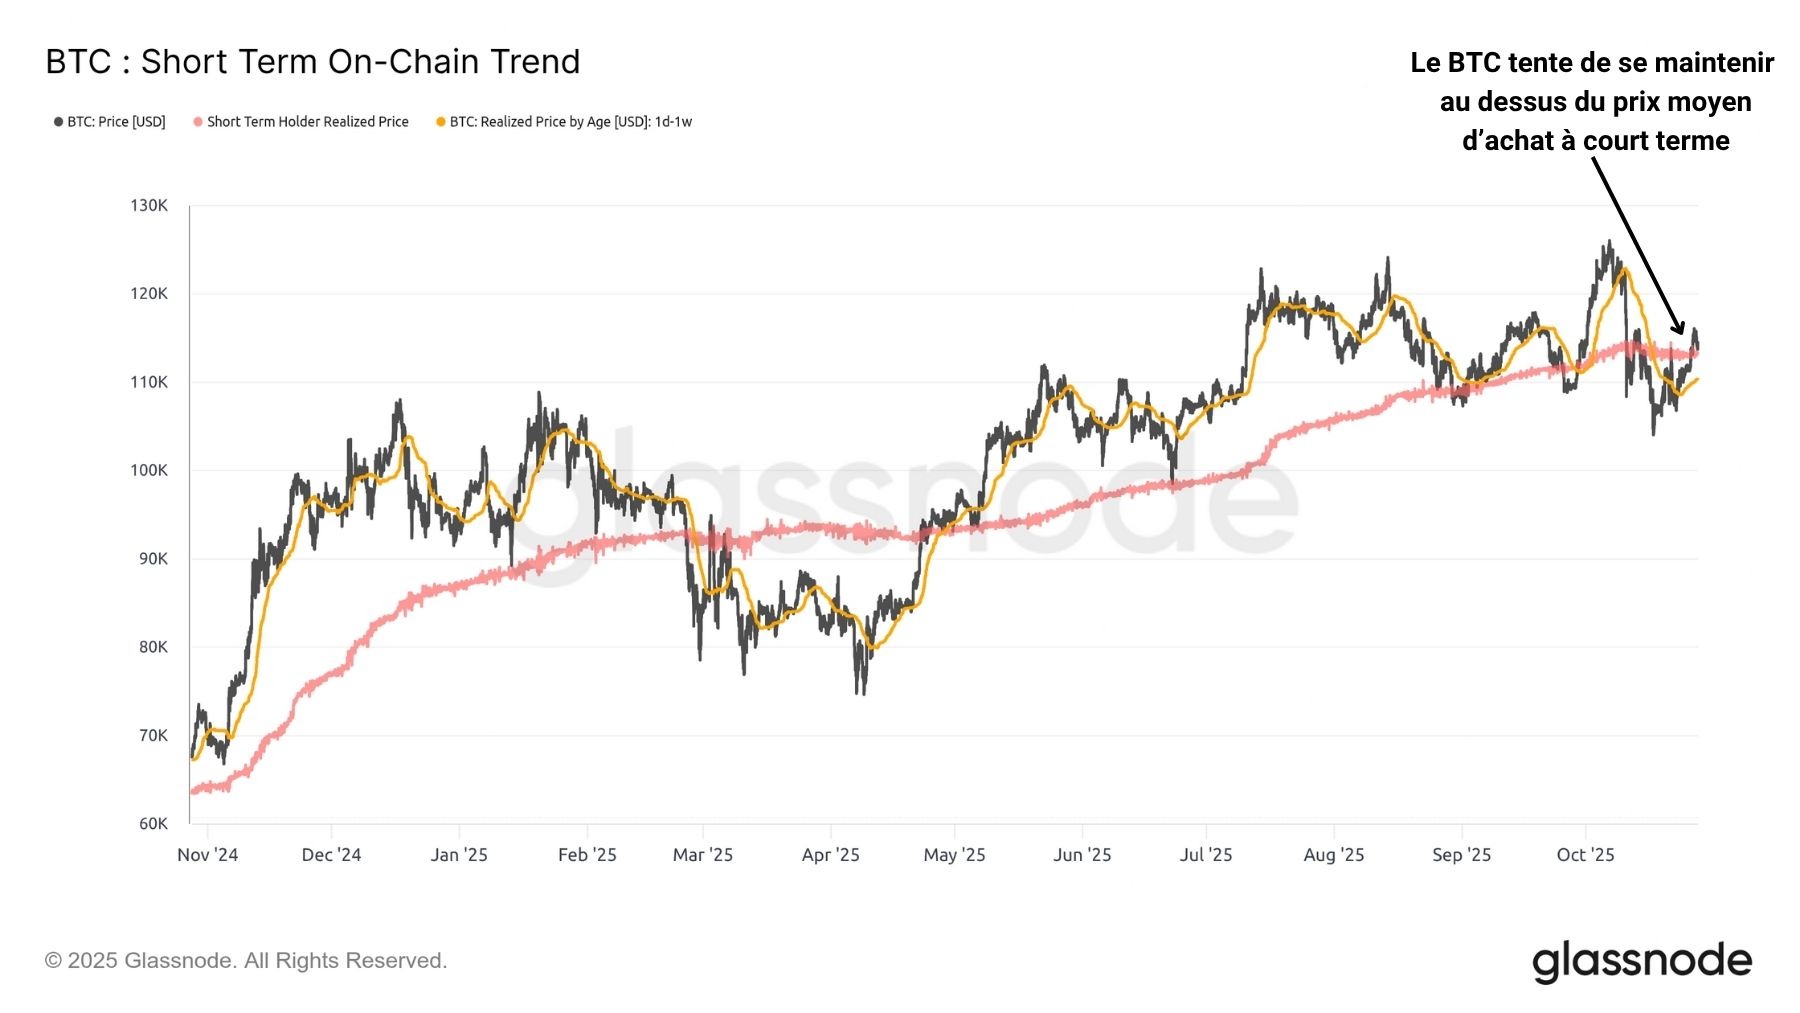
Figure 2: Average Purchase Price of Short-Term Investors
In the derivatives markets, the speculative sell-off we documented in this analysis appears to be subsiding, with open interest in Bitcoin futures contracts stabilizing around 320,000 BTC.
Current levels are the lowest recorded over the past 12 months, making the current market environment the healthiest we’ve seen in a long time in terms of speculative risk.
It is worth noting that the recent rise in BTC prices has not been accompanied by a significant increase in open interest, suggesting that little leverage has been added to the markets in recent days.
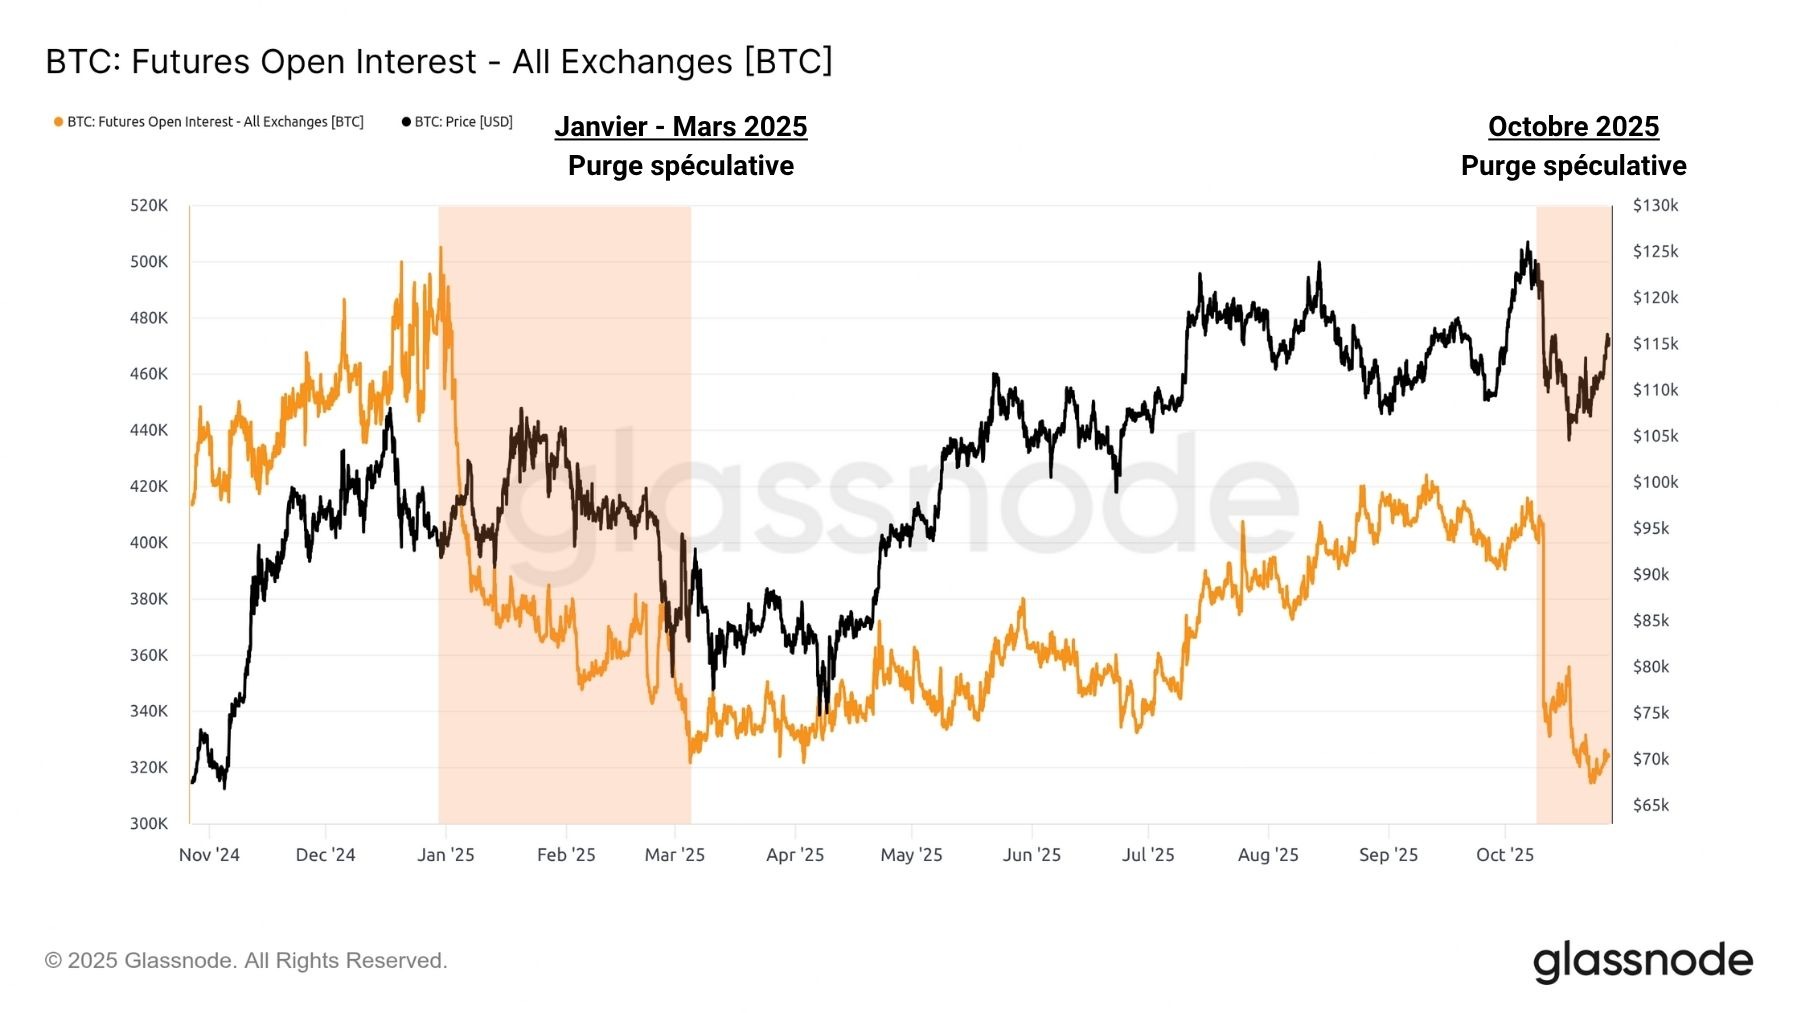
Figure 3: Open interest in BTC futures contracts
However, we must not lose sight of short-term price action, which remains partly driven by liquidity in the derivatives markets.
The liquidity heatmap indicates that the price is now moving between two significant pockets of liquidity:
- open short positions at the new all-time high (ATH), between $124,000 and $126,000;
- open long positions at the recent local low, between $103,000 and $106,000.
While it is currently impossible to predict with certainty which of these pockets will be breached first, the current momentum seems to favor a short squeeze. Stay tuned!
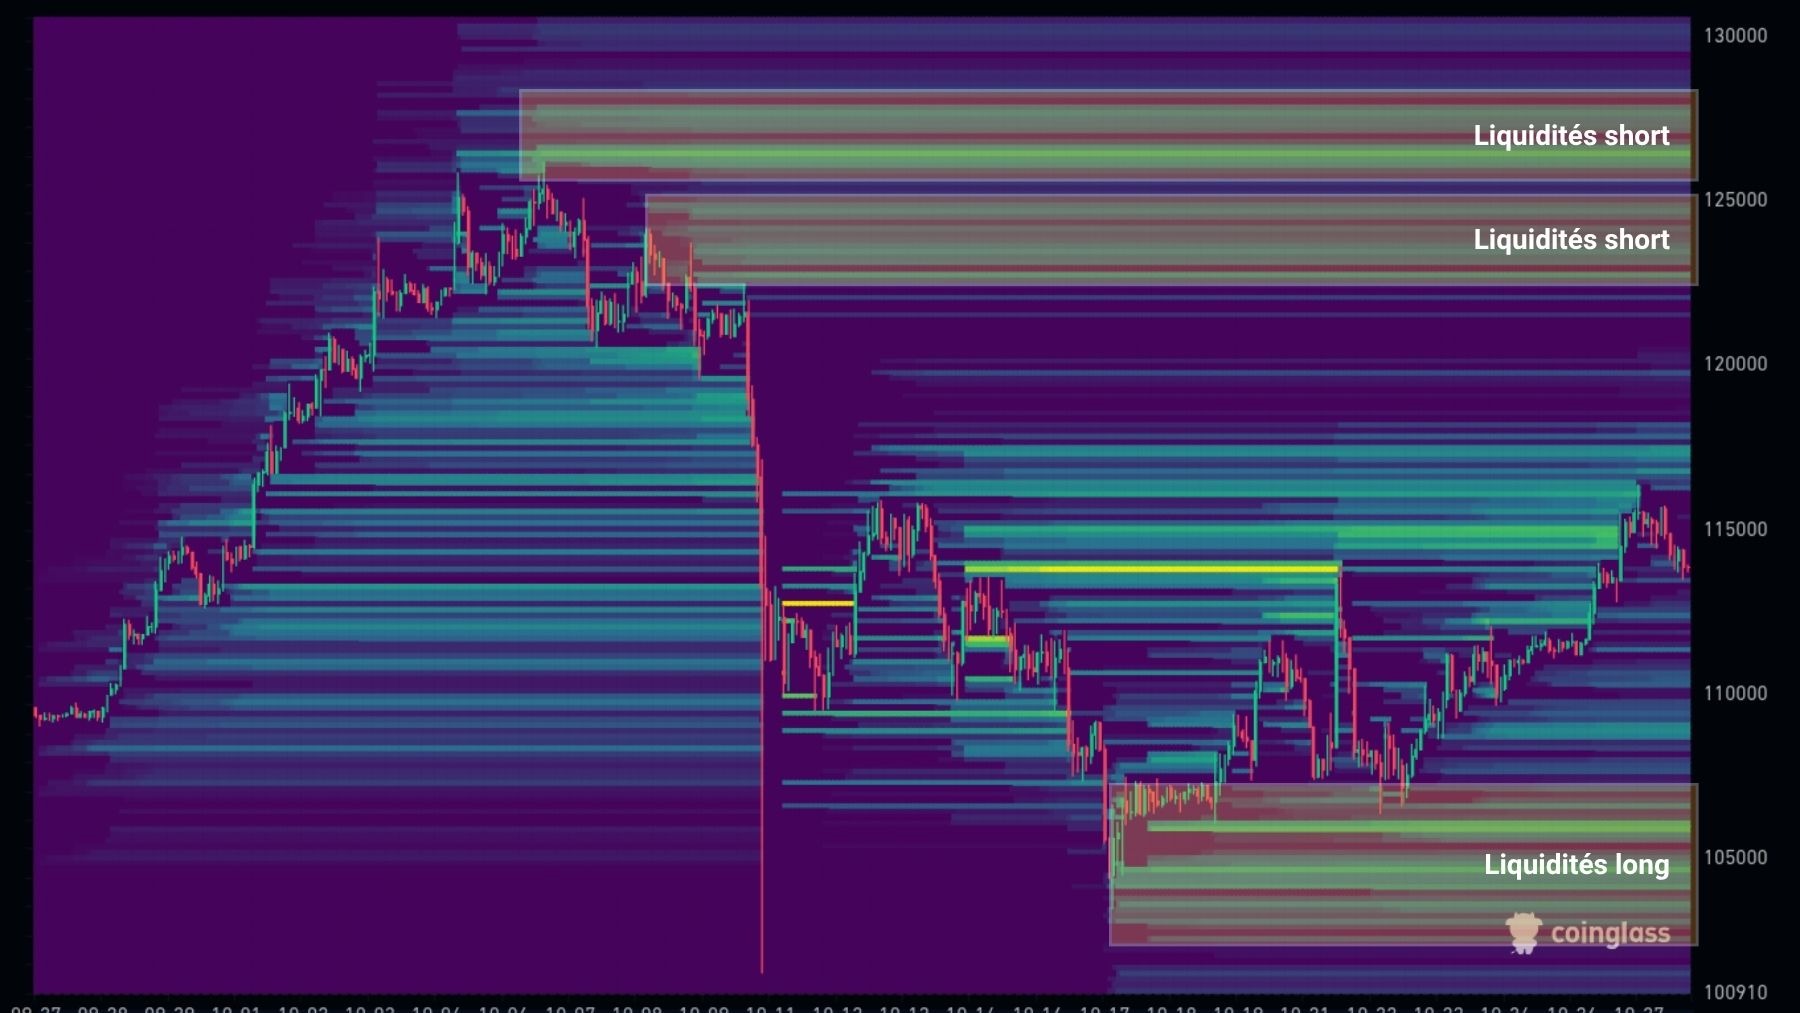
Figure 4: Heat map of liquidity in the derivatives markets
Bitcoin’s Cyclical Dynamics
Beyond the short-term context, it is essential to monitor BTC’s long-term dynamics. Since 2023, the market’s phased expansion has caused the percentage of the supply in profit to exceed the 95% threshold on multiple occasions.
It is during these periods that the market sets new records, but also when the likelihood of a correction is highest.
Nevertheless, each of the corrections recorded in recent years has resulted in increasingly less severe declines in the percentage of the supply in profit.
This shows that a growing portion of the circulating supply remains in profit, bringing the market closer to a saturation point where nearly all BTC would be held at a profit.
This pattern typically emerges during the advanced or even final stages of bull markets, when the circulating supply reaches a point where its profitability is so high that even a minor correction can significantly erode this metric.
While nothing of the sort is visible at the moment, caution is warranted in the coming weeks and months to identify a potential shift in market structure.
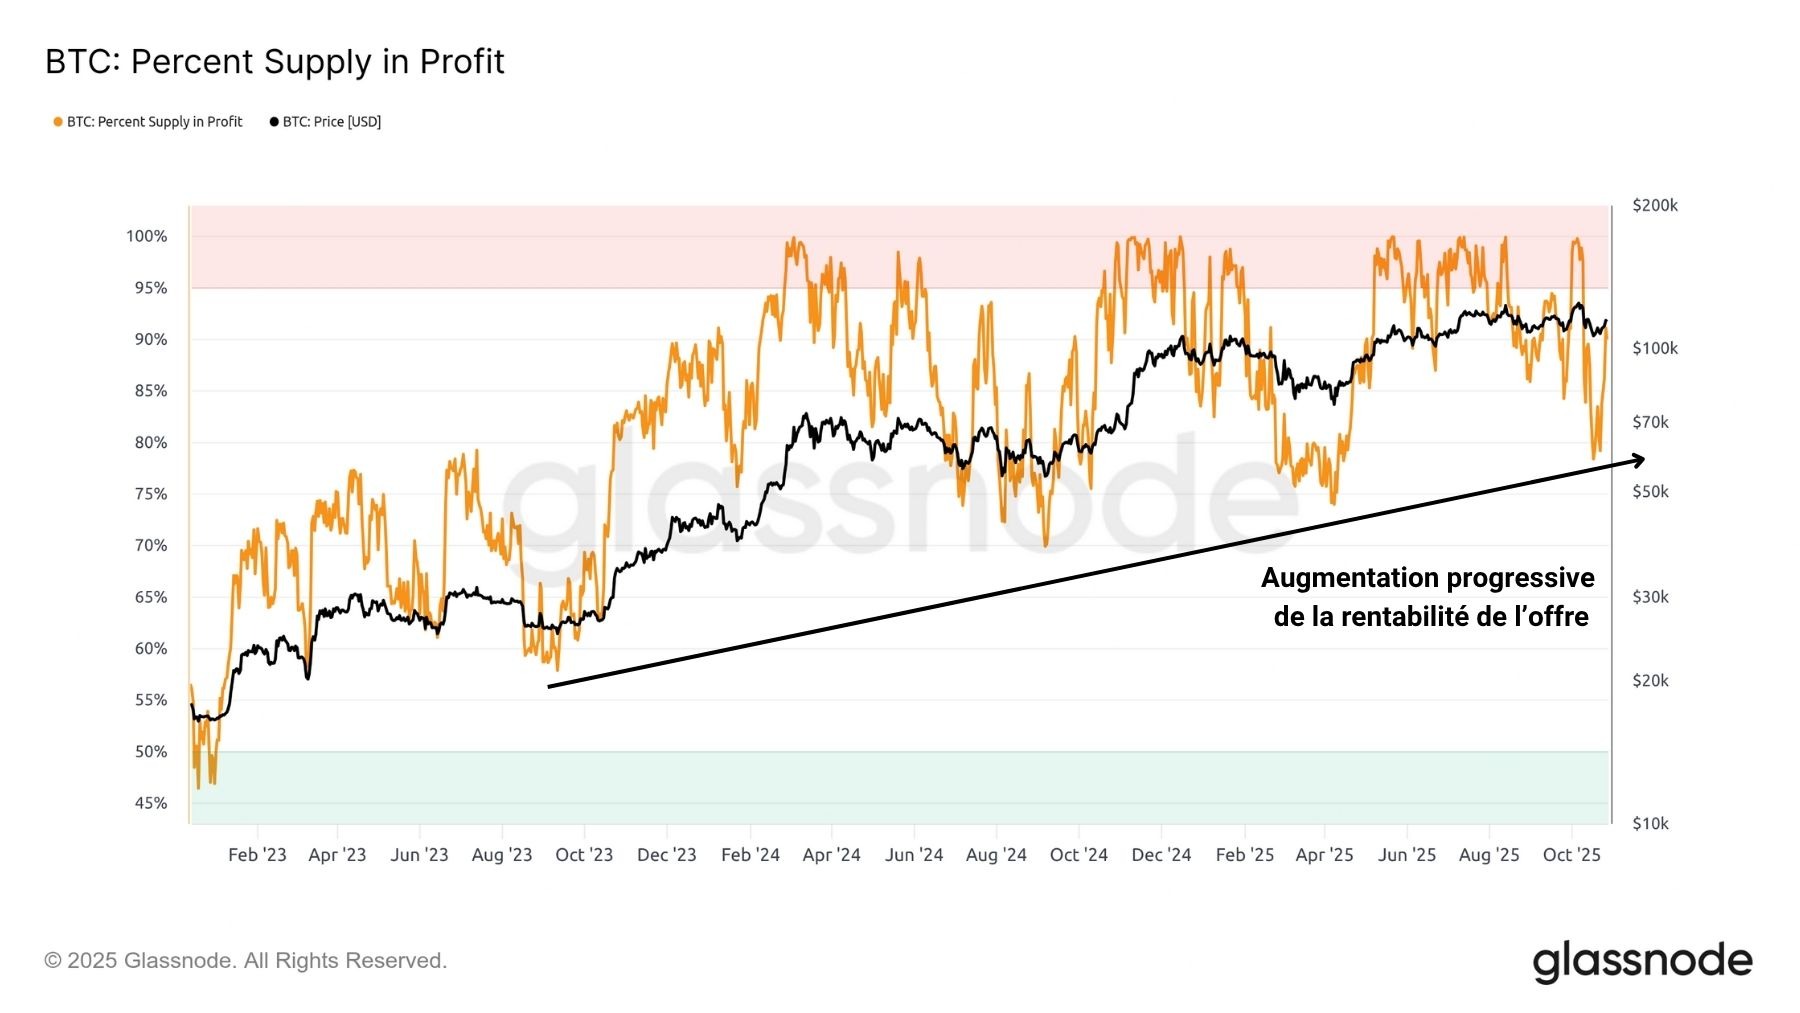
Figure 5: Percentage of Supply in Profit
The MVRV ratio, which measures the average degree of unrealized profit or loss among investors, is another key metric to track in order to gauge the progress of the bull cycle.
While the price of BTC set several consecutive record highs between 2023 and 2025, this indicator recorded declining peaks. This signals a slowdown in the market’s unrealized profitability: although the price is rising, investors’ average profits are falling.
This divergence is typical of the final stages of bull cycles, when price increases can no longer generate enough gains to stimulate demand. Similarly, each correction pushes more and more investors into negative equity as their returns struggle to grow.
Over time, the market’s perceived value (spot price) tends to converge toward its fundamental value (MVRV ratio), which automatically leads to a structural shift toward a bearish trend in the medium term.
Although the market is managing to stay relatively high for now, it is important to note that early signs of a slowdown are emerging.
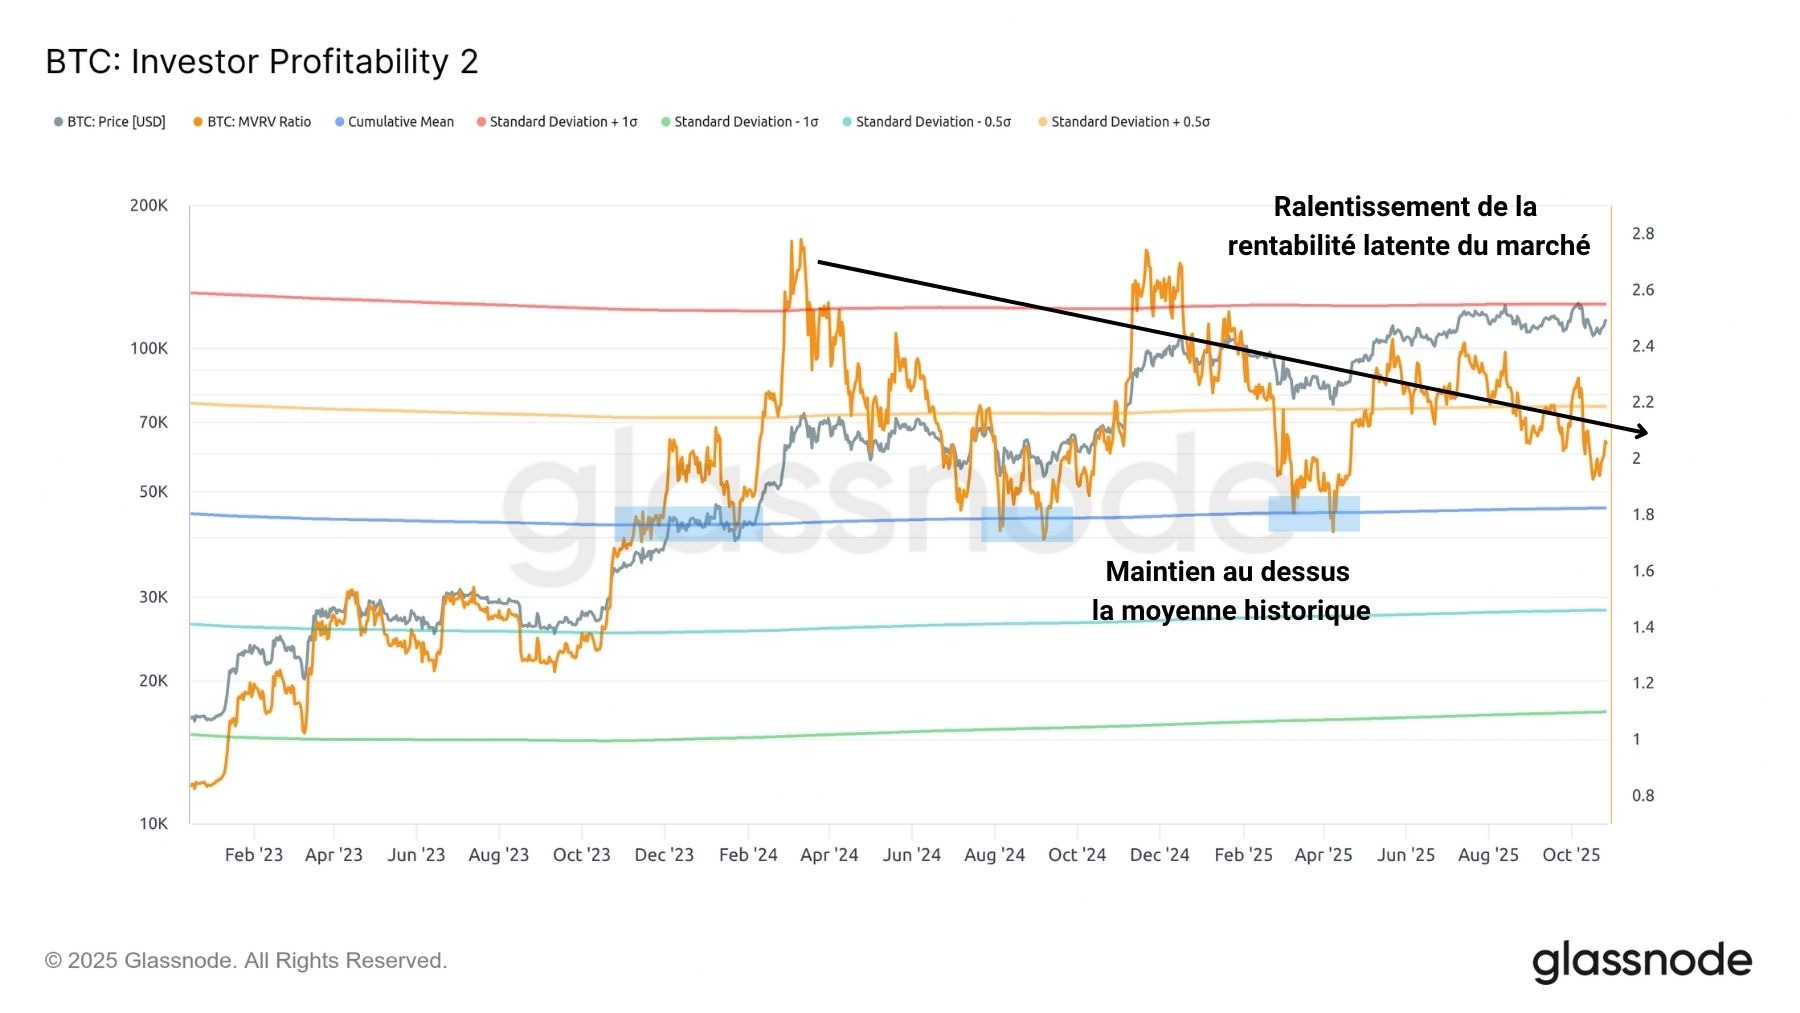
Figure 6: MVRV Ratio
Finally, the SOPR ratio, which measures investors’ average profit-taking and loss-taking behavior, helps determine whether the market is about to shift in structure or not.
Each bullish peak in the SOPR represents a wave of massive profit-taking, which places considerable selling pressure on the market, slowing the rally and often marking local peaks.
This is followed by corrections that bring the SOPR back near its neutral zone (SOPR = 1), which represents the boundary between BTC’s medium- to long-term bullish and bearish trends.
To date, the SOPR has managed to hold above this threshold quite robustly, underscoring the resilience of the bull market. While conditions look favorable for now, caution will be warranted if the SOPR dips below 1 for an extended period.
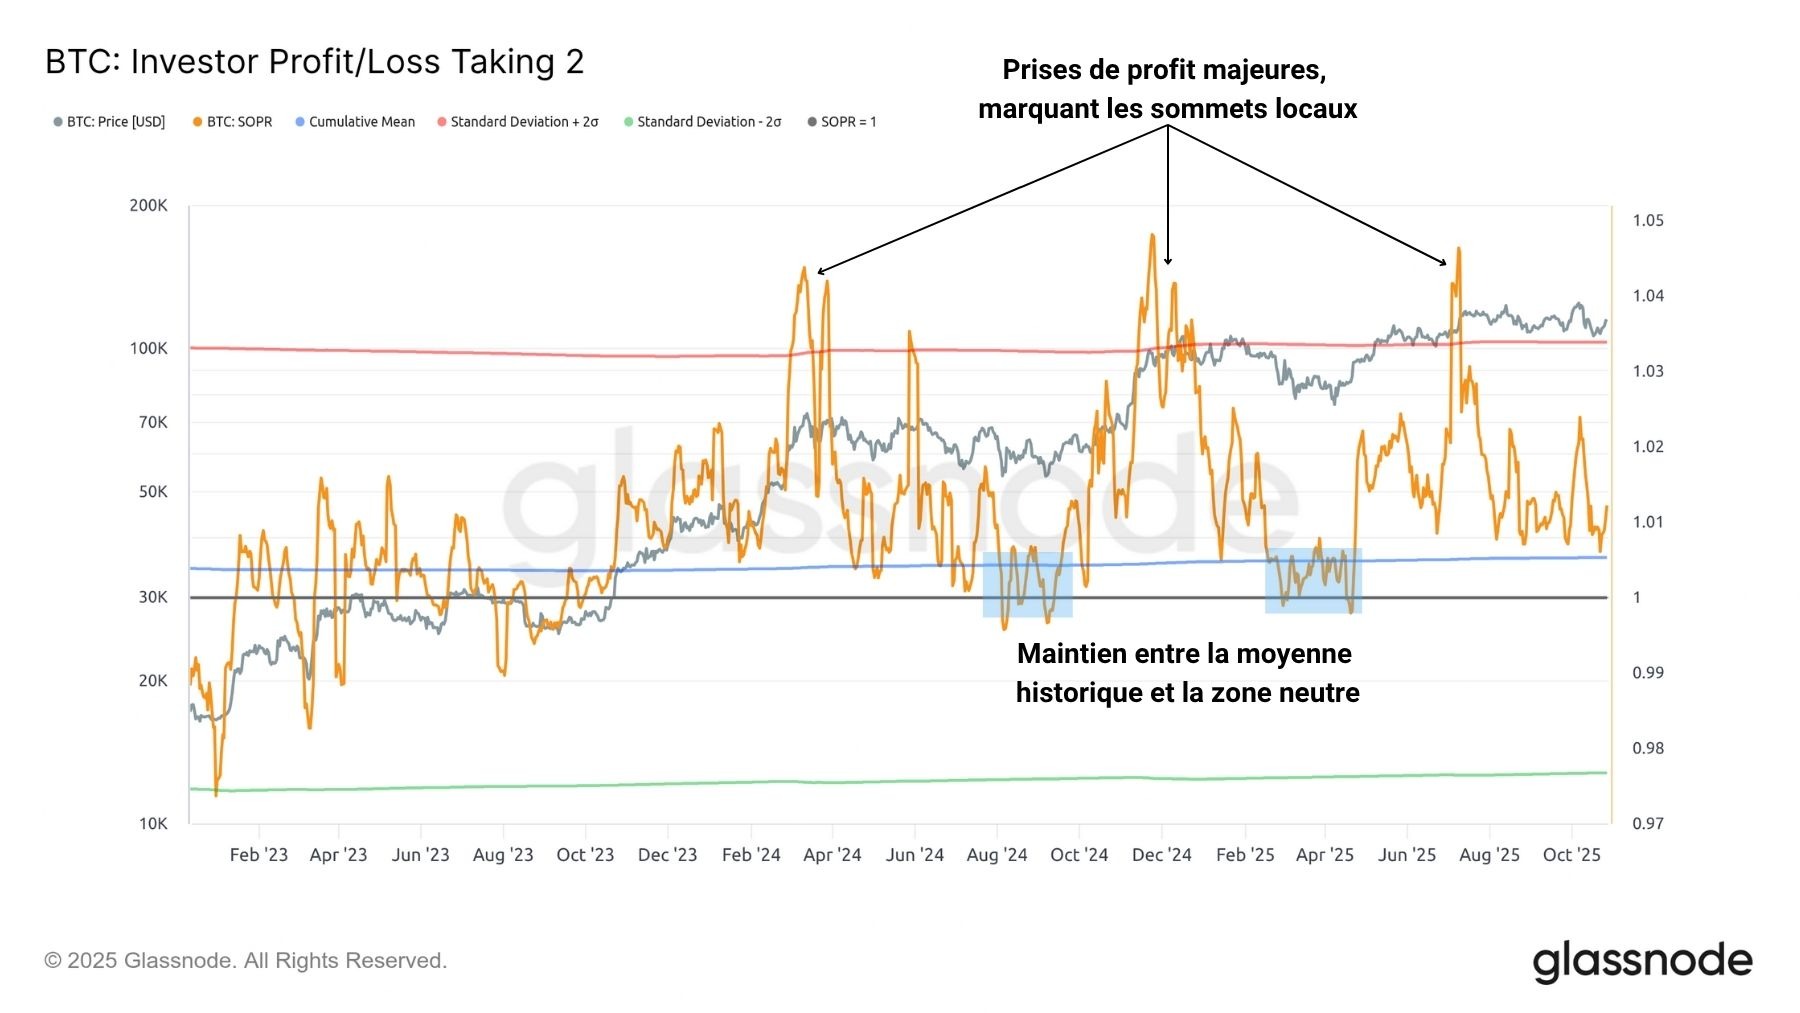
Figure 7: SOPR Ratio
Summary of this on-chain analysis of Bitcoin
Ultimately, this week’s data indicates that the financial and psychological situation of recent market entrants is improving.
The recent rise in BTC has not been accompanied by a significant increase in open interest, suggesting that little leverage has been added to the markets in recent days.
The MVRV ratio recorded declining peaks between 2023 and 2025, signaling a weakening of the market’s latent profitability: although the price is rising, investors’ average profit is falling.
Although the market is managing to stay relatively high for now, it is important to note that early signs of a slowdown are emerging.