
New Year, New BTC Price Rally? Today we’re taking a look at the bullish and bearish cases for the crypto market!
New Year, New Trend?
As 2026 begins, the BTC price is once again attempting to break through the $95,000 resistance level.
At the same time, the market’s on-chain structure is showing new encouraging signs, while a shift in capital flows toward ETH and altcoins is beginning to take shape.
What can we expect from the first few weeks of 2026? Let’s take a look together!
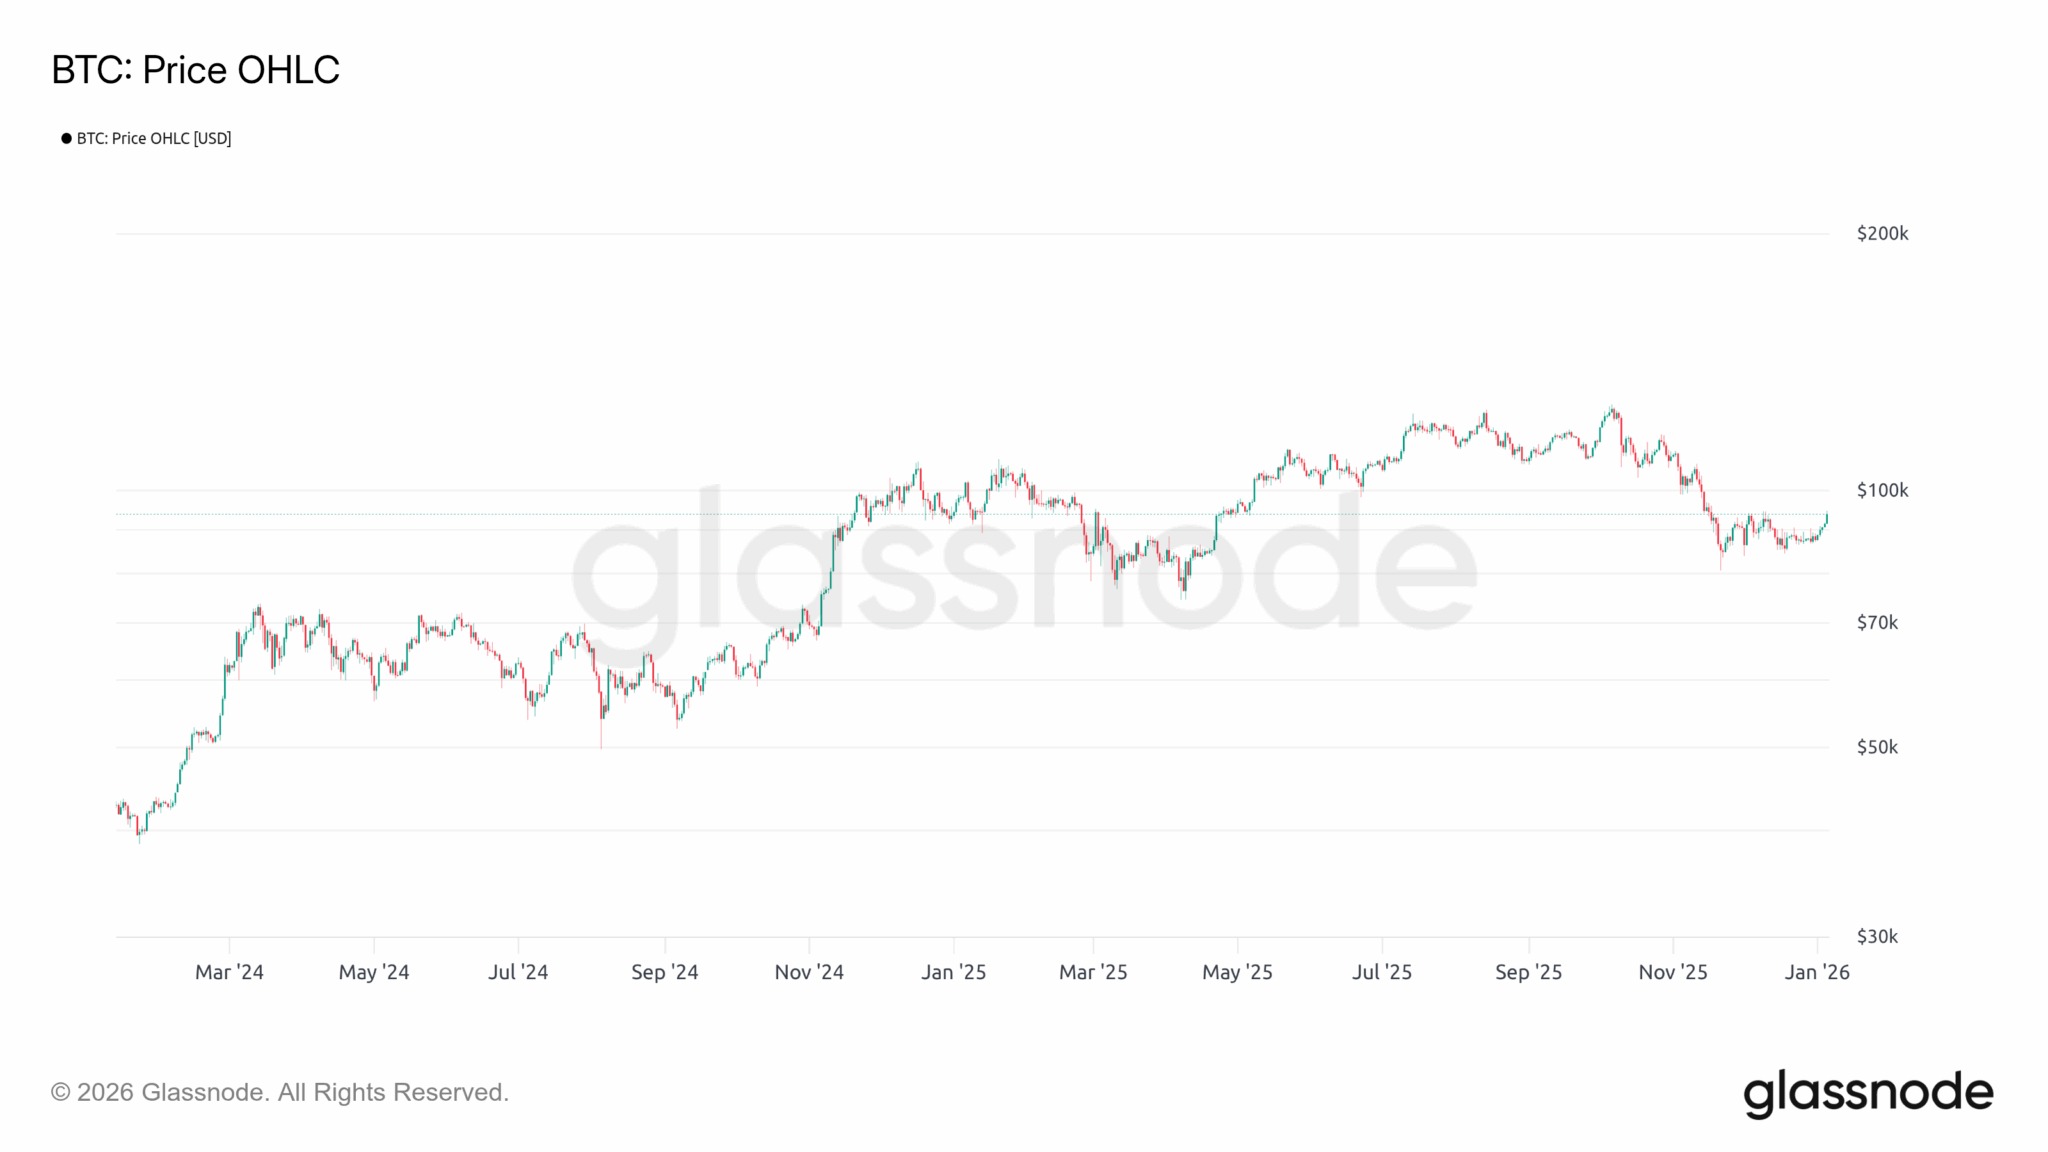
Figure 1: Daily BTC Price
An Optimistic Start to the Year
As a new year begins, the BTC price is once again attempting to break through the $95,000 threshold. This resistance level has been holding back the market’s upward momentum since December 2025, having already been rejected twice.
Even if BTC breaks above this level, success is not guaranteed. In fact, for a complete trend reversal to be confirmed, it will also need to break through the $105,000 resistance level—which will be no easy feat.
Once this threshold is crossed, the odds that the market will reach new all-time highs beyond $125,000 would once again become the majority.
Conversely, in the event of another rejection below $95,000, the $85,000 support level will need to hold to prevent BTC from falling further, which would confirm the onset of the bear market that many fear.
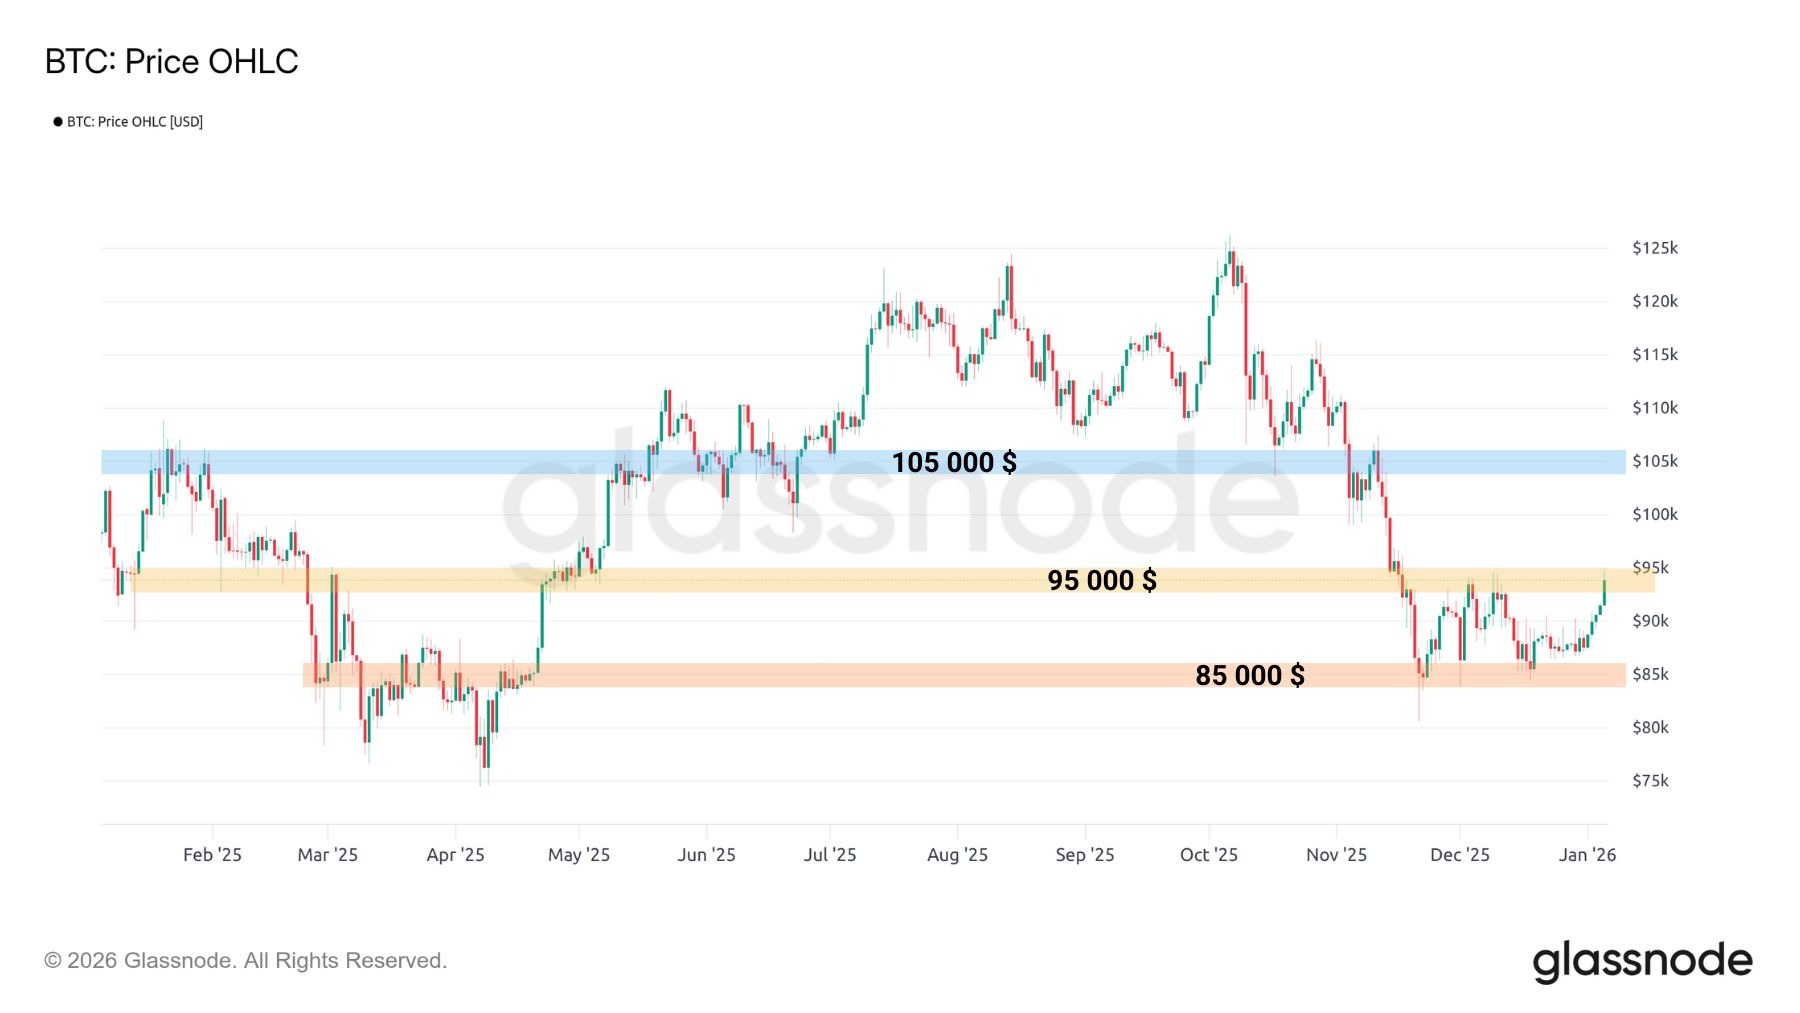
Figure 2: Daily BTC Price and Key Levels
Furthermore, the cryptocurrency market is currently witnessing a particularly interesting potential structural shift: a gradual rotation of capital from safe-haven assets toward riskier assets appears to have been underway since the beginning of the year.
Indeed, BTC and stablecoins—considered the least volatile assets on the market—have seen their dominance decline in favor of ETH and altcoins.
This trend suggests a migration of capital away from BTC and stablecoins toward ETH and altcoins, a dynamic that could lead to an “altseason” if it persists and gains momentum.
However, caution is warranted: this signal is still recent and will need to be monitored closely to determine whether it represents a sustainable shift in capital or merely a temporary diversification at the start of the year.
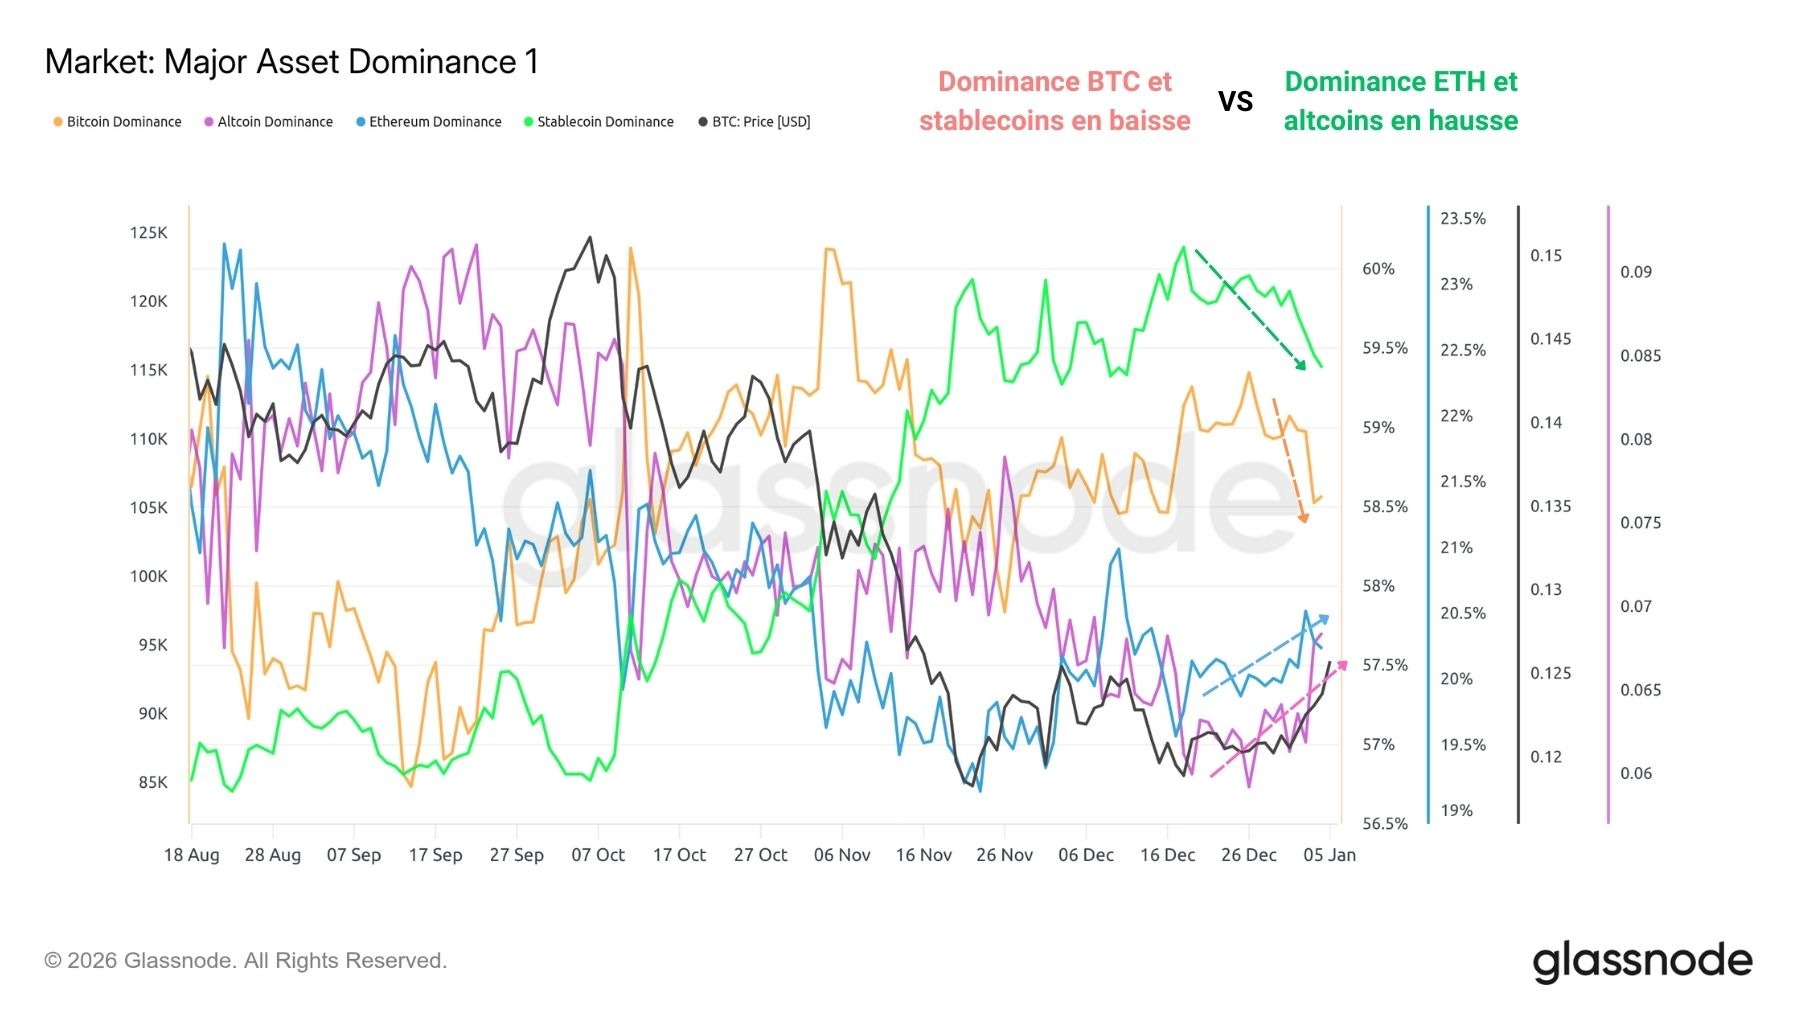
Figure 3: Dominance of Different Sectors of the Crypto Market
End of the Correction?
At the same time, the market’s on-chain structure is showing new encouraging signs, particularly regarding short-term dynamics.
This trend is particularly evident in the chart showing the percentage of the supply held at a profit by short-term holders (STH), which measures the proportion of BTC held at a profit by recent buyers.
The indicator had reached 2% in late November 2025, signaling that 98% of the supply held by STHs was then at a loss. This extreme value is characteristic of a phase of major short-term capitulation, often followed by an end to the downtrend (as observed in September 2024 and May 2025).
Since then, the BTC price has stabilized, allowing for a gradual improvement in the profitability of the short-term supply. To date, nearly 27% of the short-term investor supply is held at a profit, a context more conducive to optimistic sentiment and short-term buying.
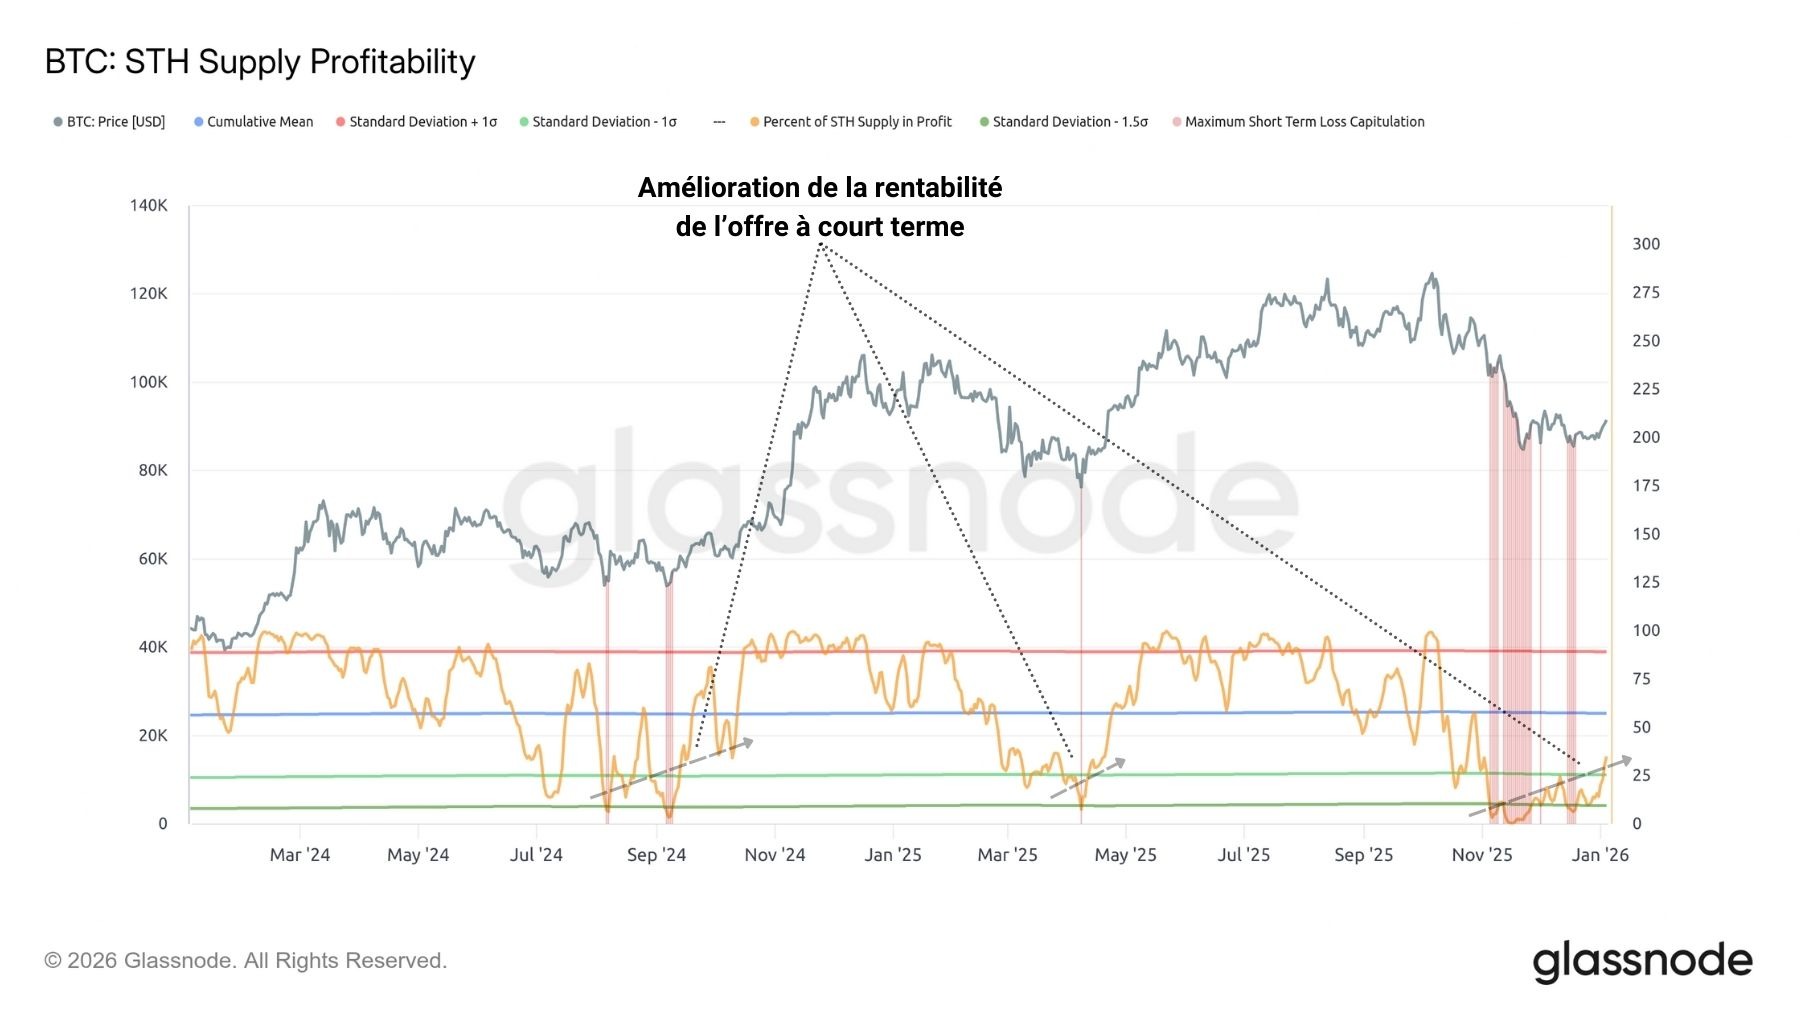
Figure 4: Percentage of BTC Supply Held at a Profit
A similar trend can be observed in the SOPR ratio for short-term investors, which tracks their spending behavior. After a sharp spike in loss-taking at the end of November—corresponding to a phase of capitulation—the losses incurred by STHs have gradually decreased, to the point where they are now virtually zero.
This slowdown in loss-taking suggests a gradual easing of selling pressure, providing BTC with a more favorable environment for a bullish recovery in the coming days or weeks.
If this indicator manages to remain sustainably above 1, the likelihood that the downtrend is coming to an end would increase significantly, paving the way for a new bullish test of the BTC price.
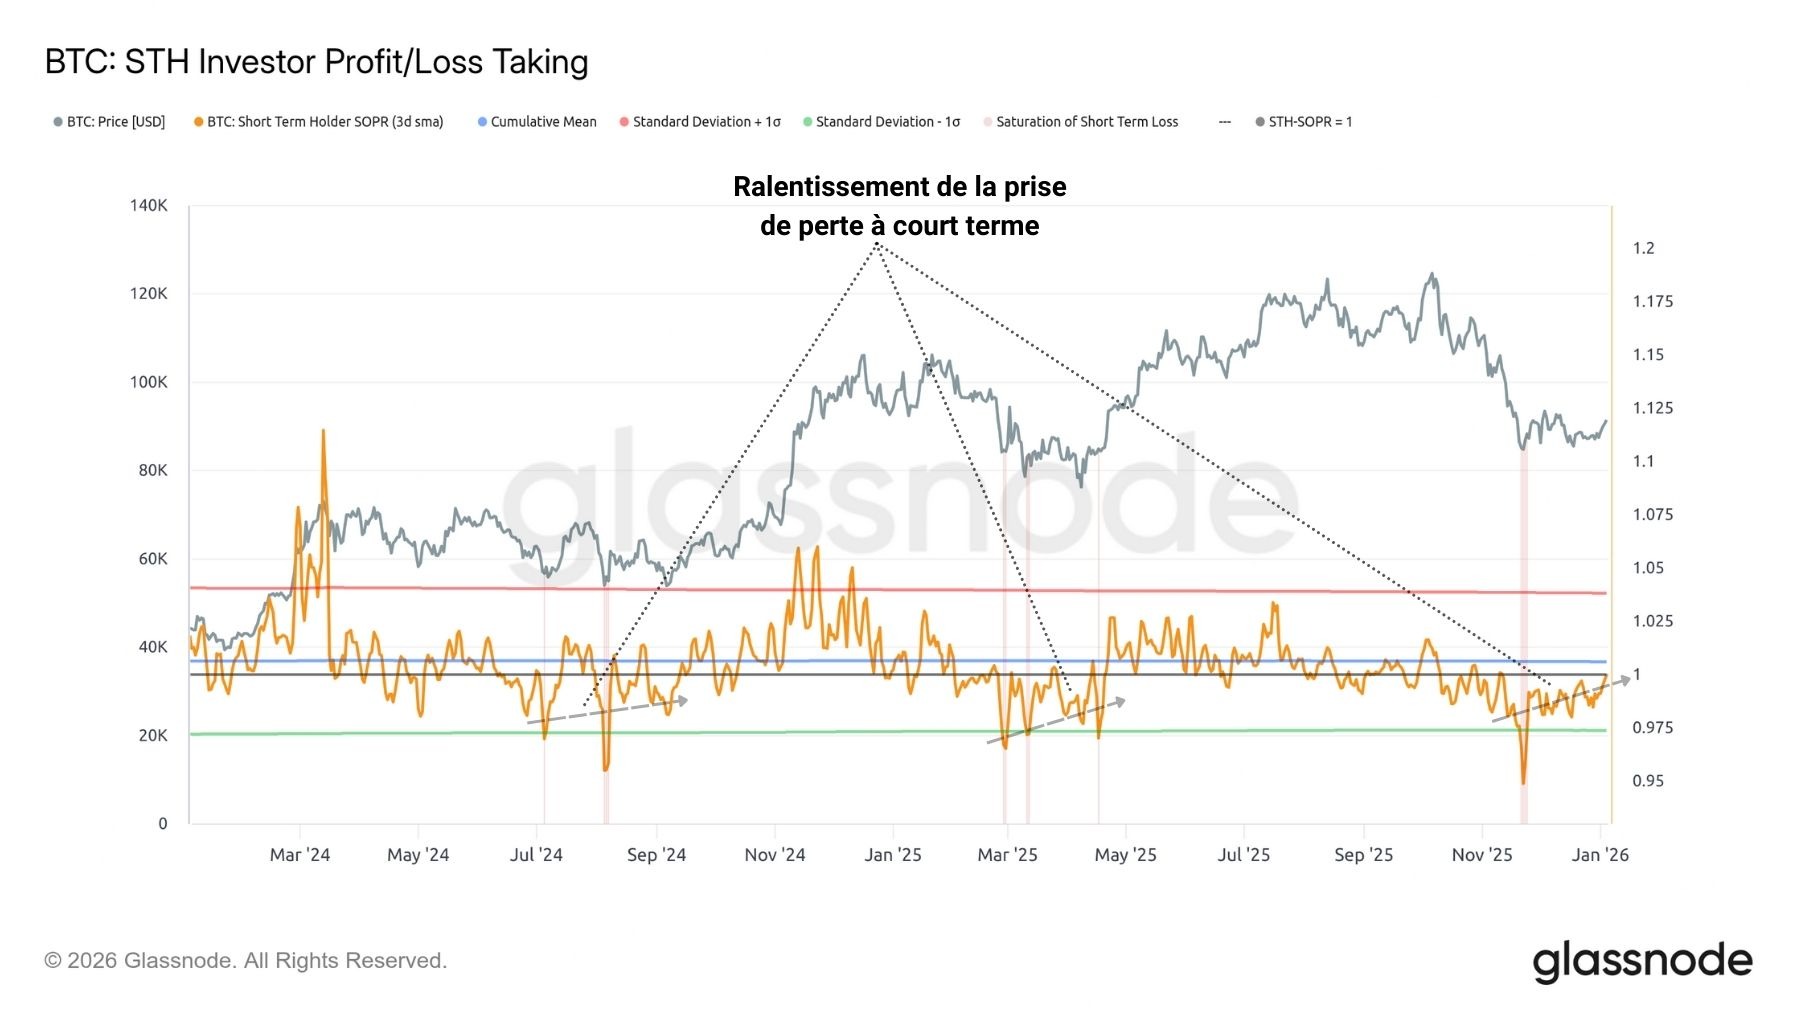
Figure 5: SOPR Ratio
Cyclical Behavior
To put these rather optimistic observations into perspective, let’s take a step back and look at recent price action. Contrary to expectations, the BTC price has maintained a remarkably consistent cyclical pattern over the last three bull cycles.
The time dimension appears to play a key role in the development of BTC’s bull and bear cycles between 2017 and 2025.
In fact, the time elapsed between a halving and the subsequent cyclical peak has coincided surprisingly consistently across the last three cycles, with approximately 520 days post-halving required to reach a new market peak.
Although this phenomenon could be seen as a mere coincidence, the observed regularity is nonetheless worth noting.
Beyond these temporal similarities, a major difference emerges in terms of performance: the current bull cycle is the first to show a gain of less than +100% following a halving.
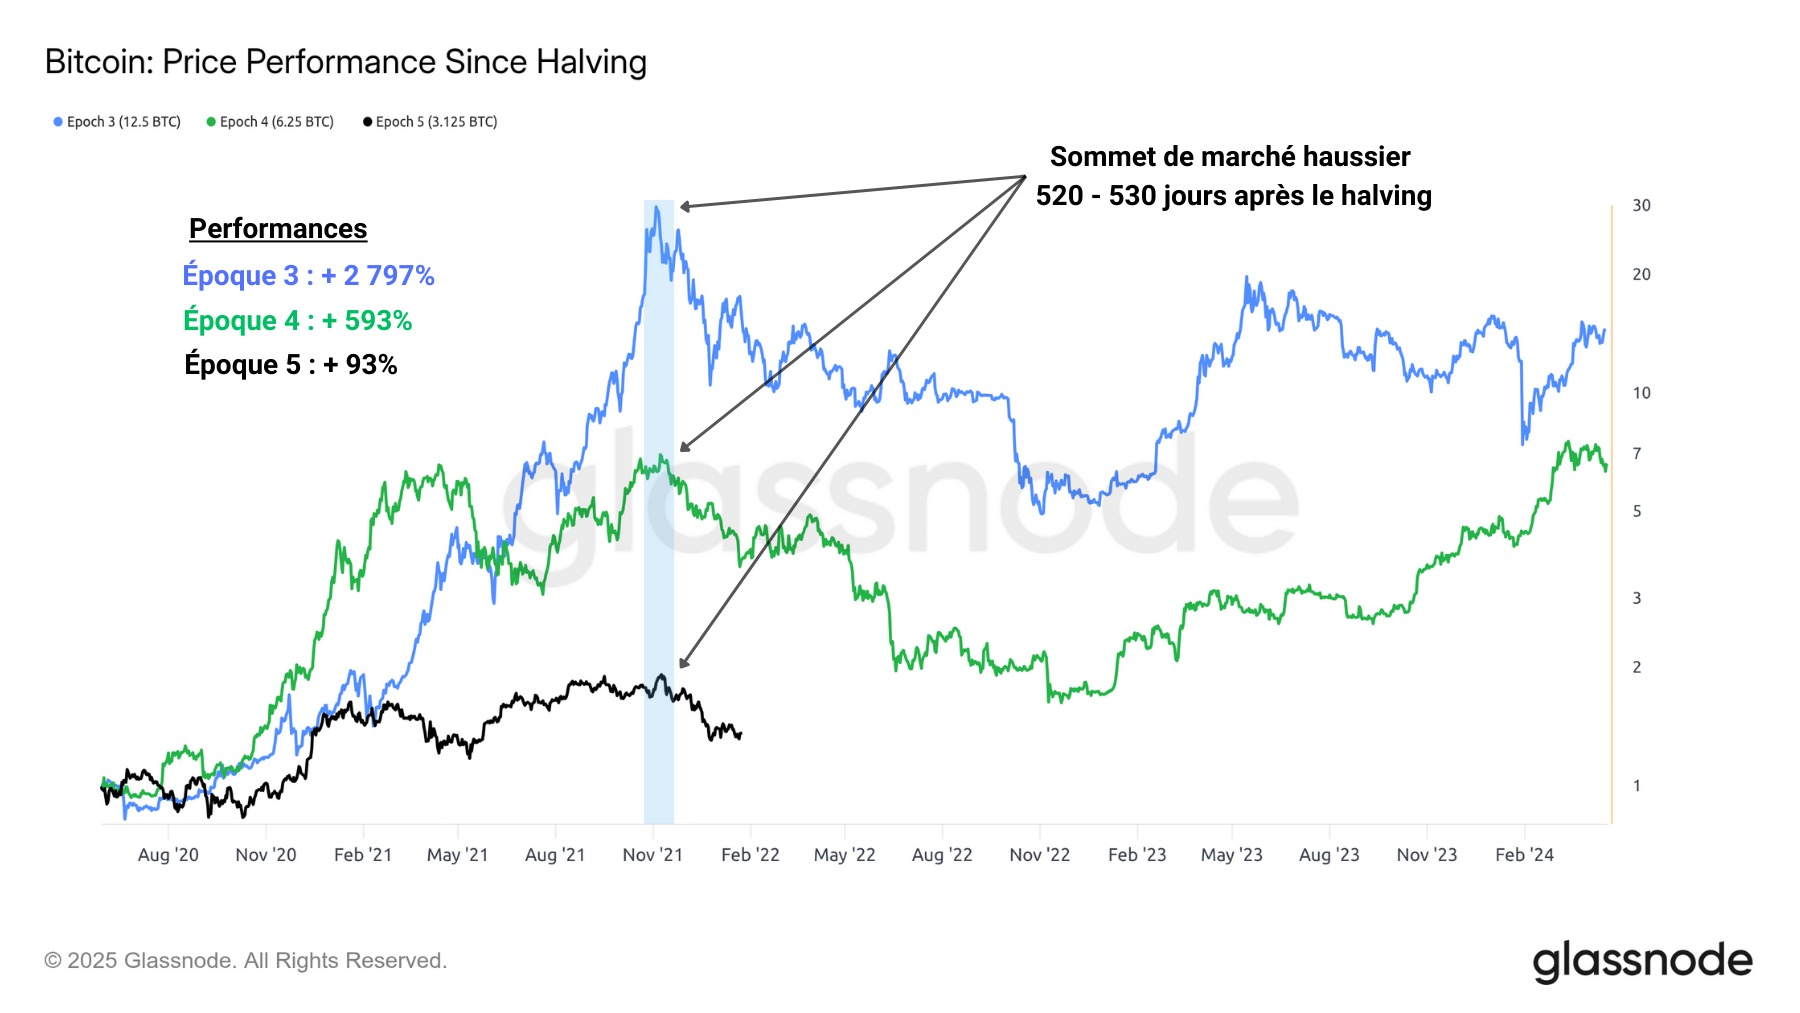
Figure 6: BTC Performance Since the Halving
A similar observation applies to the time elapsed between the low point of the previous bear market and the peak of the subsequent bull market. Historically, bull markets last between 1,050 and 1,060 days before reaching their peaks.
Once again, a notable decline in performance can be observed across the last three bull markets. The current market is the first to post a return of less than +1,000% since the low of the previous bear market.
Based on the patterns observed during the two previous cycles, BTC could now face an extended period of downtrend before reaching a low around November or December 2026.
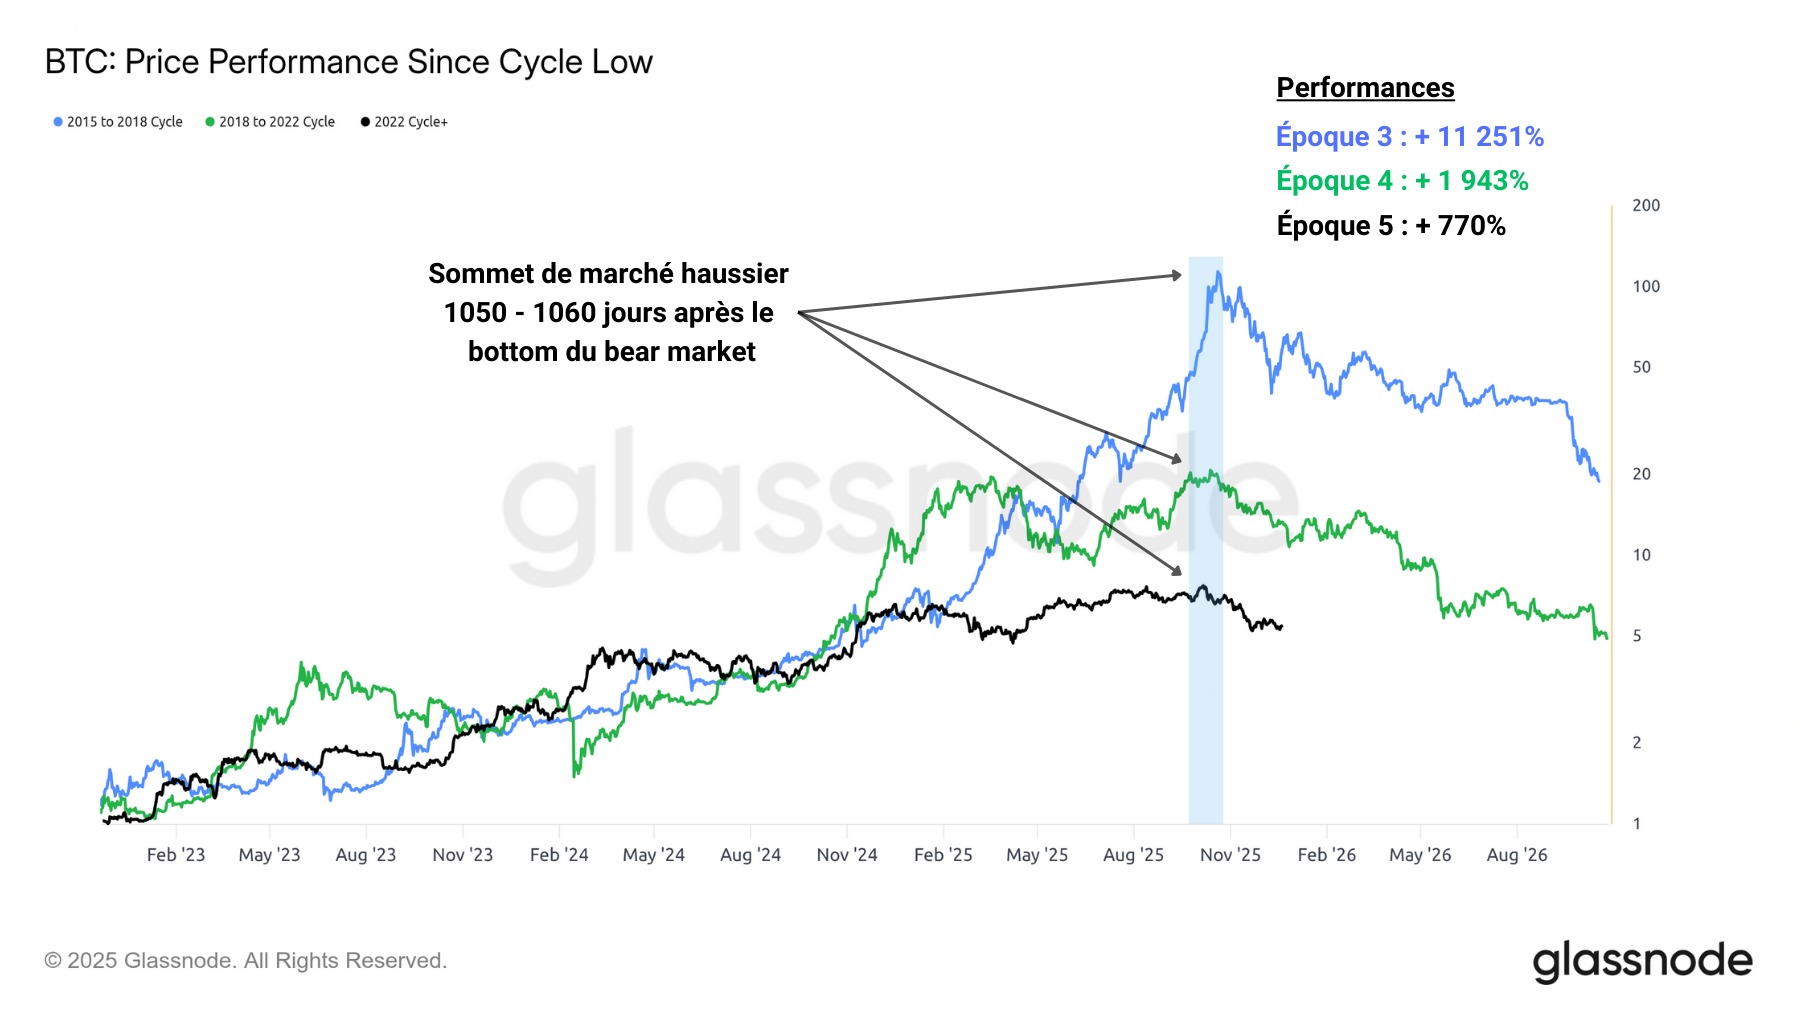
Figure 7: BTC Performance Since the Cyclical Low
Summary of this on-chain analysis of Bitcoin (BTC)
As 2026 begins, the BTC price is once again attempting to break through the key $95,000 threshold, while encouraging signals are emerging from on-chain data and the rotation of capital toward riskier assets.
However, if historical cyclical patterns were to repeat themselves, the market could still experience a prolonged period of weakness before hitting a new low toward the end of 2026.