: Lack of Spot Demand? On-Chain Analysis with Prof. Chaîne")
Recent Bitcoin on-chain data points to sustained bearish momentum across both short- and long-term timeframes. With inflows near zero in late November and early December, we cannot expect spot BTC ETFs to significantly drive a Bitcoin rally. Find out what on-chain analysis reveals.
Bitcoin’s Plunge
As the BTC price struggles to stay above $90,000, the likelihood of a dead cat bounce is growing.
Indeed, since the market entered bear market territory, demand—particularly in spot markets—has been lacking, preventing Bitcoin from staging a solid rebound.
What do recent flows tell us about participant behavior? Let’s take a look together!
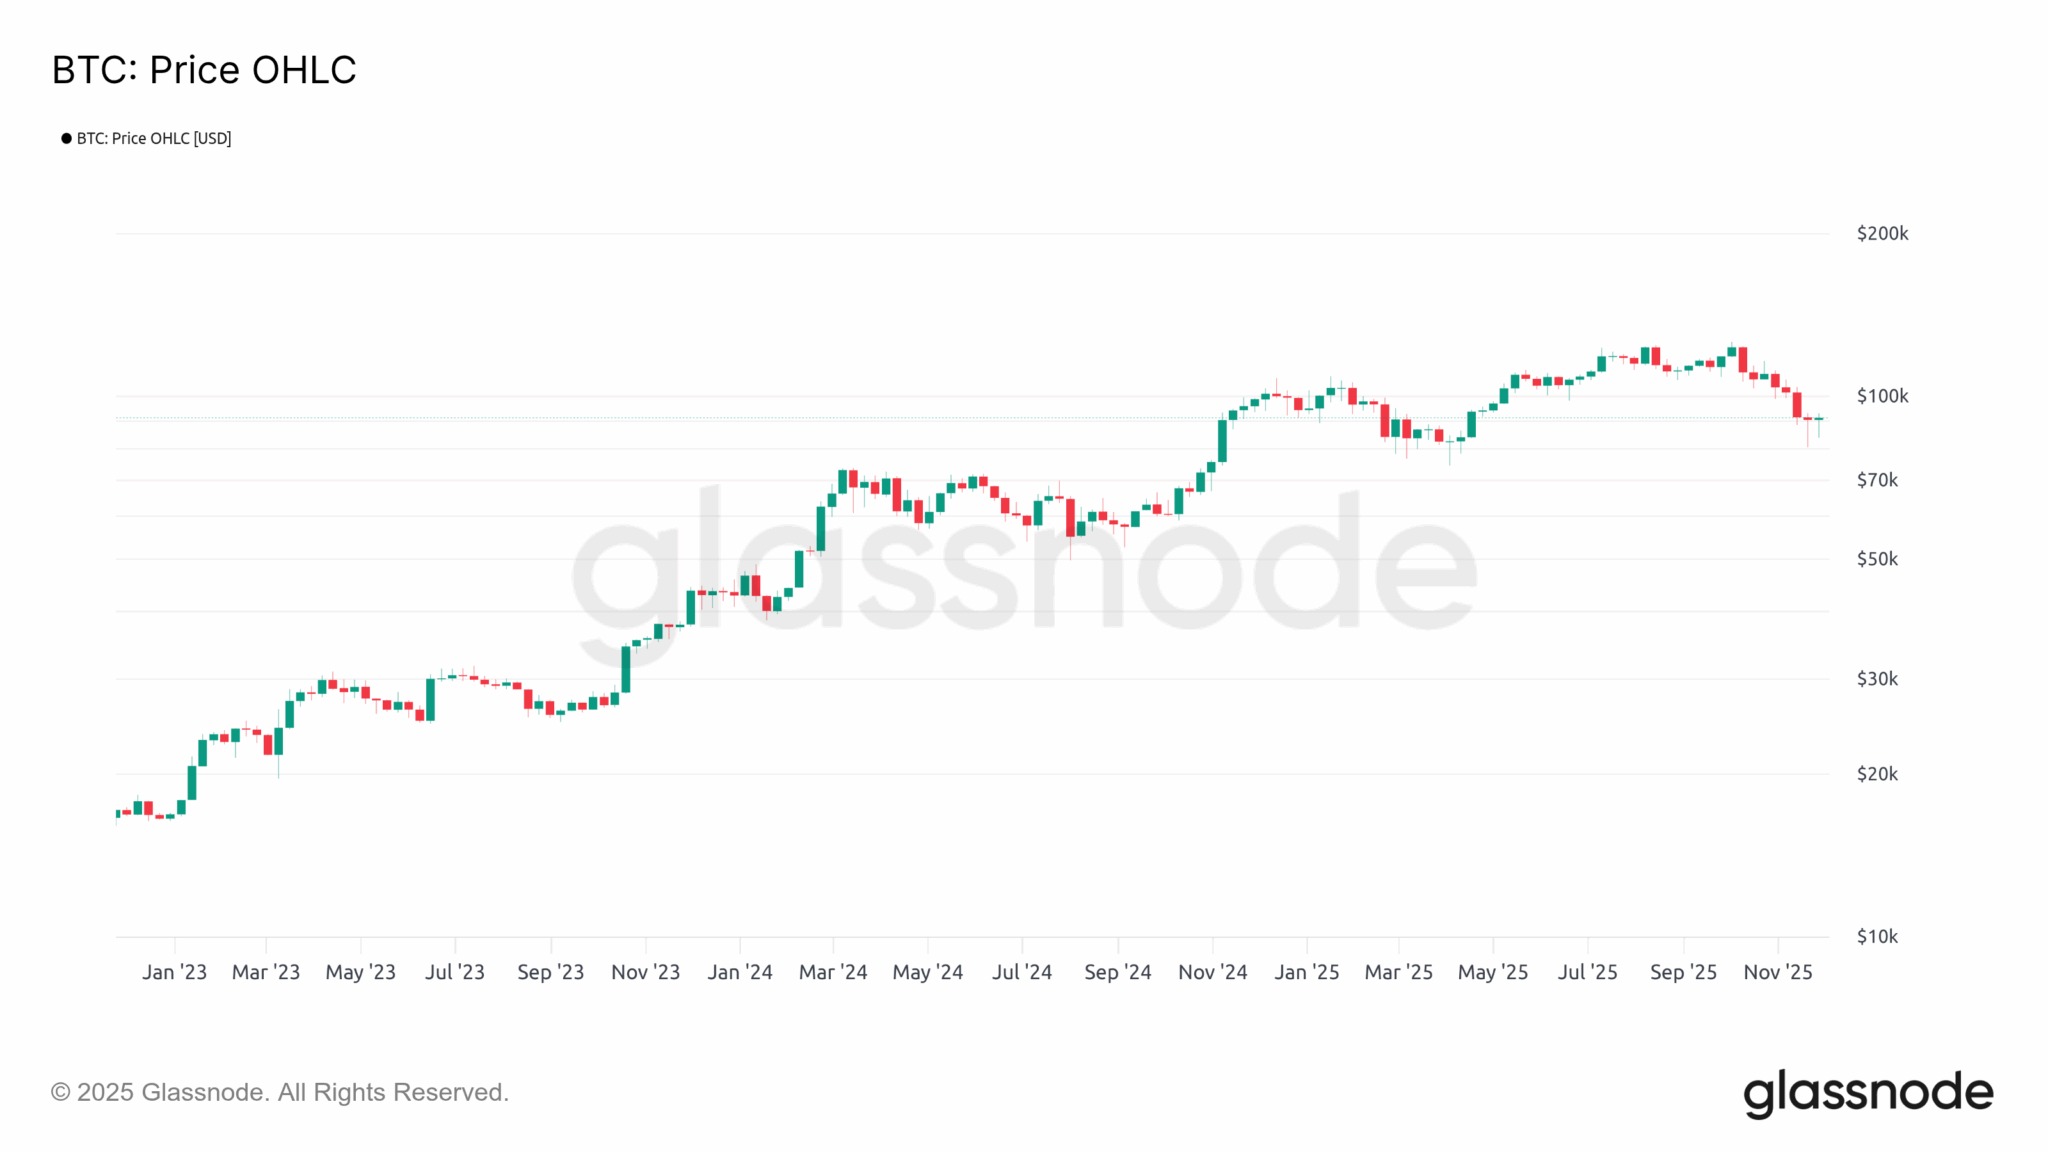
Figure 1: Daily BTC Price
Sustained bearish momentum
November 2025 saw a significant bearish performance (-17.5%) for the BTC price, similar to February of the same year.
While the magnitude of this decline remains moderate compared to previous bear markets, the impact on investor sentiment remains significant, with sentiment shifting from euphoria to sustained pessimism in just a few weeks.
This context prevents investors from maintaining a bullish bias, which is reflected in the supply and demand flows across various BTC spot and futures markets.
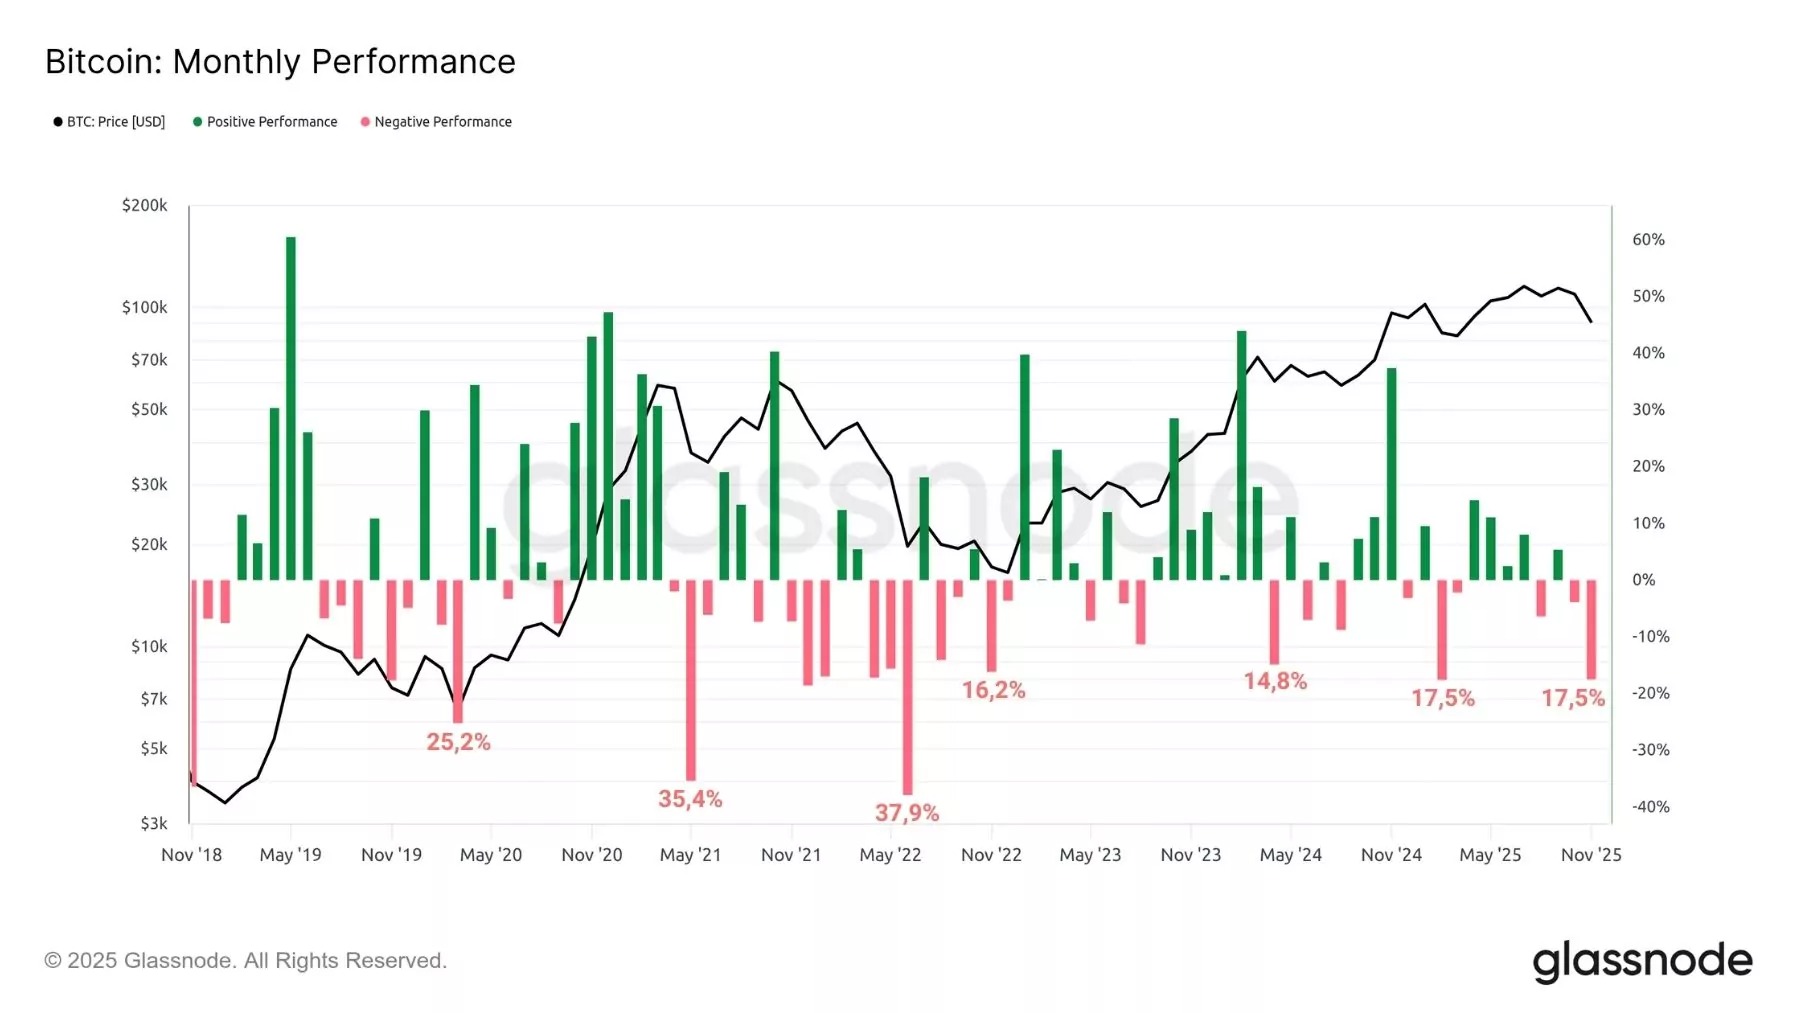
Figure 2: Monthly BTC Performance
The Bitcoin Momentum Oscillator (BMO) on-chain model, mentioned in our previous analyses, aggregates market profitability signals to estimate BTC’s cyclical position and the progress of the current momentum.
- A value of 1 indicates that the market’s bullish momentum is reaching its peak, with very high profitability and intense profit-taking behavior, which manifests near local and cyclical peaks;
- A value of -1 indicates that bearish market momentum is reaching its limit, with very low profitability and intense loss-cutting behavior, which contributes to the formation of local and cyclical lows.
Since the beginning of November, the BMO has registered a value of -0.33, a moderate bearish signal indicating that the long-term trend for BTC continues to deteriorate.
Historically, these transitions into bearish territory have accompanied the end of uptrends in the Bitcoin market, giving way to a prolonged period of price decline.
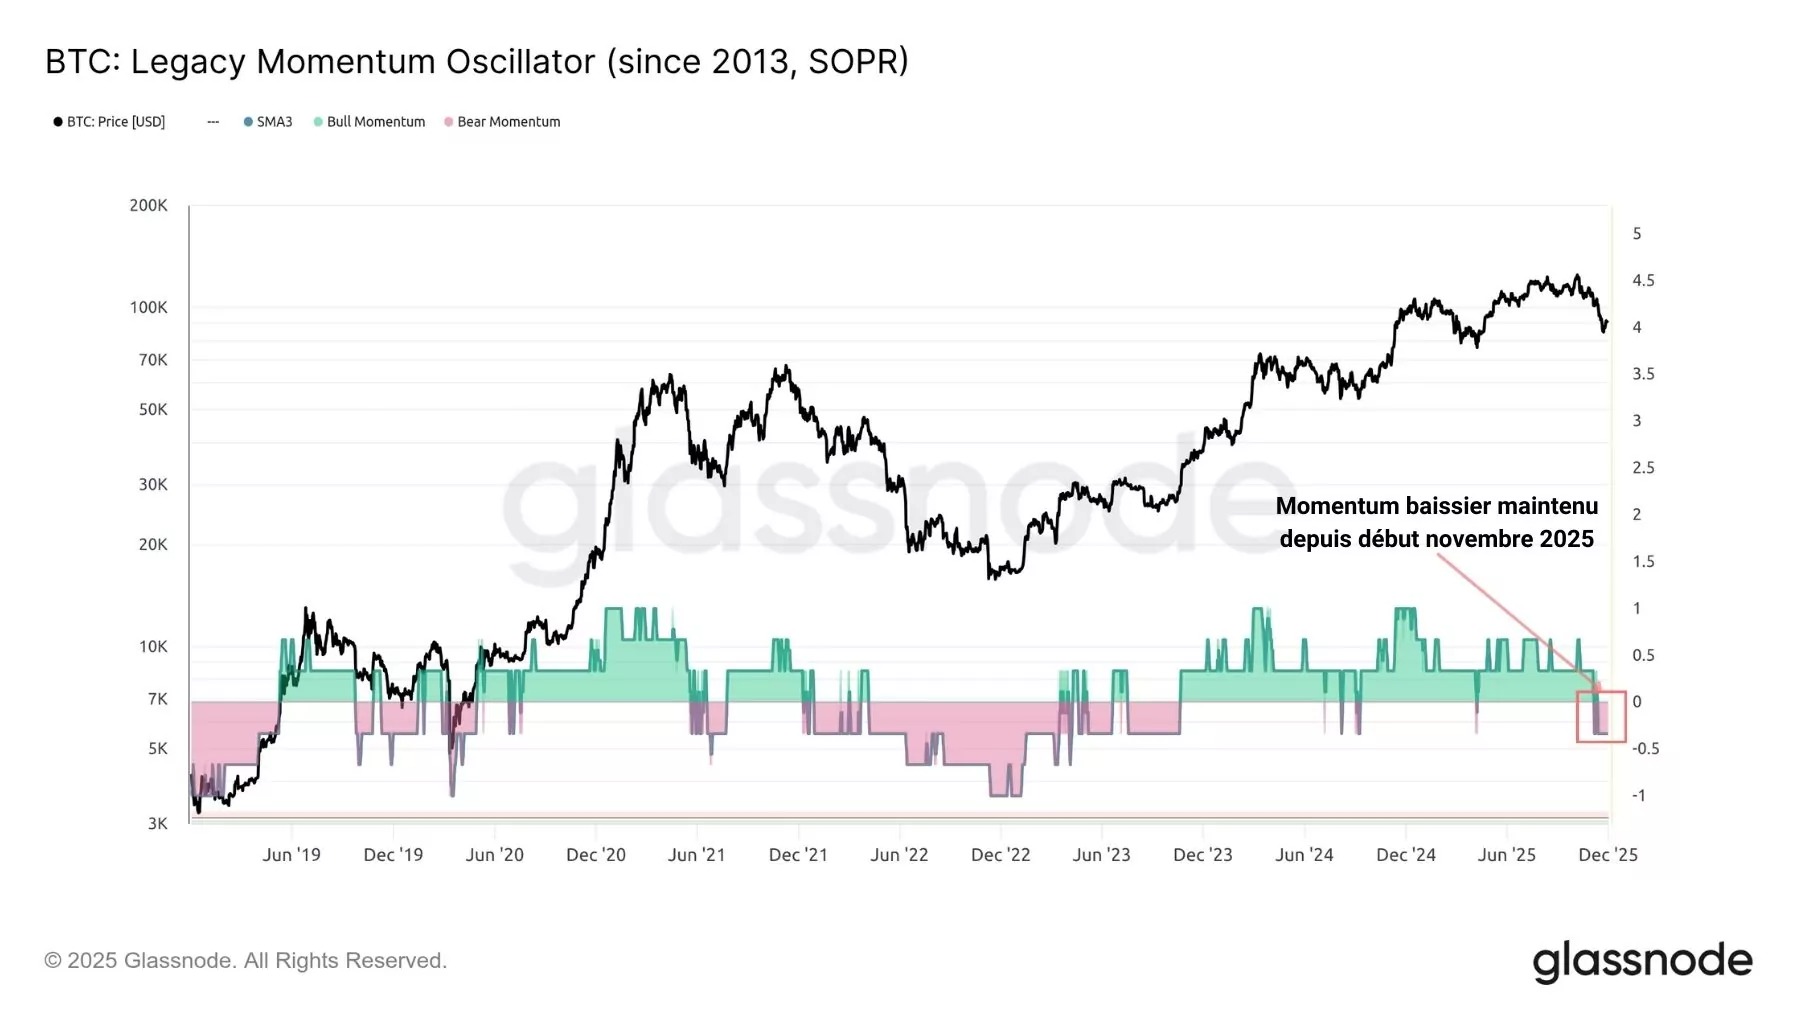
Figure 3: Bitcoin Momentum Oscillator Model
Regarding recent momentum, the STH-SOPR ratio tracks the spending behavior of recent entrants to gauge the strength of short-term momentum.
- Above 1, short-term investors are realizing profits, within an optimistic and bullish context;
- Below 1, short-term investors are taking losses, in a pessimistic and bearish environment.
With this indicator remaining below 1 since the $100,000 threshold was breached, short-term momentum remains bearish, and short-term investors are unable to get their heads above water.
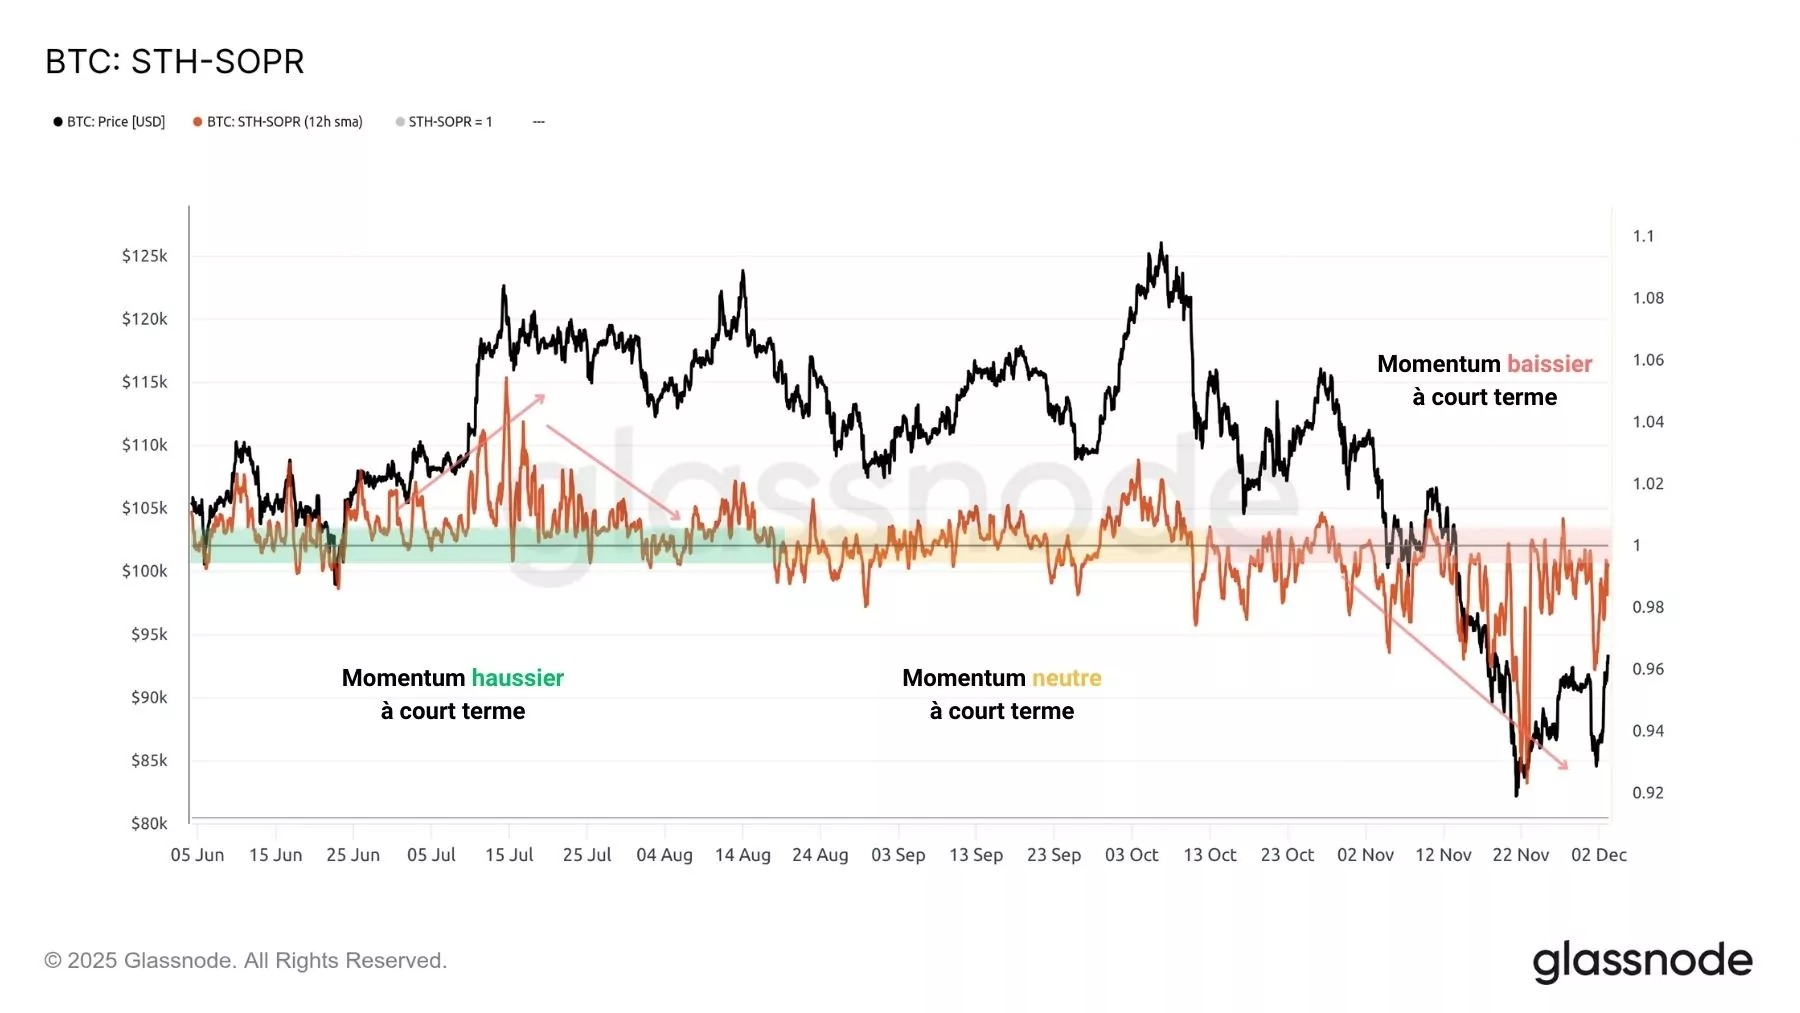
Figure 4: BTC STH-SOPR Ratio
Limited demand for Bitcoin?
In our analysis last week, we noted that selling pressure on exchanges and Bitcoin ETFs was easing, though no major demand flows had emerged.
As for spot BTC ETFs, the picture remains the same:
- selling pressure over the past few weeks has indeed slowed, helping the market stabilize;
- inflows in late November and early December are nearly zero, confirming that institutional buyers are hesitant to re-expose themselves to Bitcoin.
For now, we cannot expect ETFs to significantly stimulate a BTC rebound, despite the fact that asset management giant Vanguard now allows crypto ETFs.
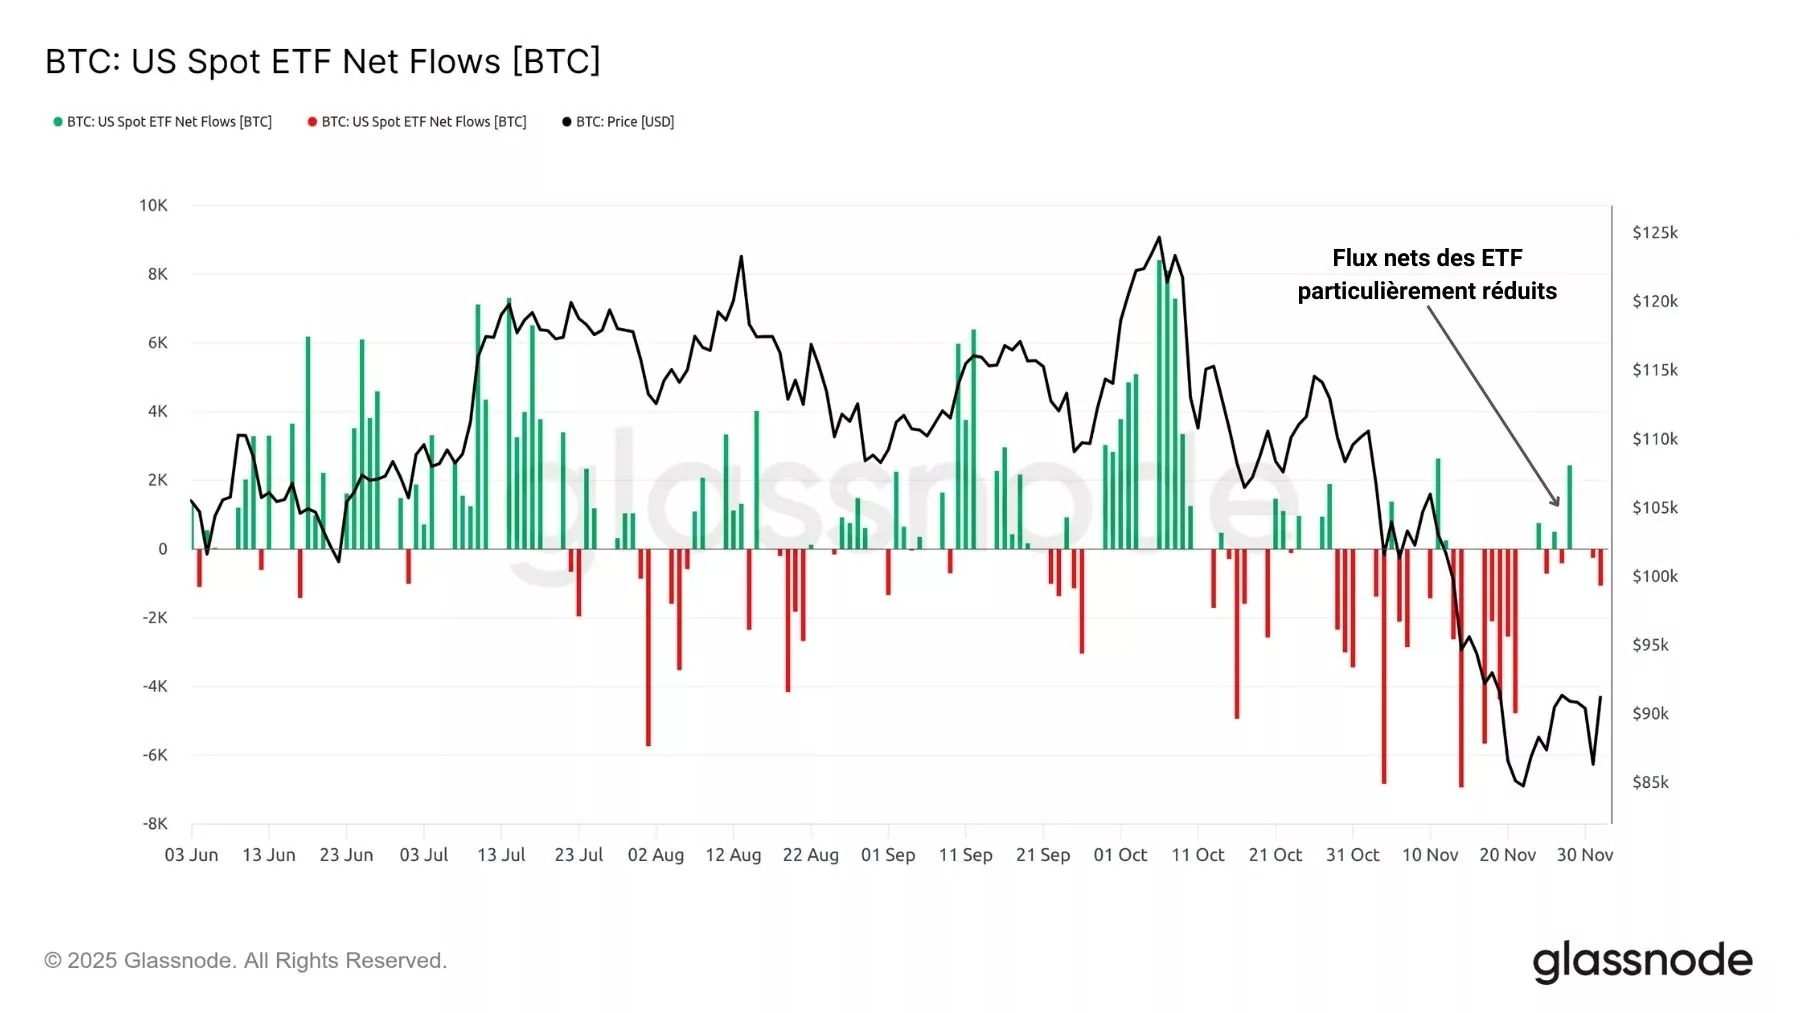
Figure 5: Net flows of spot BTC ETFs
Regarding centralized spot exchanges, the reduction in selling pressure has turned into moderate demand, ranging between 1,000 BTC and 500 BTC per day over the past few days.
However, the trend appears to be slowing. We will need to closely monitor this dynamic in the coming days and weeks to assess whether demand pressure from centralized spot exchanges is increasing or not.
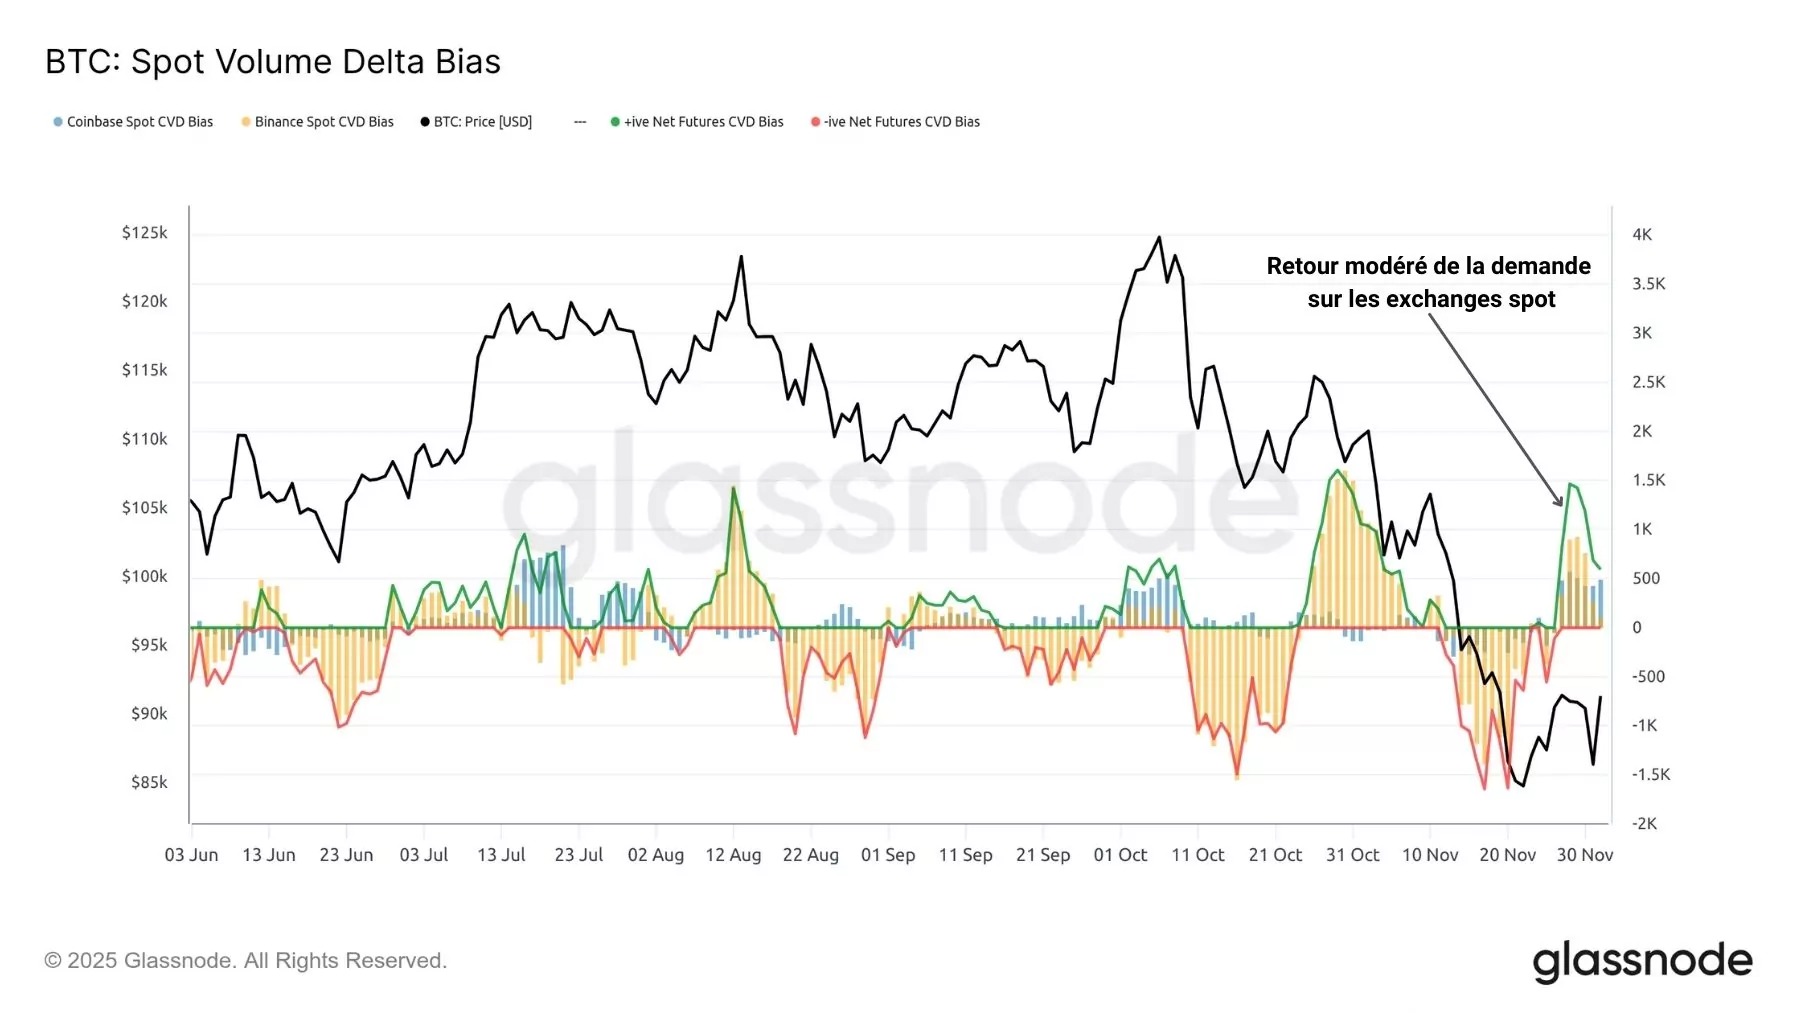
Figure 6: Net flows from centralized spot exchanges
On the Bybit and Binance futures markets, net flows are at a standstill, balancing out so that no clear directional bias is evident.
For now, speculators appear split between opening new long and short positions, while volatility is taking a toll on highly leveraged positions.
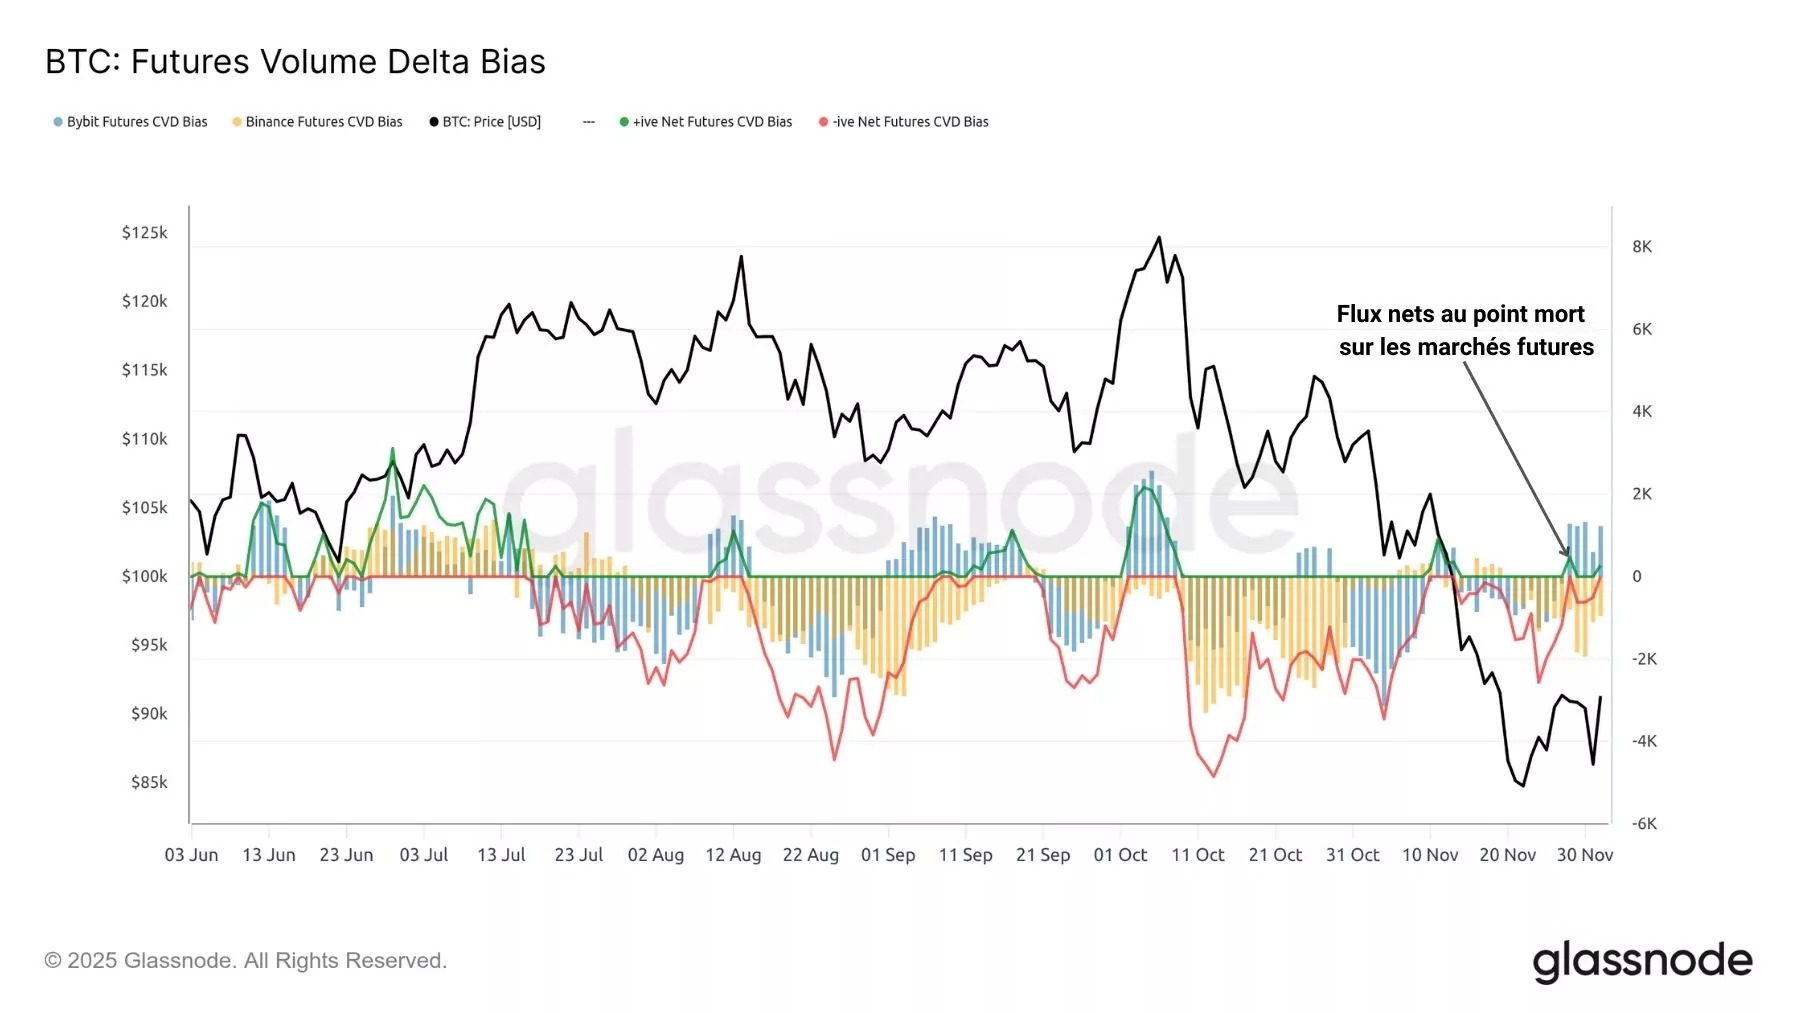
Figure 7: Net flows on centralized futures exchanges
Finally, there is now a major cluster of liquidity above the current price, fueling hopes of a bullish recovery, potentially catalyzed by a short squeeze.
If the price manages to rise high enough to trigger the liquidation of short positions up to $100,000, this could reignite the bullish momentum. Perhaps there is still hope for the BTC uptrend, even as long positions are being liquidated in the short term.
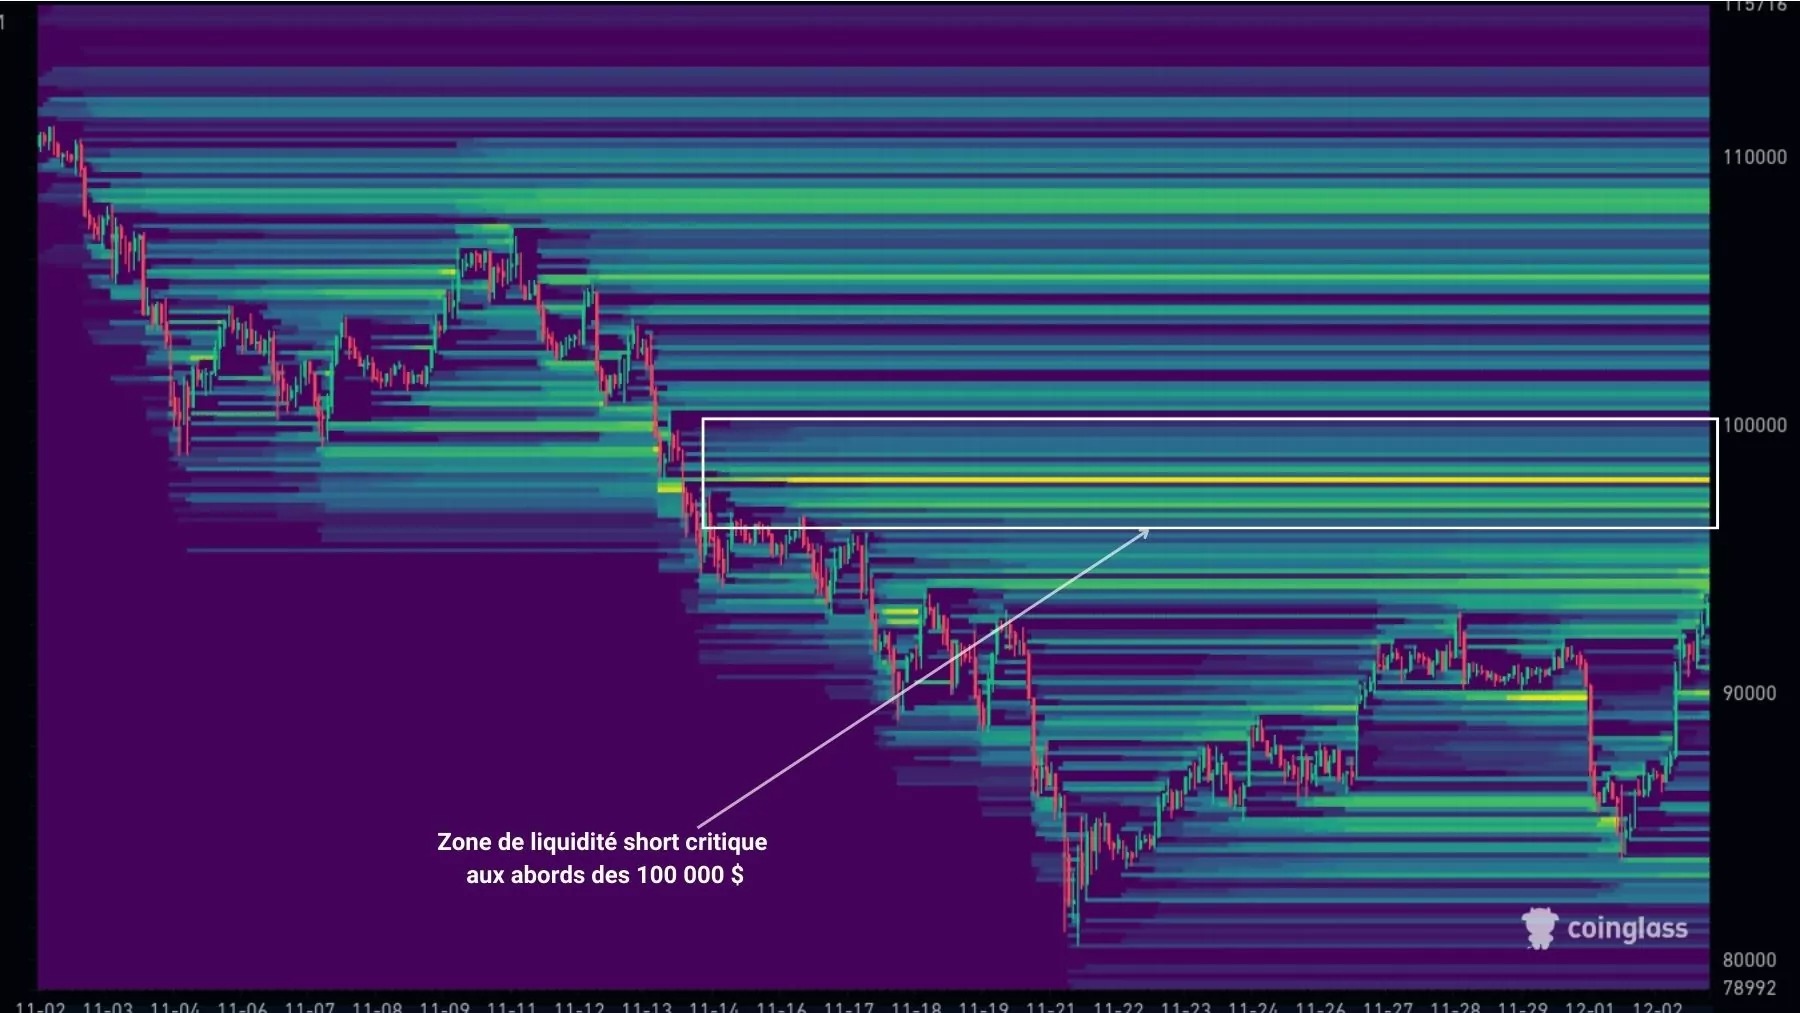
Figure 8: Future Liquidity Heatmap
Summary of this on-chain analysis of Bitcoin (BTC)
In summary, recent on-chain data indicates that BTC’s bearish momentum persists across both short- and long-term timeframes.
With inflows near zero in late November and early December, we cannot expect ETFs to significantly drive a BTC rebound.
Regarding centralized spot exchanges, the reduction in selling pressure has shifted to moderate demand, ranging between 1,000 BTC and 500 BTC per day.
On the Bybit and Binance futures markets, net flows are at a standstill, balancing out so that no clear directional bias is evident.
Finally, a major cluster of short liquidity near the $100,000 level is fueling hopes for a bullish recovery, potentially catalyzed by a short squeeze.