
Almost three months after The Merge, Ethereum (ETH) simulations following both consensus models are starting to gain relevance. The data shows us that if the blockchain had remained at proof-of-work, more than a million additional ETH would have been created
With an Ethereum PoW, there would be one million more ETH
It’s been nearly three months since the Ethereum Merge (ETH), marking the shift from proof-of-work (PoW) consensus to proof-of-stake (PoS) consensus. Beyond the technological feat that this event represents, it also greatly reduced the creation of new ETH, to the point that without it, more than a million new units would have been created:
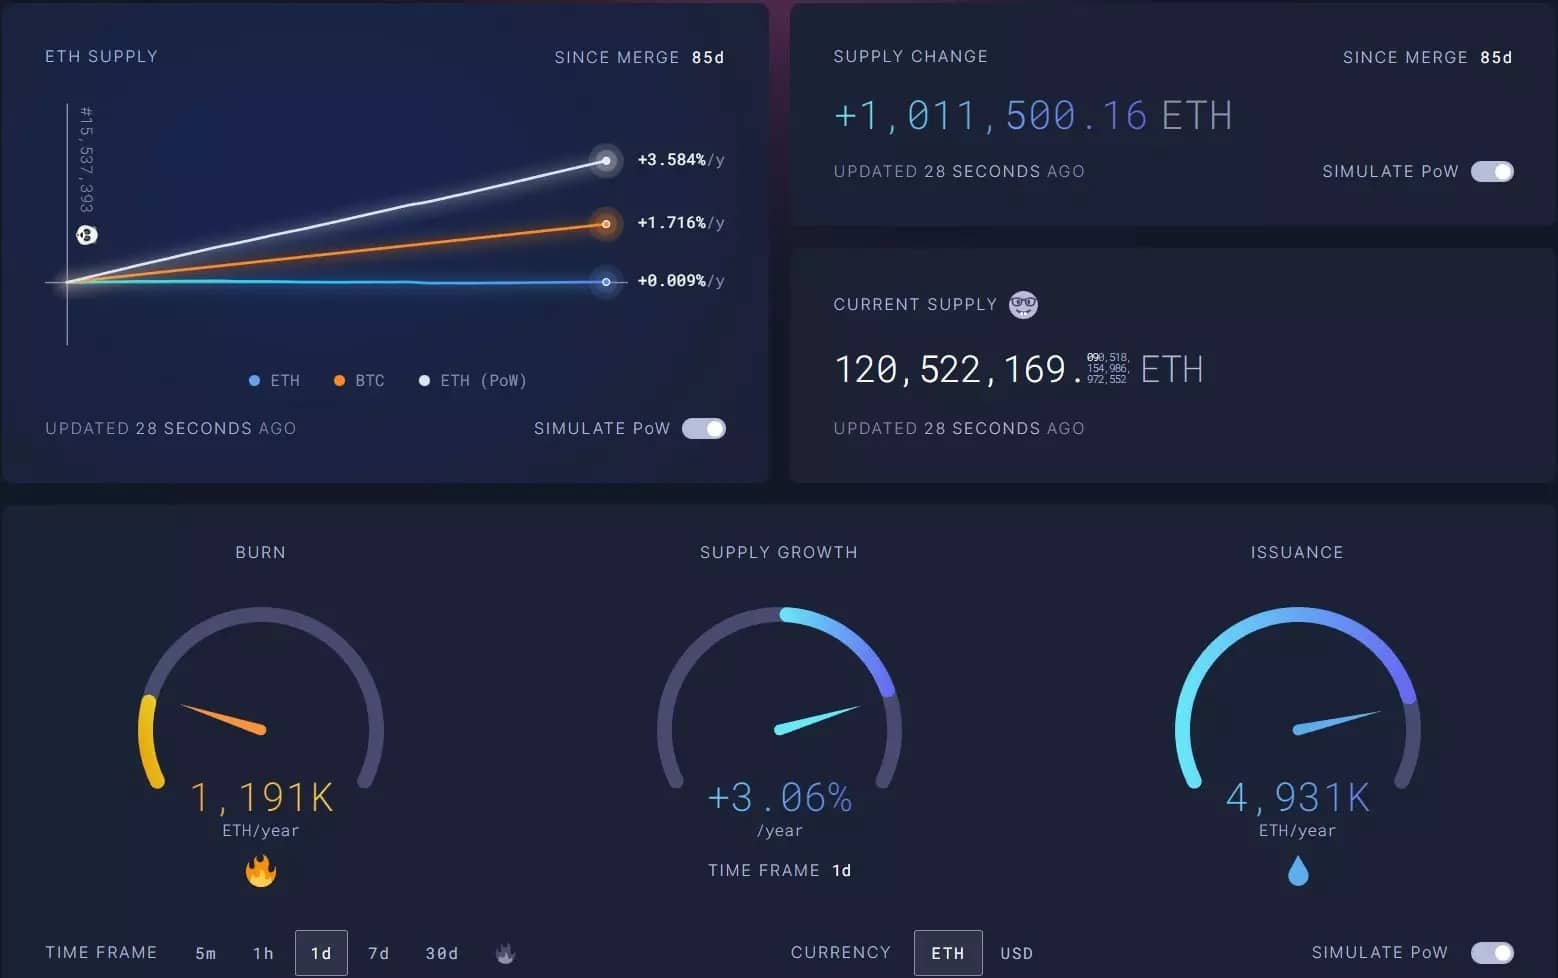
Figure 1 – Simulation of the evolution of the distribution in a PoW model
So in a PoW model, about $1.28 billion of money supply would have been created. Projecting the data on an annual basis, this would be equivalent to 3.06% inflation for 3.7 million new ETH.
But thanks to a shift to a PoS consensus, this is not the case. With the current state of the Ethereum blockchain, the network would even be deflationary when taking data on a daily basis, i.e. -0.47% per year, and neutral when taking 30-day data:
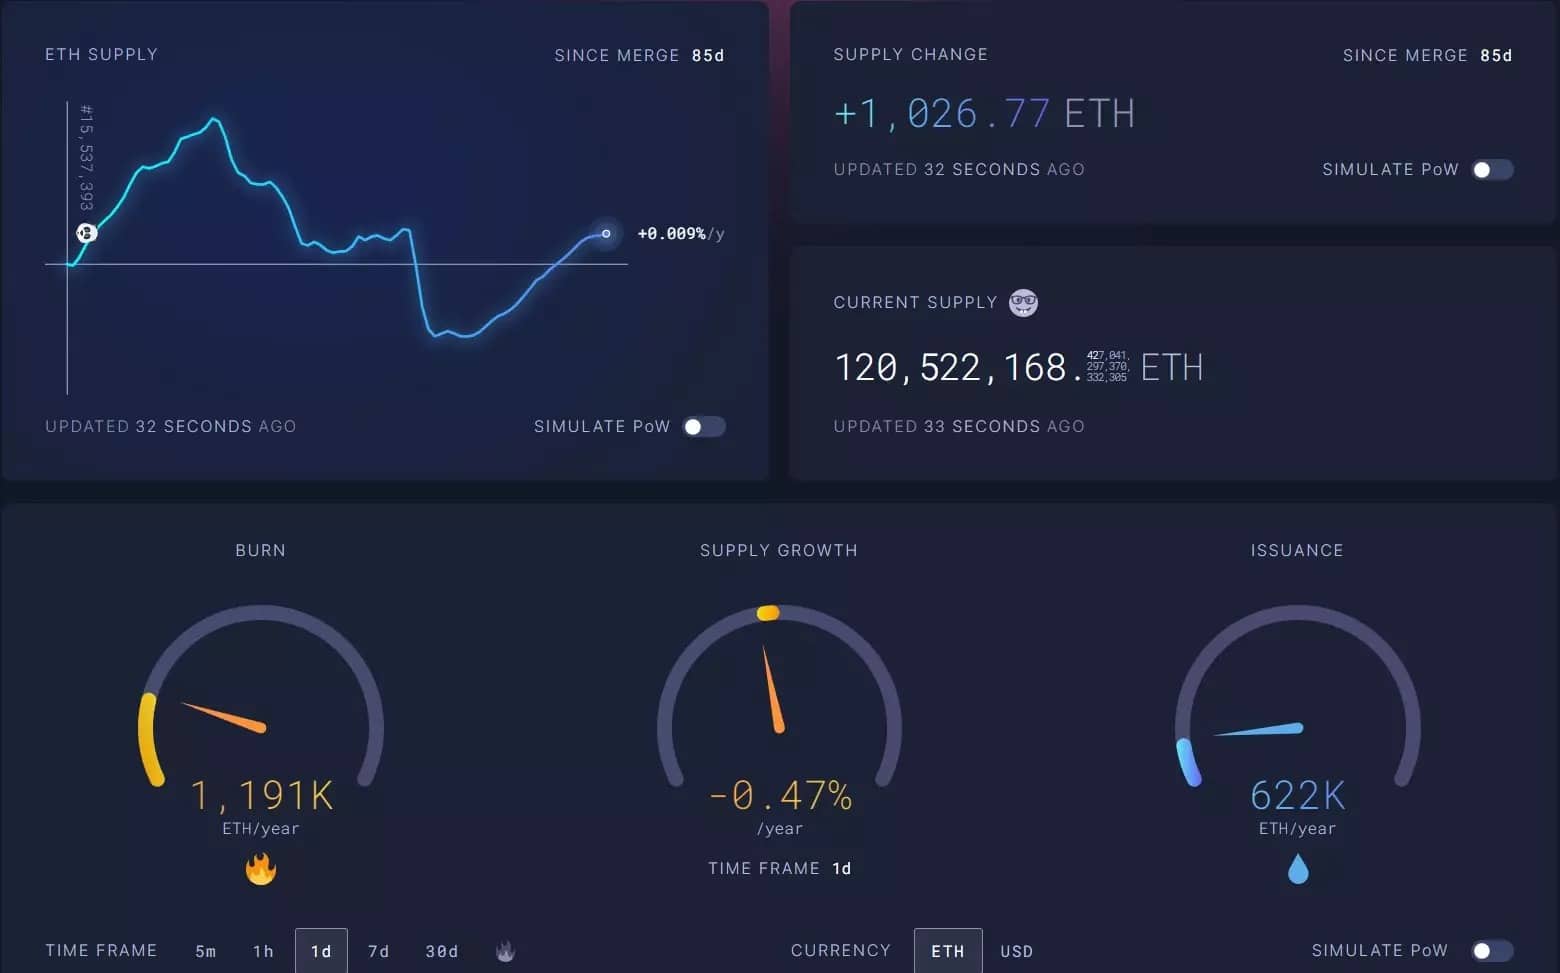
Figure 2 – Evolution of ETH distribution since The Merge
However, it should be noted that these figures are subject to change depending on the demands on the network
Network load on lower levels
As it has been doing for several months now, the Ethereum blockchain is at a particularly low level of demand. The number of daily active addresses has fallen back below 400,000, which has not happened since the beginning of the bull run in 2021, with one exception last June.
In the last 24 hours, this figure was around 380,000 addresses:
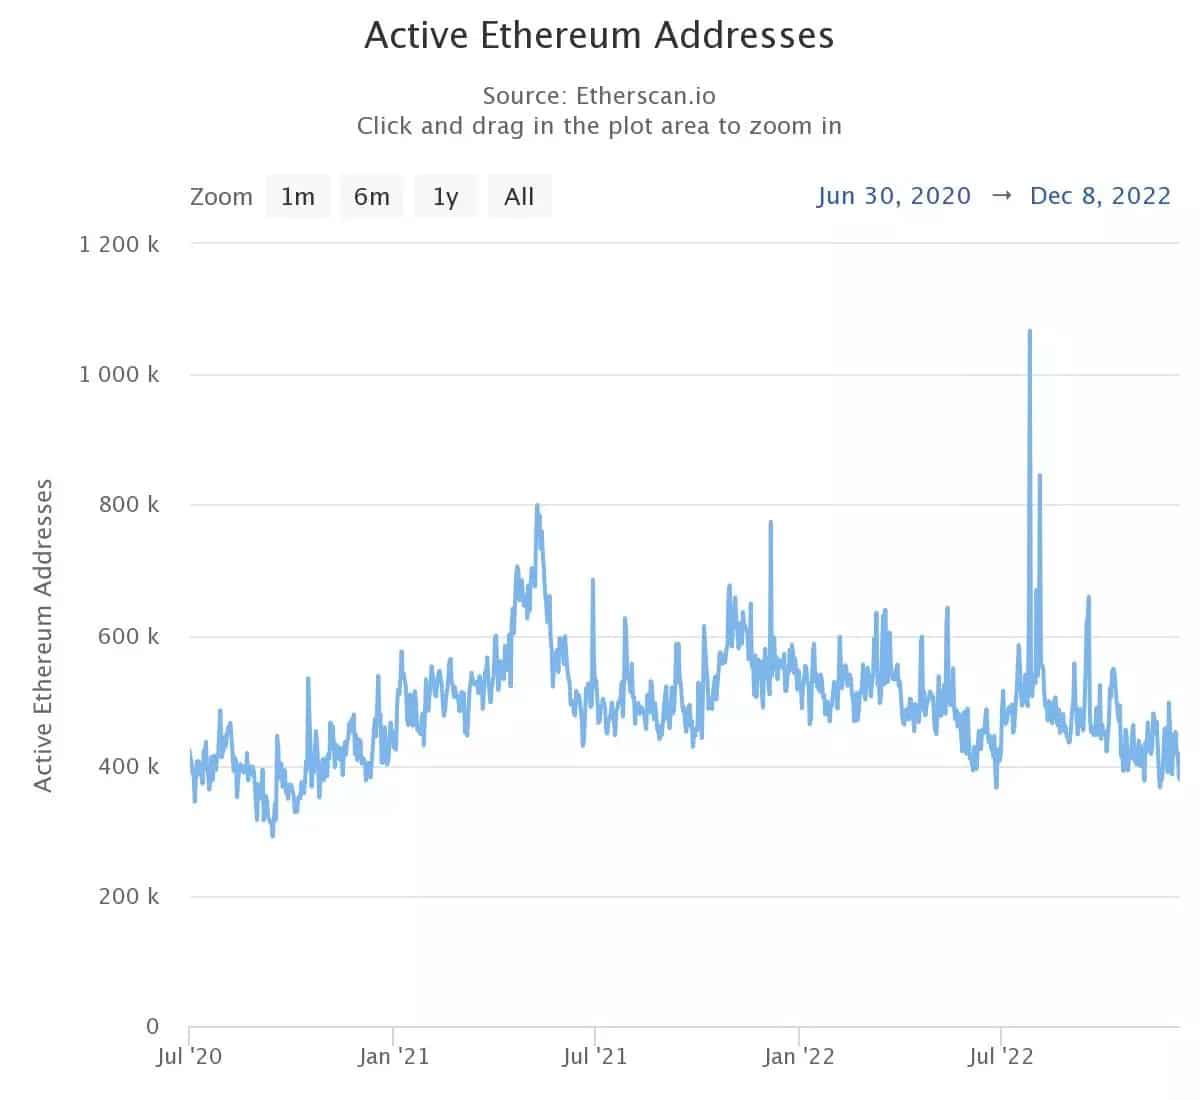
Figure 3 – Number of daily active addresses on the Ethereum blockchain
On the transaction fees side, the trend is also flat. For several months now, the average cost of a transaction has been falling steadily below 2 dollars, which again has not been seen since the end of 2020 :
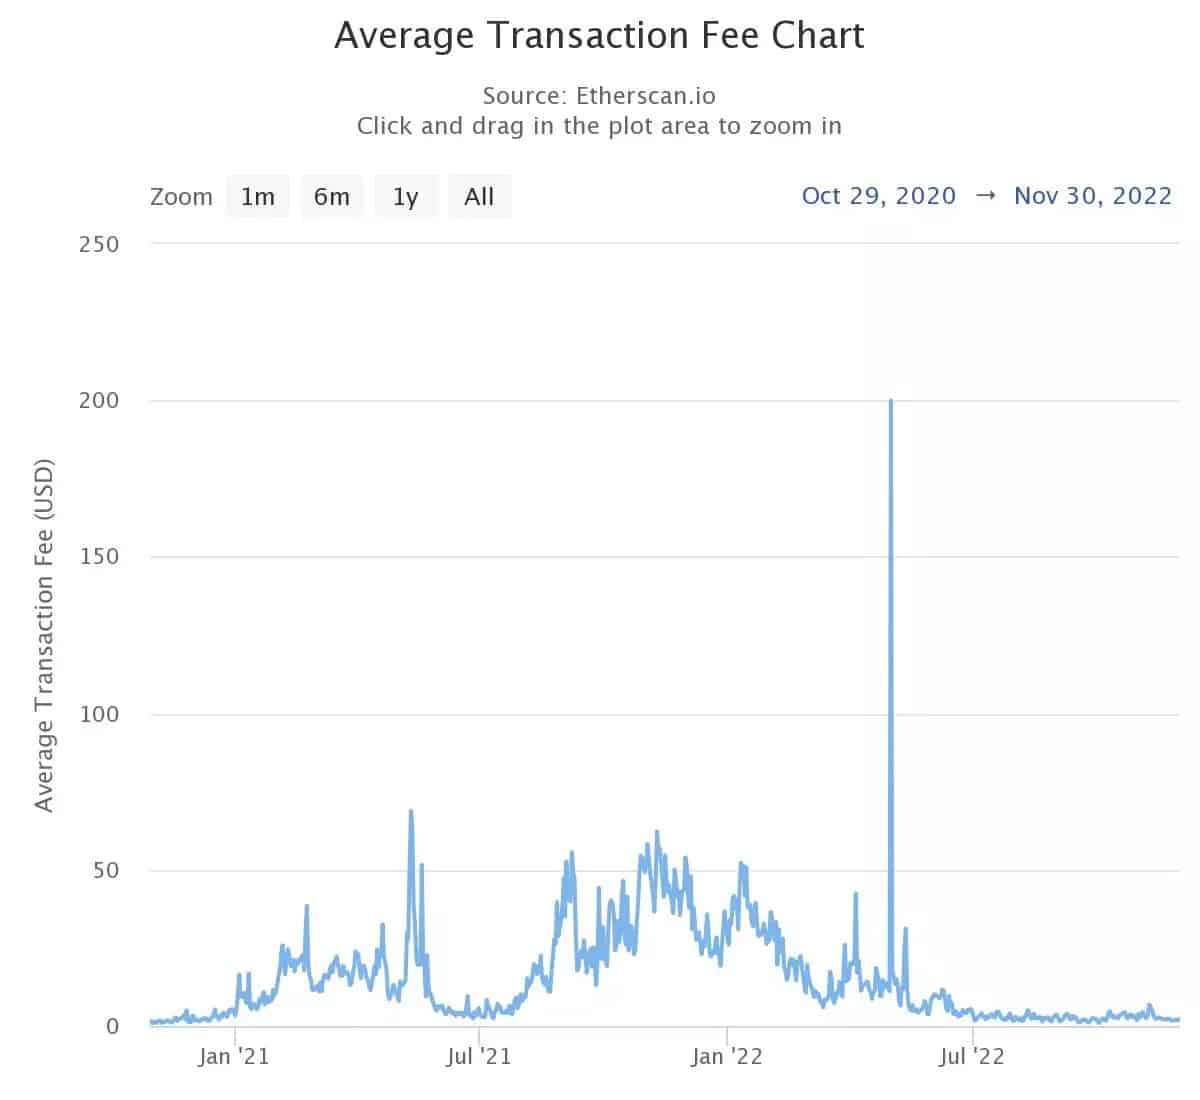
Figure 4 – Average price of a transaction since end 2020
To better appreciate the trend line, we need to zoom in a bit by looking at the data since the last historical high (ATH) of the cryptocurrencies in November 2021. Indeed, with the exception of a statistical outlier during the launch of Yuga Labs’ Otherside metaverse land sale last spring, transaction fees on the Ethereum blockchain are getting lower and lower:
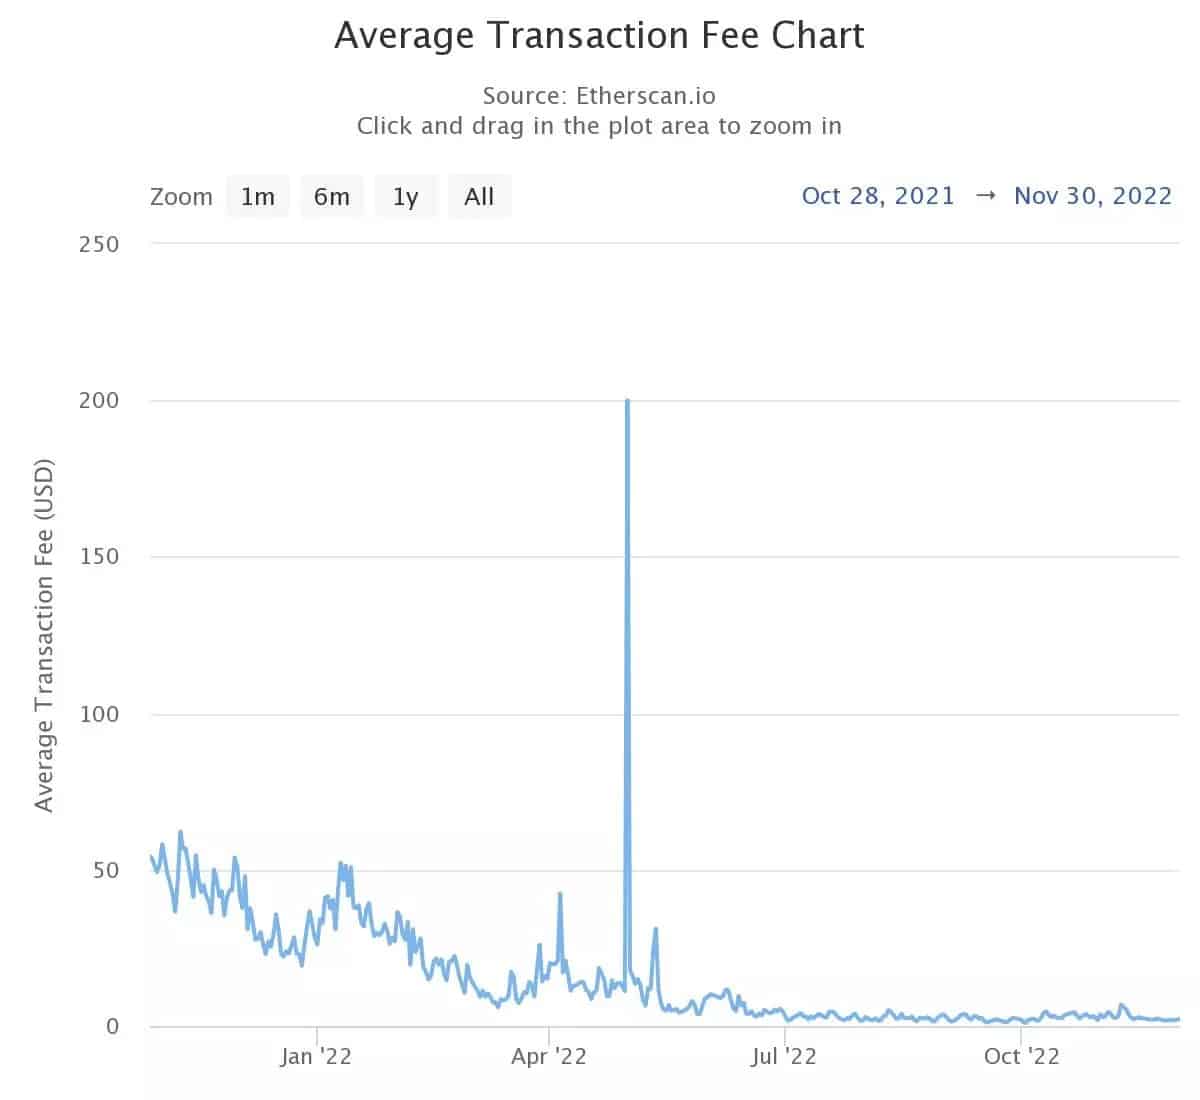
Figure 4 – Average transaction price since the last historical high
Despite the gloomy price situation, we can still be optimistic, arguing that such cheap transaction fees are an opportunity to make moves on addresses more easily than in busy times.