
While it is currently stuck around $30,000, Bitcoin could end up at $42,000 in the next few weeks if it manages to regain this level in support. But for the time being, nothing is certain. Here are the different targets to watch for BTC
Bitcoin (BTC) stalls below its weekly resistance
In June, the price of bitcoin (BTC) finally managed to get back to around $30,000. Now, a major test is under way, since as we can see on the Weekly chart, the price is still stuck below the $30,000 – $32,000 area (yellow rectangle), a level that acted as support throughout the previous Bull Run phase and which has now become a major resistance zone to be broken.
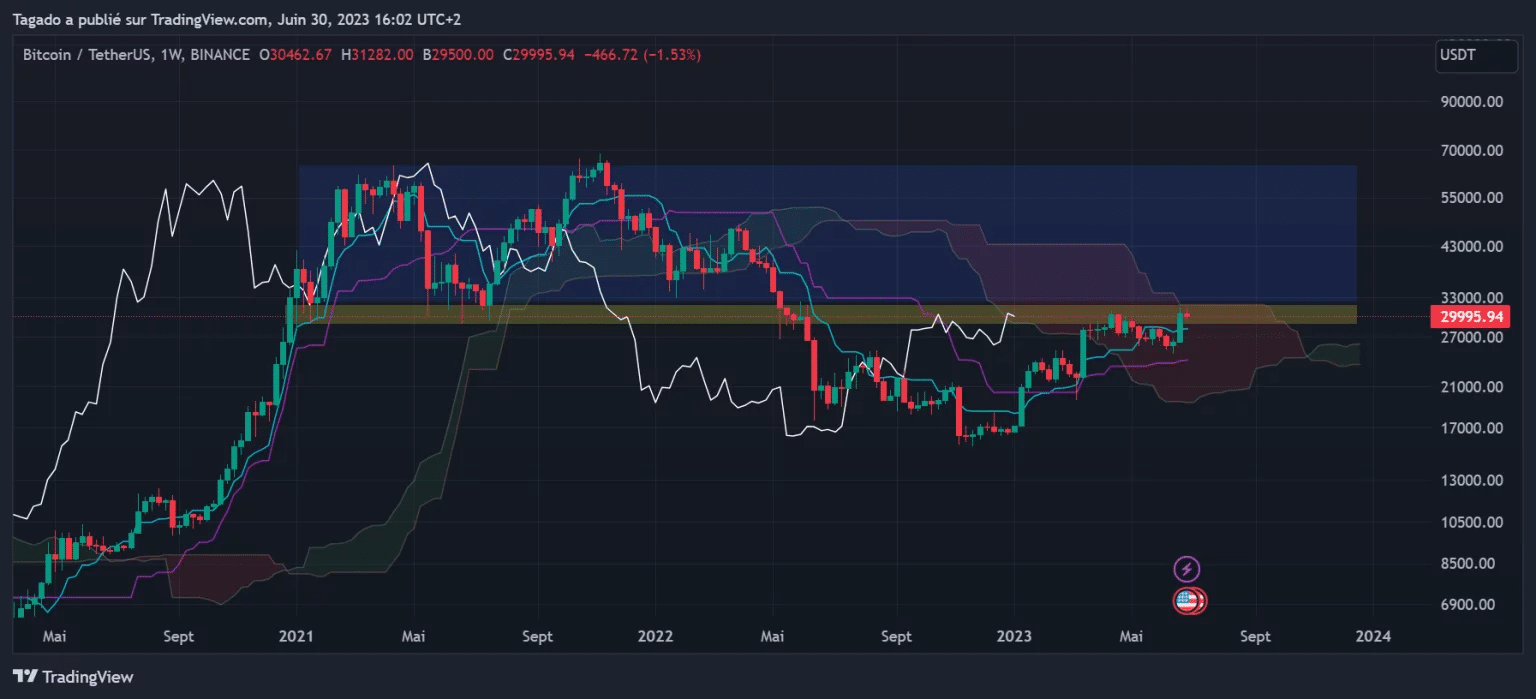
Figure 1 – Weekly Bitcoin price chart
It will therefore be vital to break through this resistance again and regain the large blue rectangle, which would mean the price returning to its former range phase, with the Ichimoku system providing support. In the meantime, it will be interesting to watch the next weekly closes to see if the price manages to break the SSB, which is also acting as resistance.
There is still a long way to go, and a retreat below $32,000 could still send the price on another downward leg in the coming weeks, so it is important to wait for confirmation. If the price breaks through this zone, however, there is a good chance that it will continue to rise towards $42,000, the next level of SSB resistance.
Bitcoin (BTC) soon to reach $42,000
On a lower timeframe, Bitcoin is still stuck below its resistance around $32,000. As mentioned above, breaking through this resistance again would allow BTC to rally towards the SSB Weekly at around $42,000, a level that would correspond perfectly with a return of the price to the upper part of the yellow ascending broadening pattern in which the price has been moving since the start of the year.
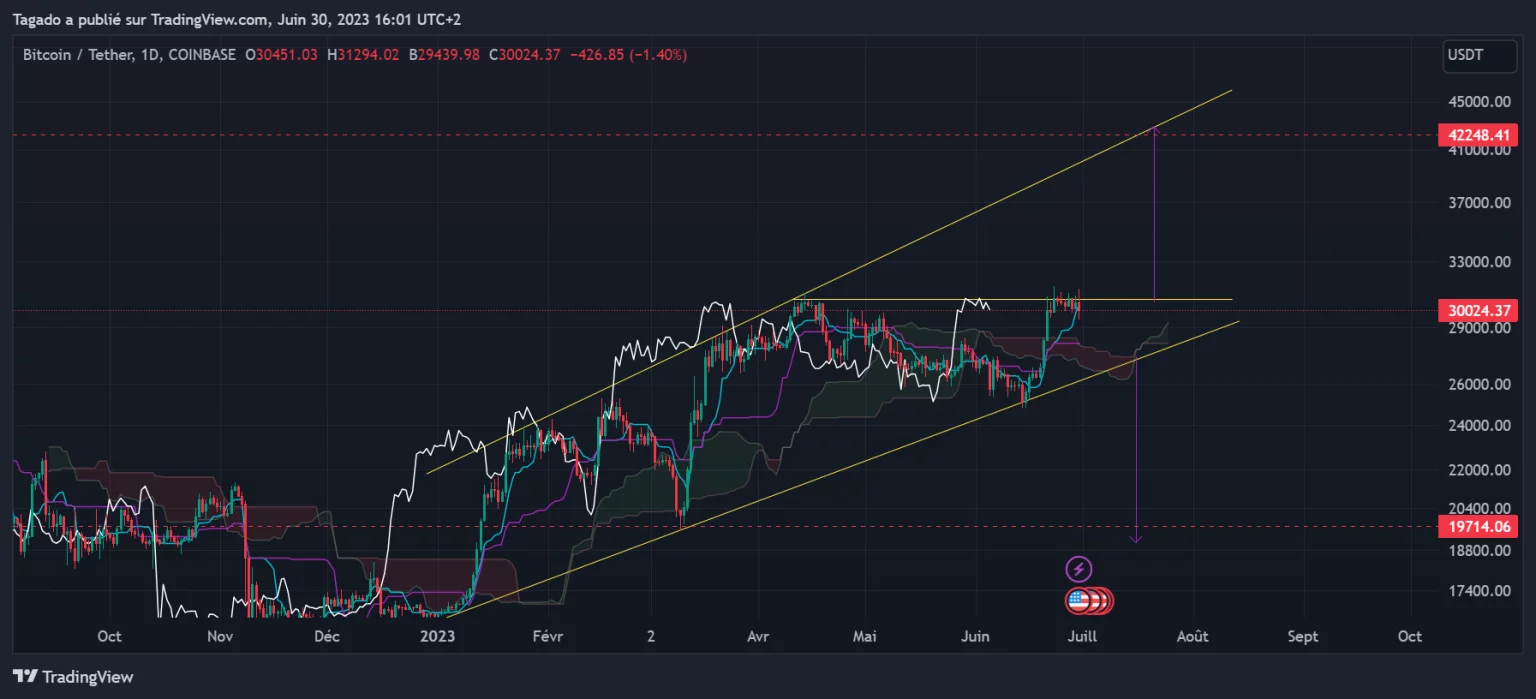
Figure 2 – Daily Bitcoin price chart
So will the price manage to break through this resistance or should we expect a rejection? The next few days will tell. However, we must be careful that BTC does not fall back below $28,000, as this would mean a break of the pattern’s lower trend line, with a potential downside target of around $20,000.
Conclusion of this technical analysis
In the coming days, Bitcoin will have to break through its resistance at $32,000 to give a new bullish signal and allow the price to soar towards $42,000. So, is this a further rise or a rejection? Have your say in the comments