
Is Ethereum on track to outperform the market and finally enter a price discovery phase above $5,000? Many are asking this question, as the road ahead remains fraught with obstacles. However, the first signs of a sustained return to the $4,000 to $4,900 range could well pave the way for this new dynamic.
There is no respite on the markets
It is Wednesday, October 15, 2025, and the price of Ether is hovering around $4,100.
Our last technical analysis of ETH was on September 25, 2025, when the price was hovering around $4,000.
The market climate remains tense, with the trade war between China and the United States once again taking center stage.
This 2025 saga is being closely watched by investors, as evidenced by the reaction of the VIX, which responds sharply to every statement from both sides. Last Friday, it rose from 16 to 22 following Donald Trump’s first provocative statements. However, Jerome Powell’s statements yesterday afternoon reassured the markets about the trajectory envisaged by the US Federal Reserve.
The Fed appears to be open to both further rate cuts and an end to its quantitative tightening, reflecting a certain confidence in the continued decline in inflation and a recovery in the job market.
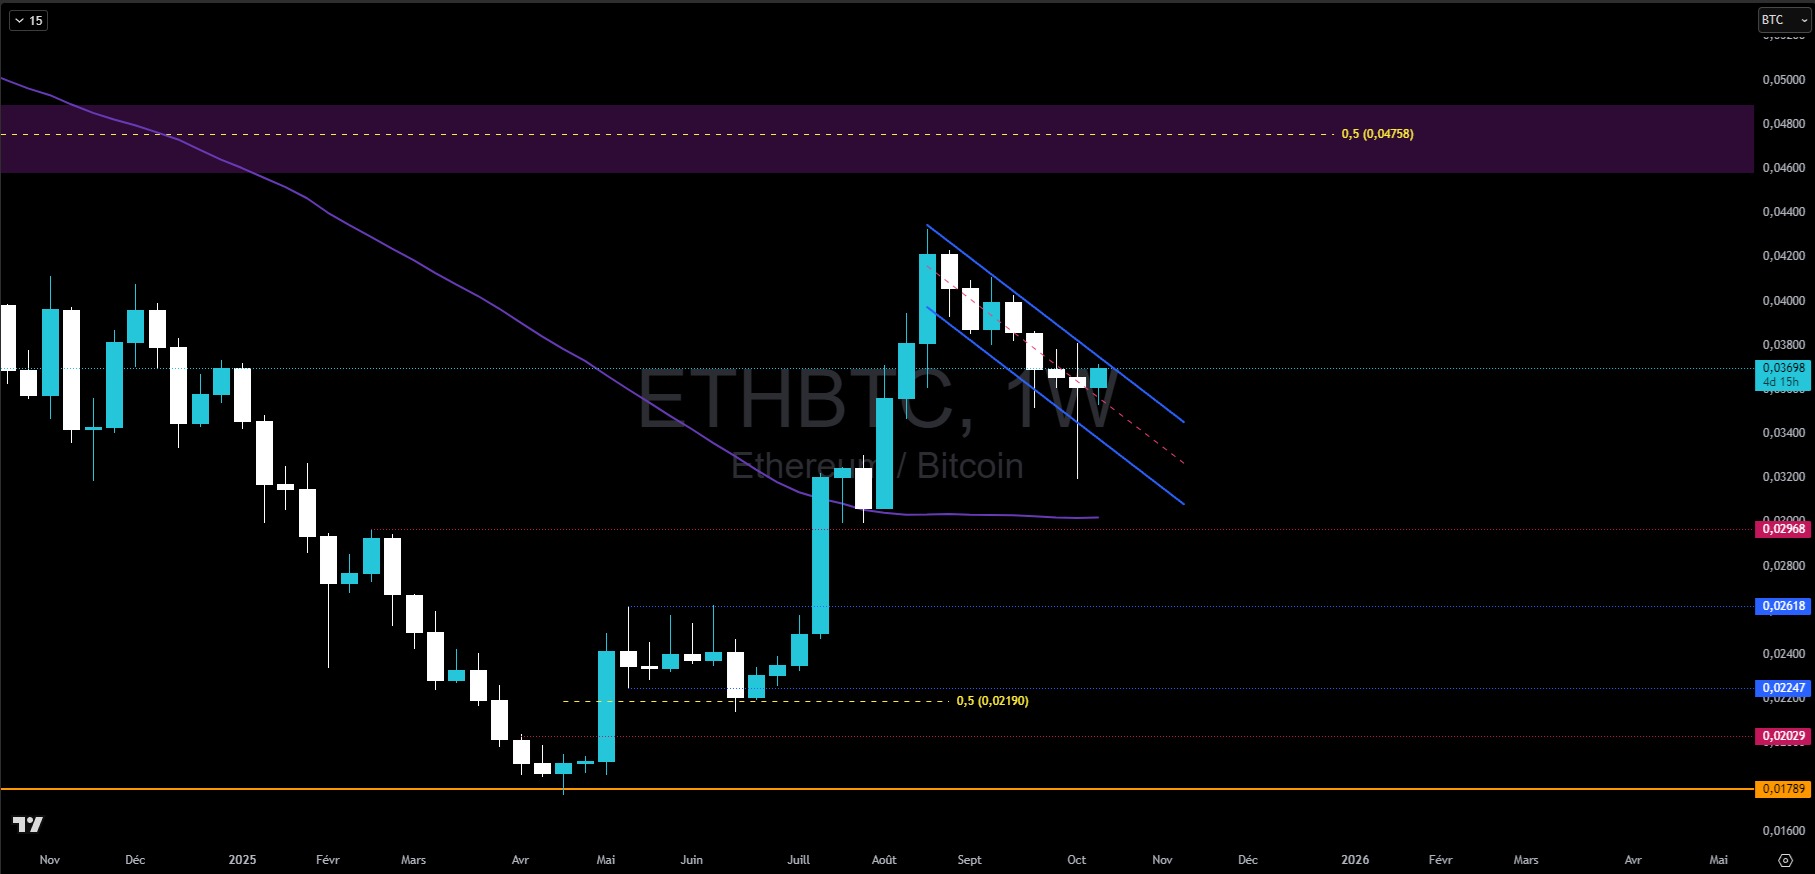
The issue of Ethereum outperforming Bitcoin is a recurring dilemma in the crypto market. This is particularly true at the end of 2025, which, from a calendar perspective, could mark the end of the bullish cycle if we consider the repetition of previous cycles. The trend for the ETHBTC pair, which measures the relative strength of the two largest market capitalizations, has been bullish on a weekly basis since last July’s breakout.
Currently anchored in a bearish flag consolidation, it is worth watching for a breakout from this pattern for a new bullish phase that could take Ethereum to the multi-year pivot point shown by the purple zone on the chart below.
Last week’s low could mark a new weekly low, which could allow the formation of strong support, reinforced by the confluence of the 50-day moving average, which is now flat.
The bullish breakout level that confirmed the new uptrend (at 0.03) could also play a role. If ETH/BTC were to settle back below this zone, a new phase of underperformance would be likely for ETH.
Unsurprisingly, Ether firmly holds its second place in the cryptocurrency rankings, with a market capitalization of $496 billion. However, it is currently undergoing a period of consolidation, both against BTC and the dollar.
Deviation then reintegration into the range, and now what?
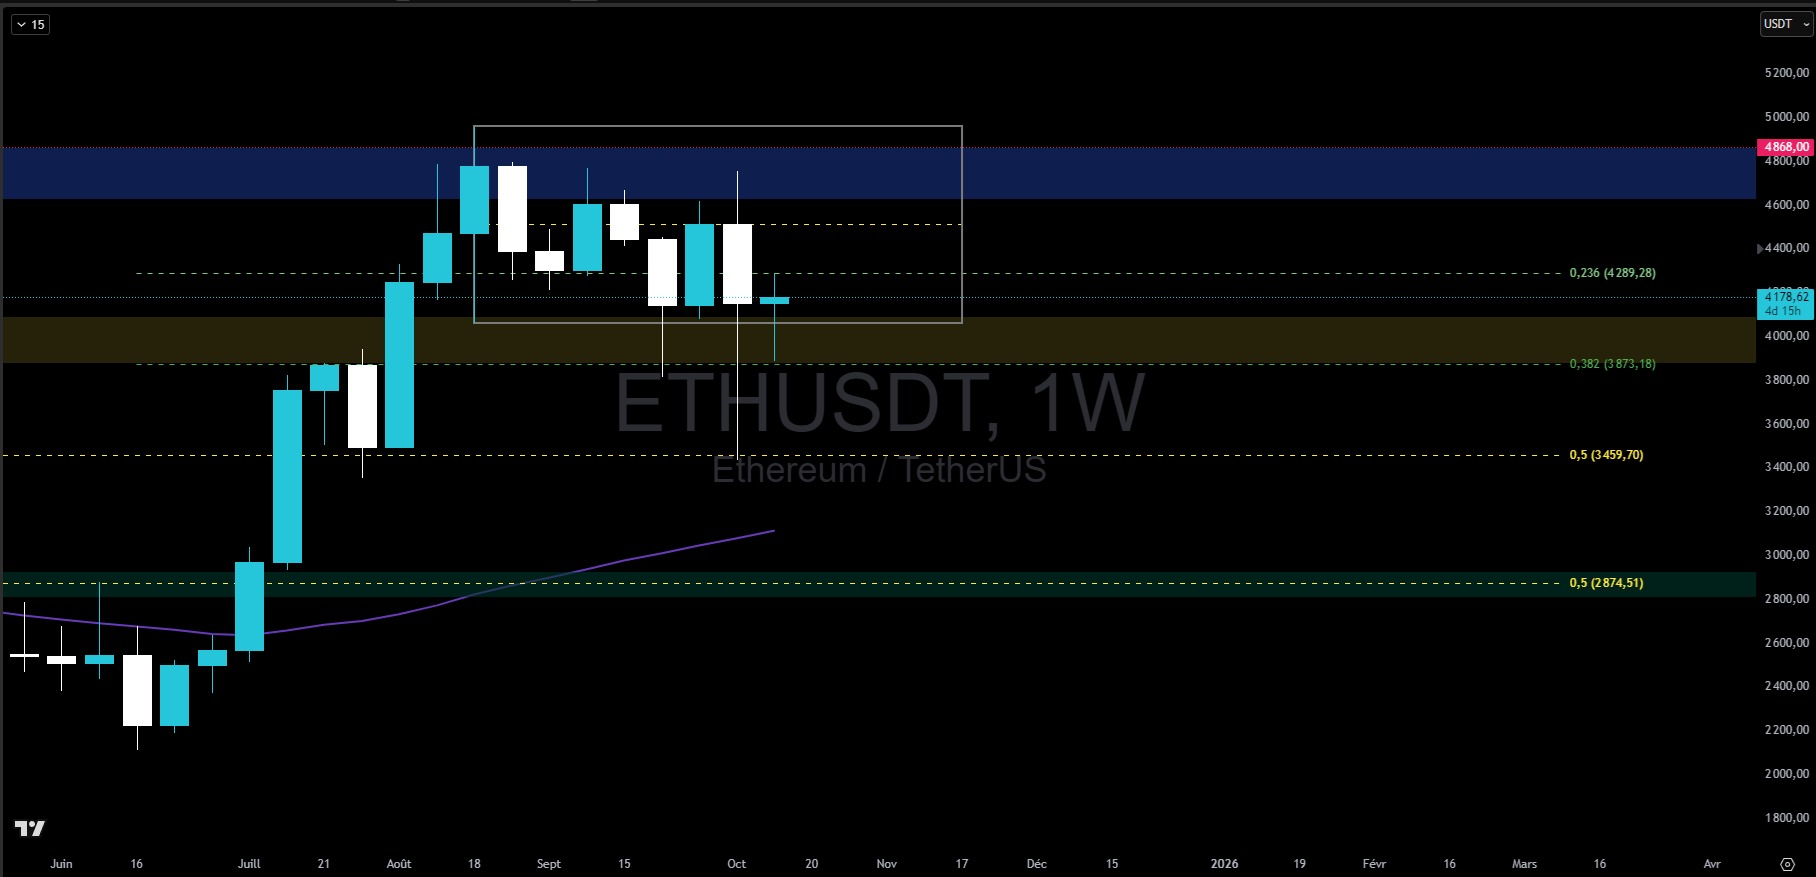
Ethereum, like Bitcoin, seems to be stuck in a range between $4,000 and $4,900, an area it deviated from three times before reintegrating. Last Friday’s liquidation event, although exceptional, could be the ultimate low point, the Wyckoff spring that could take us much higher.
Yes, the chart is ambivalent, suggesting a new downtrend if we take into account the price action and Friday’s bearish wick.
However, the range is also an important criterion in a context where the cascade of liquidations and defaults encountered on Friday could distort the chart’s representation of crowd psychology, which this visual aid is supposed to embody.
Consequently, I believe it is more objective to consider a bullish bias, driven by a market purged of excessive leverage, than a new close above 4,060 (last August’s low), which should be confirmed on Sunday evening.
It now seems unlikely that a new wave of liquidity will develop on a weekly basis. Ethereum must seek to regain $4,500 in order to target $4,900 and above.
If it fails to demonstrate this strength, if it closes below $4,000 on a weekly basis or if it falls below $4,820, we will have to consider the end of the bullish rally for ETH.
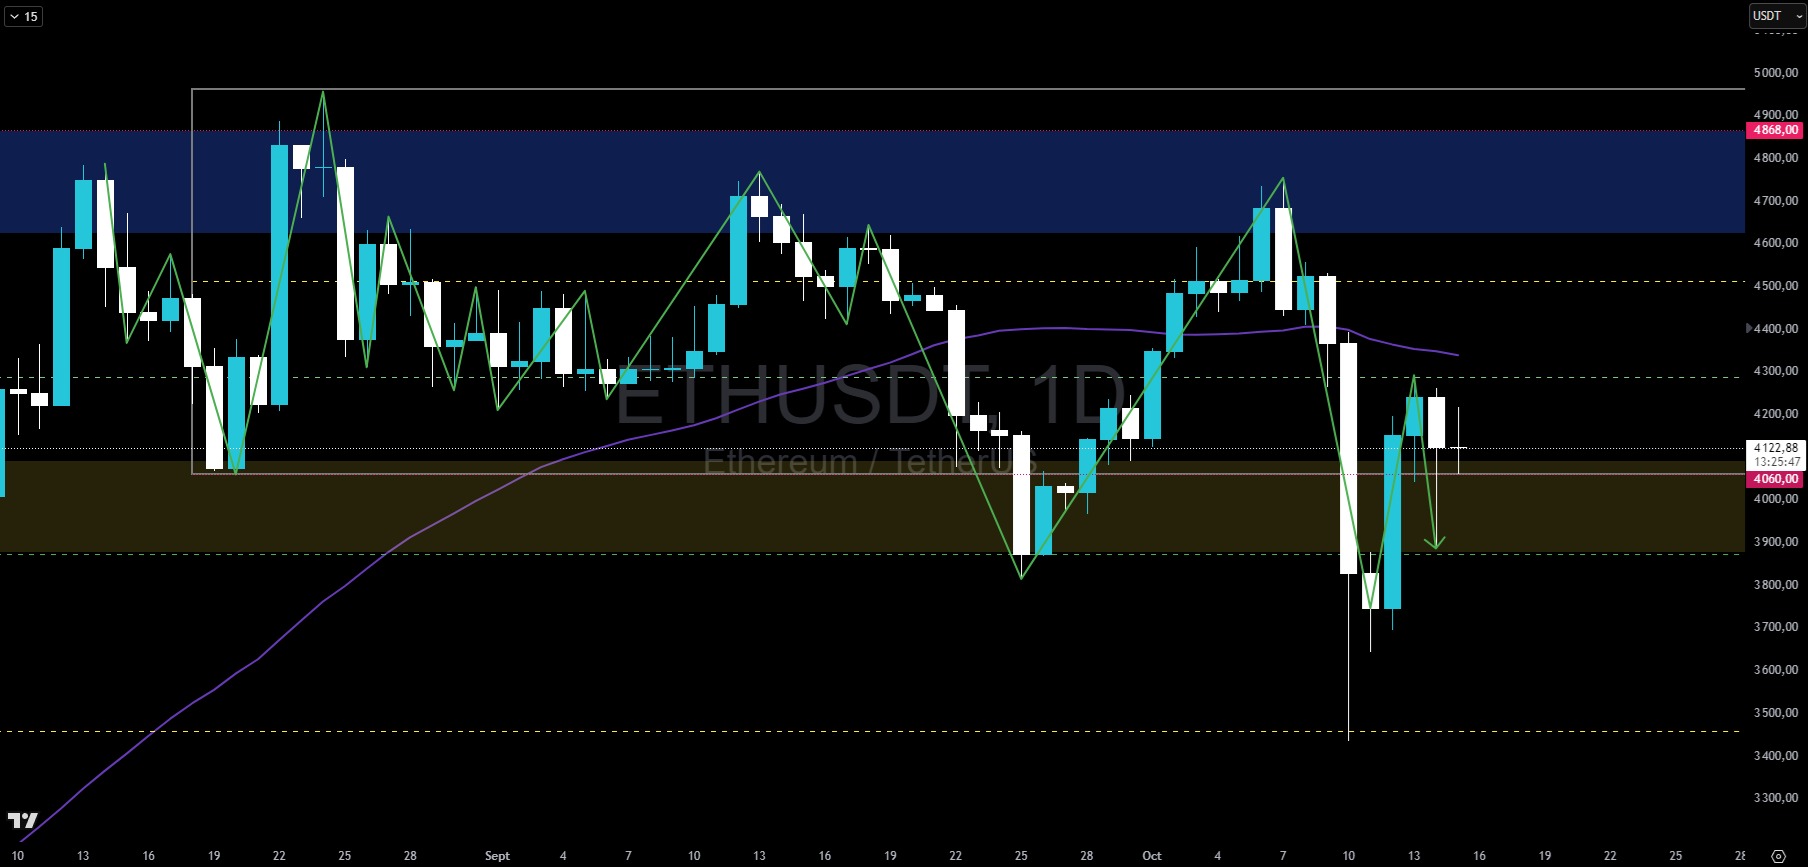
In shorter time frames, Ether is seeking to develop a bullish reversal, forming a daily low yesterday that could be at $3,888, higher than the previous one, thus marking the beginning of a new rise that the asset will confirm when it crosses $4,300.
Today’s candlestick could be crucial, as the price will need to remain above yesterday’s lows to confirm the new reference low, which coincides with the 0.382 retracement of the entire last weekly bullish phase, thus reinforcing the idea of a reversal in the zone.
However, the 50-period moving average, in 4 hours, is currently blocking prices in a downward sloping trend. In addition to the levels we have already mentioned, Ether must show its ability to break through this dynamic resistance to allow the price to breathe.
In summary, after returning to its range, Ether could initiate an upward movement beyond $4,500, with the aim of returning to its historic highs. However, it will need to show positive momentum in the short term, confirming the breakout of key technical levels, which is a necessary condition for reviving price growth.
So, do you think ETH can once again outperform the crypto market? Feel free to share your thoughts in the comments.
Have a great day, and see you next week for a new technical analysis of Ethereum.