
Bitcoin (BTC) and Ether (ETH) prices continued their rebound last week. However, resistance was well rejected. Will the market continue to fall or is this just a temporary correction?
Bitcoin (BTC) Technical Analysis
Let’s start with the Bitcoin (BTC) price analysis. Last week we talked about the possibility of a short-term bullish recovery. This movement developed perfectly last week.
Where do we stand on our analysis?
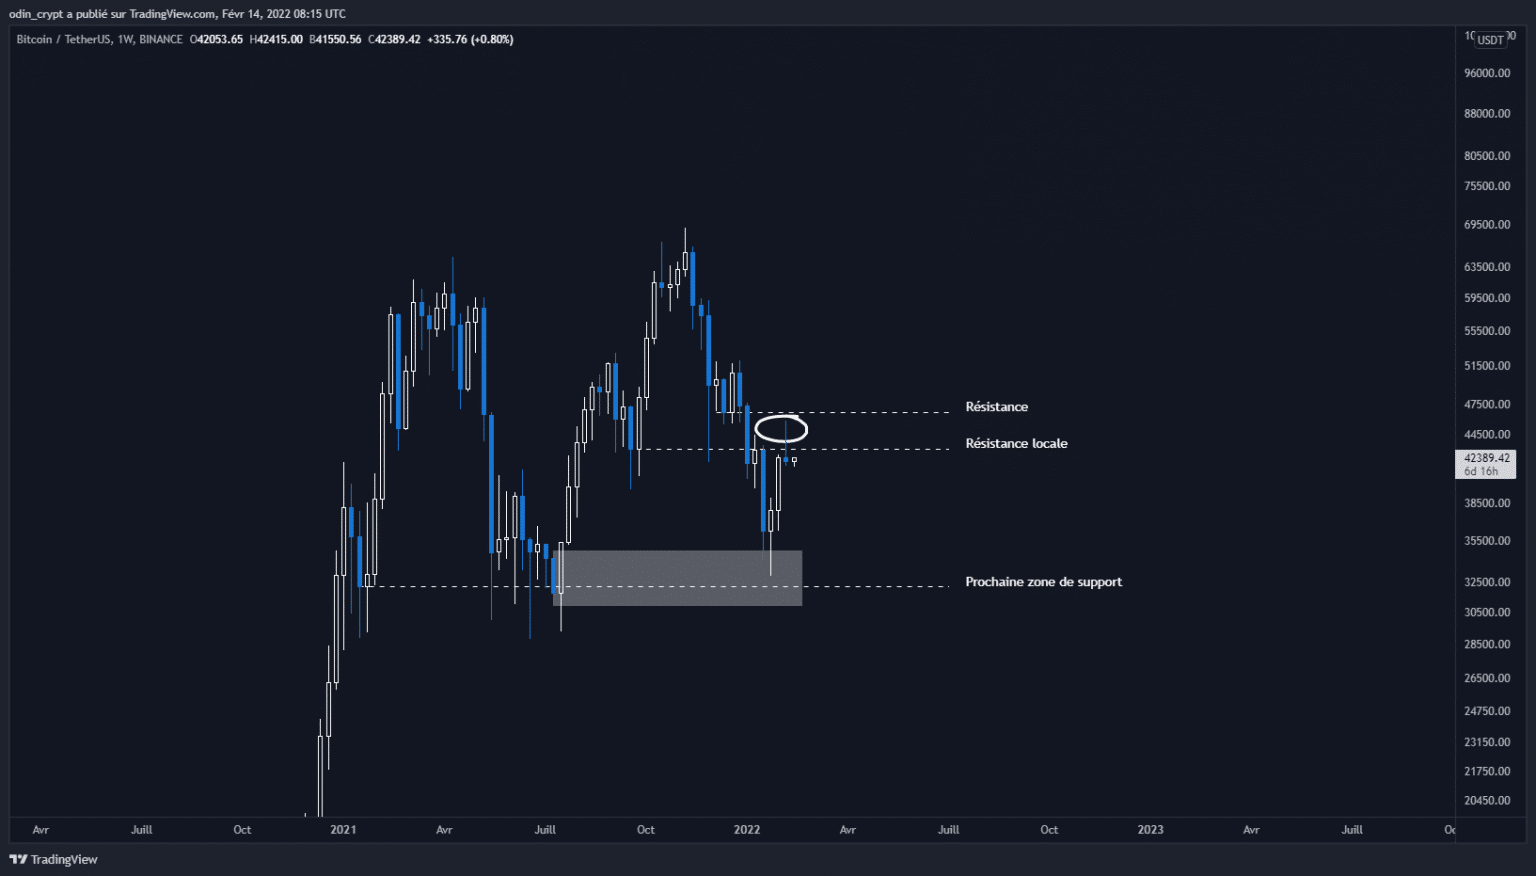
The weekly view will give us an overall view of the situation. Indeed, the week closed last night below the local resistance level at $43,100. There is a wick to the larger resistance point at $46,000. The structure is still bearish in the short term, as we have been rejected locally.
The next support on this time unit remains at $32,200. The presence of an order block (block that gathers losing orders from large portfolios) in this area makes it an area of buying interest.
Bitcoin (BTC) analysis in 1W
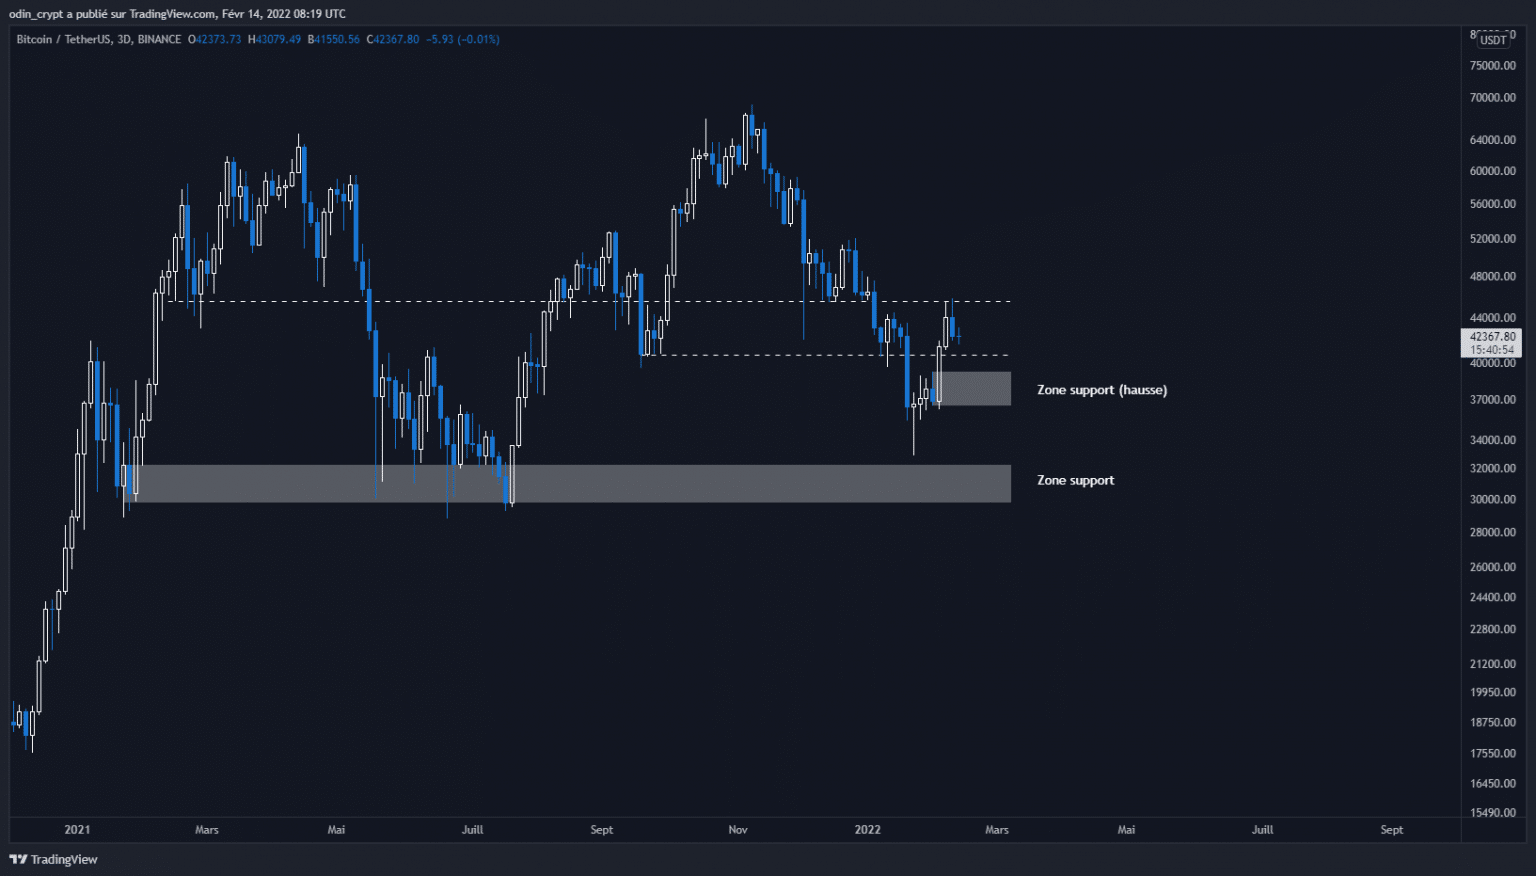
The 3-day unit grouping will give us more information on the internal structure of the macro movement. The same resistances are observable, with a clear rejection of the movement. We can observe that BTC has not yet resumed a bullish trend on this time unit as well.
If we are looking to be bullish, our purchases will be in the area of $39,000 – $36,200 which again corresponds to a not yet revisited order block area. Macro support is still valid on this view.
Bitcoin (BTC) 3D analysis
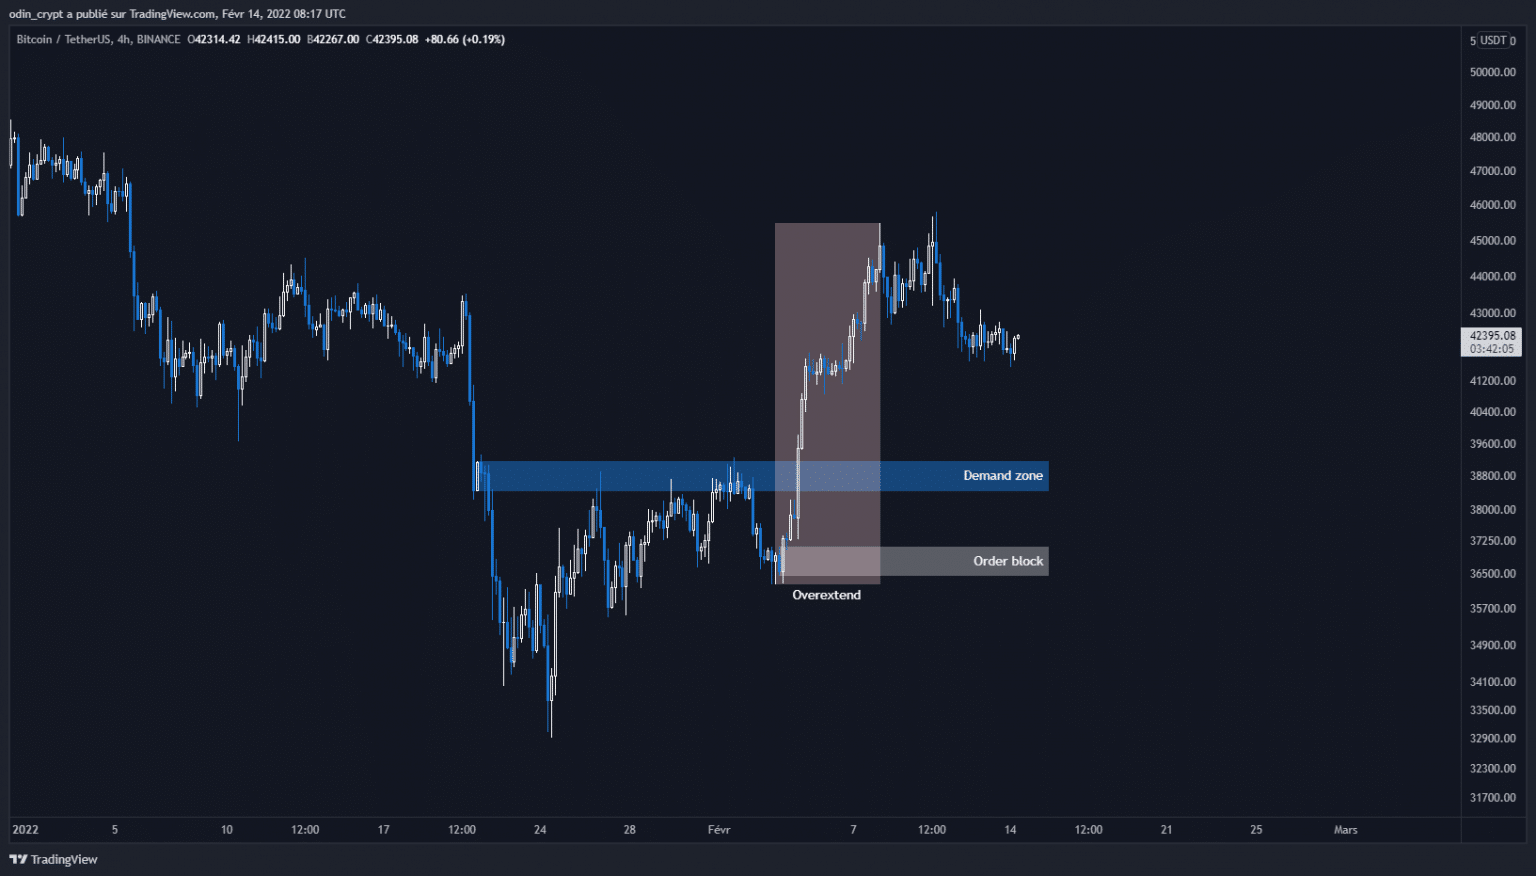
The 4h view will be more interesting in this analysis. Here is what I observe:
- The structure is bullish on this time unit;
- A demand zone has just been created on the $39,000 – $38,000. It corresponds to the former sell zone that held the price 3 times;
- A new order block zone has been created at $37,000 – $36,500 and has not been revisited;
- BTC has made a very large move up and is in an overextended situation. It will naturally have to retrace its movement.
On this basis it will be interesting to establish short term buying plans, to take advantage of a technical rebound in the most classic case, and a real bullish reversal on macro time units.
Bitcoin (BTC) analysis in 4H
Ether (ETH) technical analysis
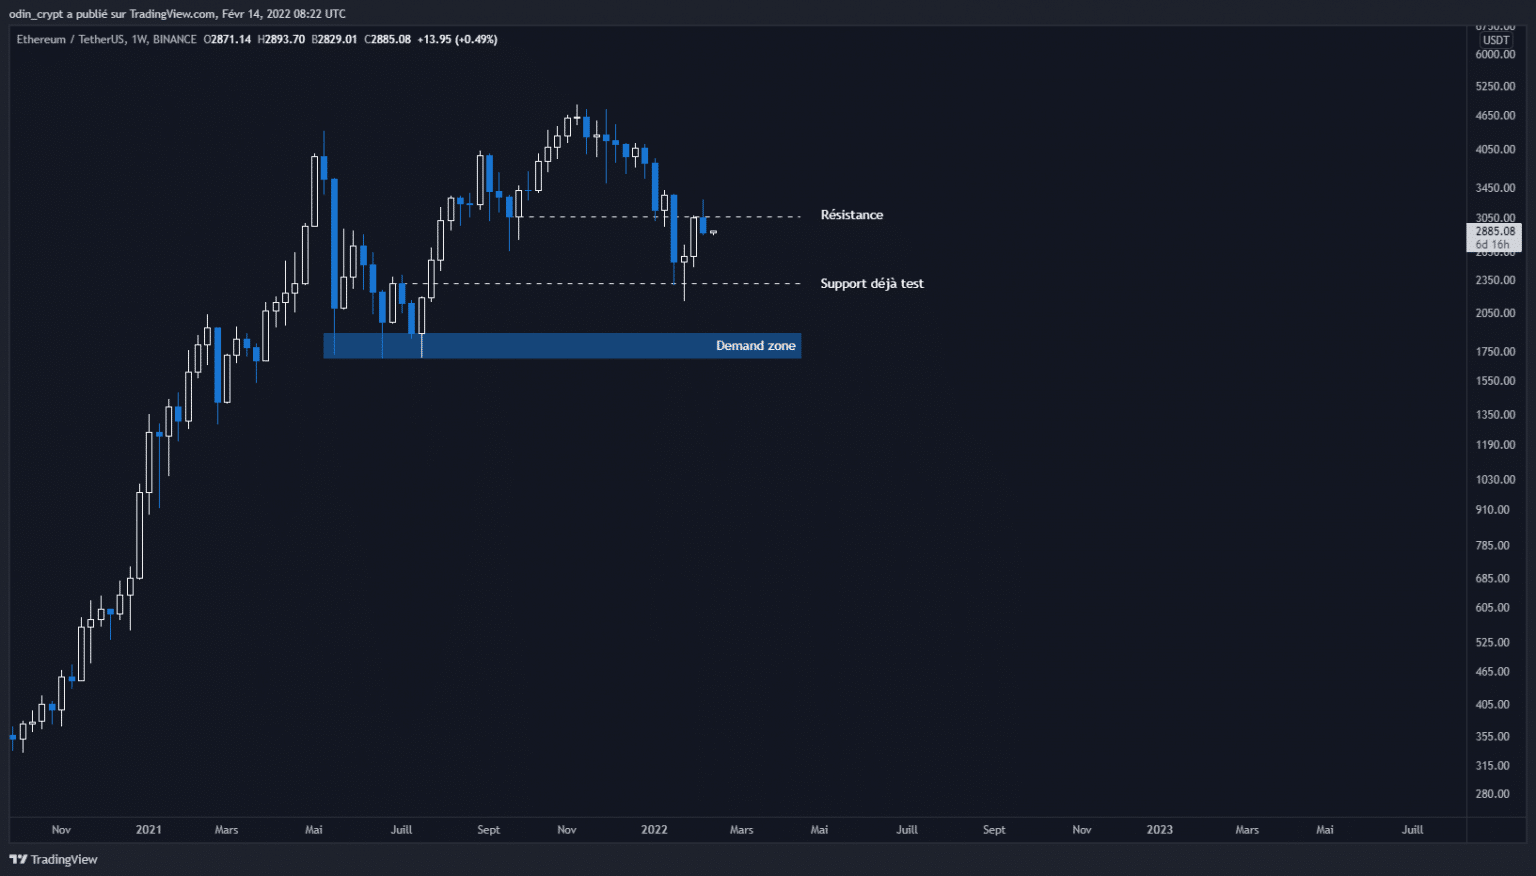
Let’s move on to the Ether (ETH) price. As usual, it follows the example of its elder brother with a more readable structure.
On the weekly view, Ether validates its bearish retest with a clear rejection on the $3,000 resistance. The $2,300 support has already been tested and the next point will be at $1,900 – $1,700. The structure remains bearish at the moment, and a reversal is not yet validated.
Ether (ETH) analysis in 1W
Let’s now focus on the 3 day view to refine this analysis. Again, this macro rejection can be seen perfectly in this view. I also see a demand zone forming on the $2700 – 2300 area which could serve as a support point for a bullish reversal. However, the order block area at $1,900 – $1,700 remains the most likely retracement area at present.
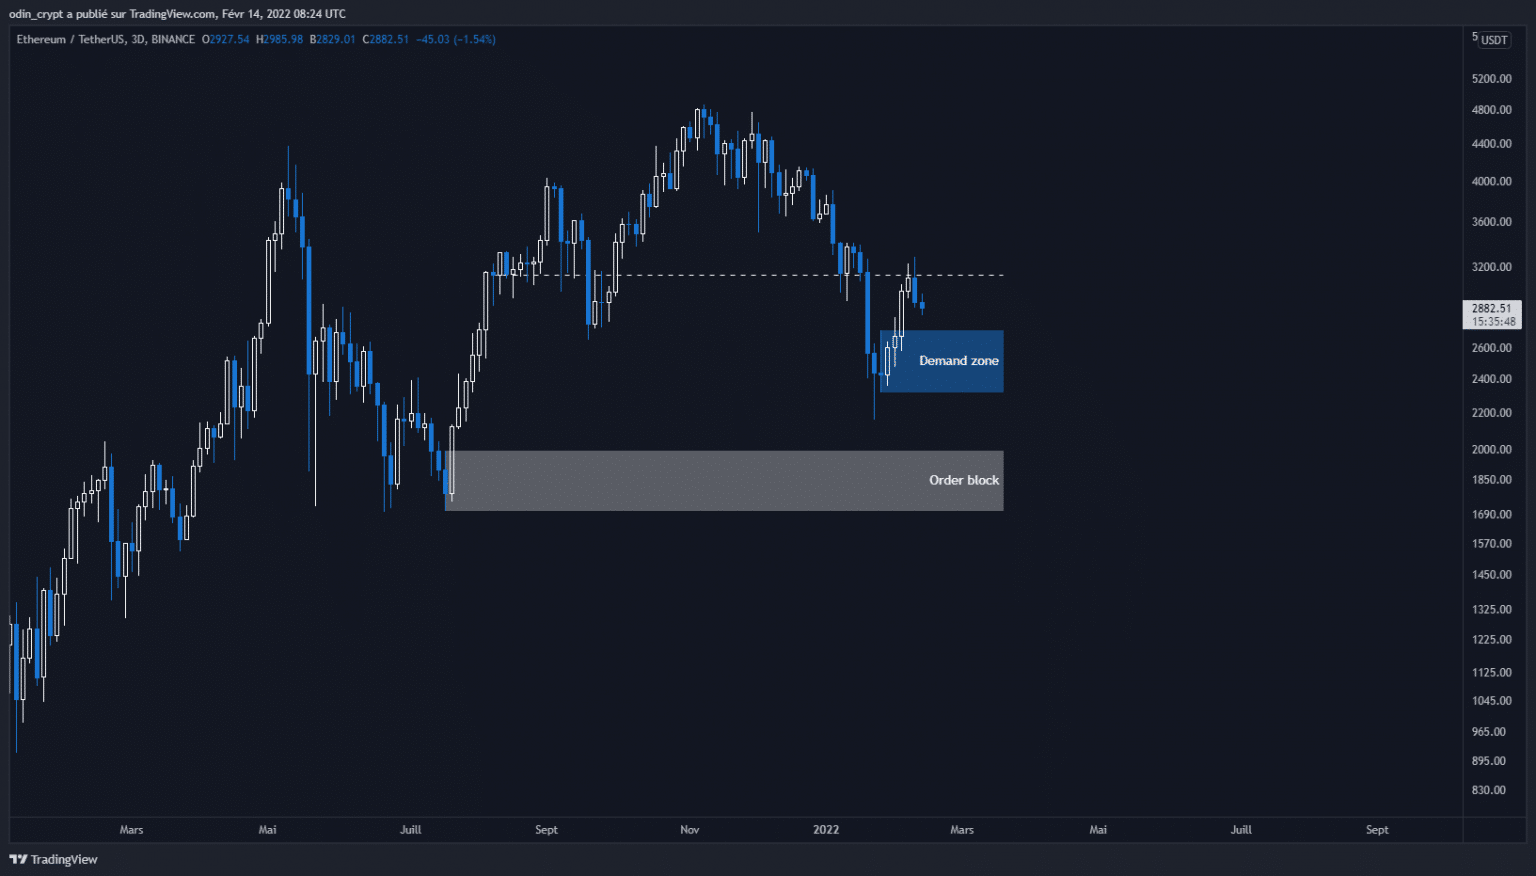
Ether (ETH) 3D analysis
As with Bitcoin (BTC), the 4 hour view will give us some very interesting short term indications. An order block has formed on the $2,590 – $2,650, in an uptrend dynamic on this time unit. This could allow for a technical rebound to support this new momentum.
This offers short-term opportunities, allowing for a shorter time to market exposure for those with a lower risk appetite.
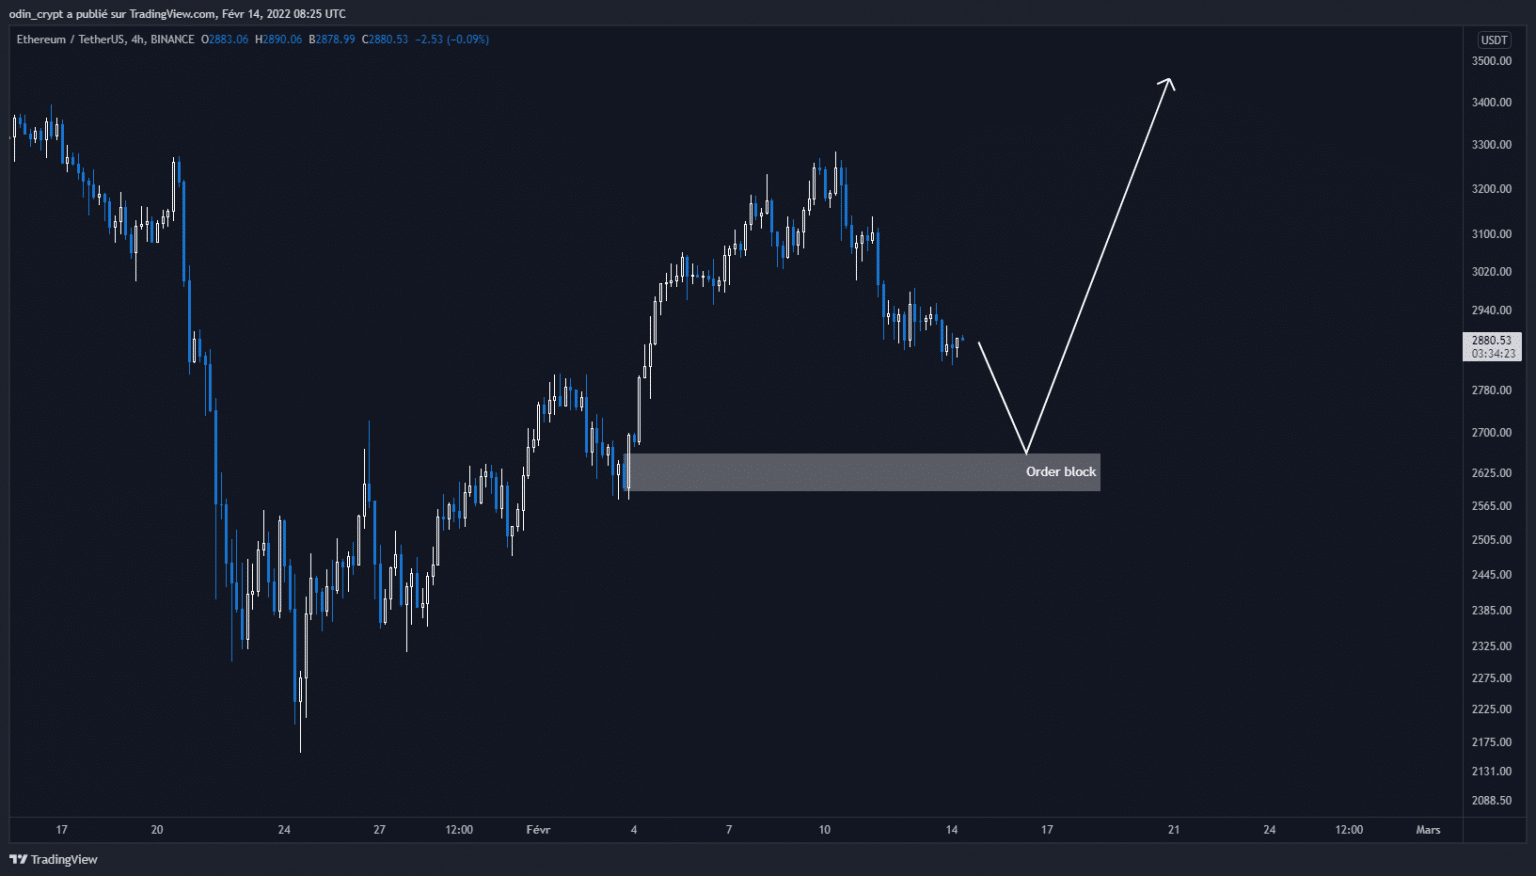
Ether (ETH) analysis in 4H
Cardano Technical Analysis (CTA)
This week I have chosen to analyze the price of Cardano (ADA). This cryptocurrency is currently in 7th position in terms of capitalization, and benefits from a large fan base. So what about the macro view for this crypto-currency?
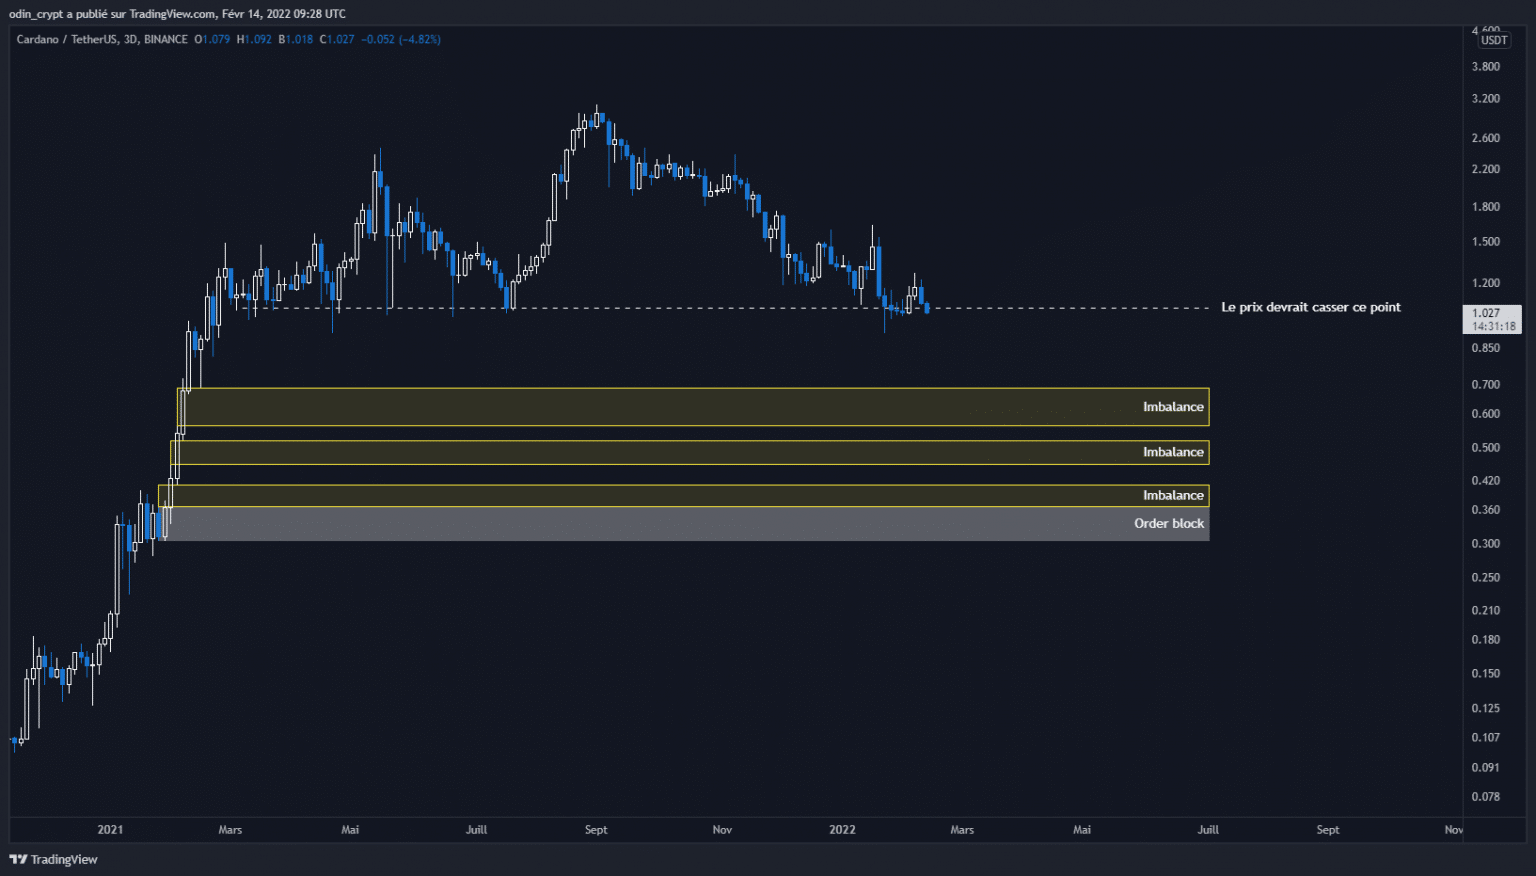
On the 3-day view, we can see a big price distribution phase after an impressive expansion phase (+4000%). ADA is currently on its support zone which has been tested more than 8 times now.
I expect to see this support broken to the downside in the next few days, which will accelerate the price of ADA downwards. If you look at my chart, you will see 3 yellow rectangles with the word “Imbalance”.
These rectangles highlight a phenomenon that can be likened to “liquidity holes” that were generated during this major growth. The white rectangle corresponds to an order block left by large portfolios. The ADA generally retraces its movement in these areas to fill the gaps left by the imbalance and to close the losing positions in the order block. All indications are that ADA will retrace to the low in the $0.3 – $0.6 area.
This will allow us to buy with the primary objective of retesting this lost area at $1 for a return of 186%.
To be continued!
Cardano Analysis (ADA) in 3D
Conclusion
Bitcoin and Ether have rebounded as announced last week. The prices have been rejected on the resistance points we mentioned, and they remain in bearish trends on the large time units (mainly daily).
Areas of buying interest have not yet been revisited, and this would result in a final bearish wave. However, on the 4h time units, we are seeing a local uptrend, which requires a bearish retracement in order for the move to regain momentum. There will therefore be positions to take on the areas identified in this article.
On the Cardano ADA side, the price is currently in a very clear bearish pattern. I expect a loss of major support, which will lead to an acceleration of the downward movement. Unreviewed areas near $0.3 are present, and would allow for a buy position. In the meantime, we will have to be patient in order to position ourselves correctly.