
Bitcoin (BTC) and Ether (ETH) prices are back on their support zones, but seem to be getting less and less volatile. The cryptocurrency market seems to be preparing for its next big move, but when might it actually happen?
Technical analysis of Bitcoin (BTC)
Last week, the price of Bitcoin (BTC) was in the $39,000 range. Today, the price is exactly where it was. The volatility of the movements is crashing as the days go by, and the price is failing to extract itself from either side.
How to approach this range phase
Let’s go back to the weekly view. Bitcoin is still moving between the two boundaries we identified last week. This area is between $34,000 and $45,000. The price is lateralizing in this area, and assaults in either direction don’t seem to work.
As with any phase of lateralization, we notice that the price tends to reduce its volatility as it goes along. Very generally, the movement that follows a lateralization phase is explosive, it remains to be seen which way the exit will go.
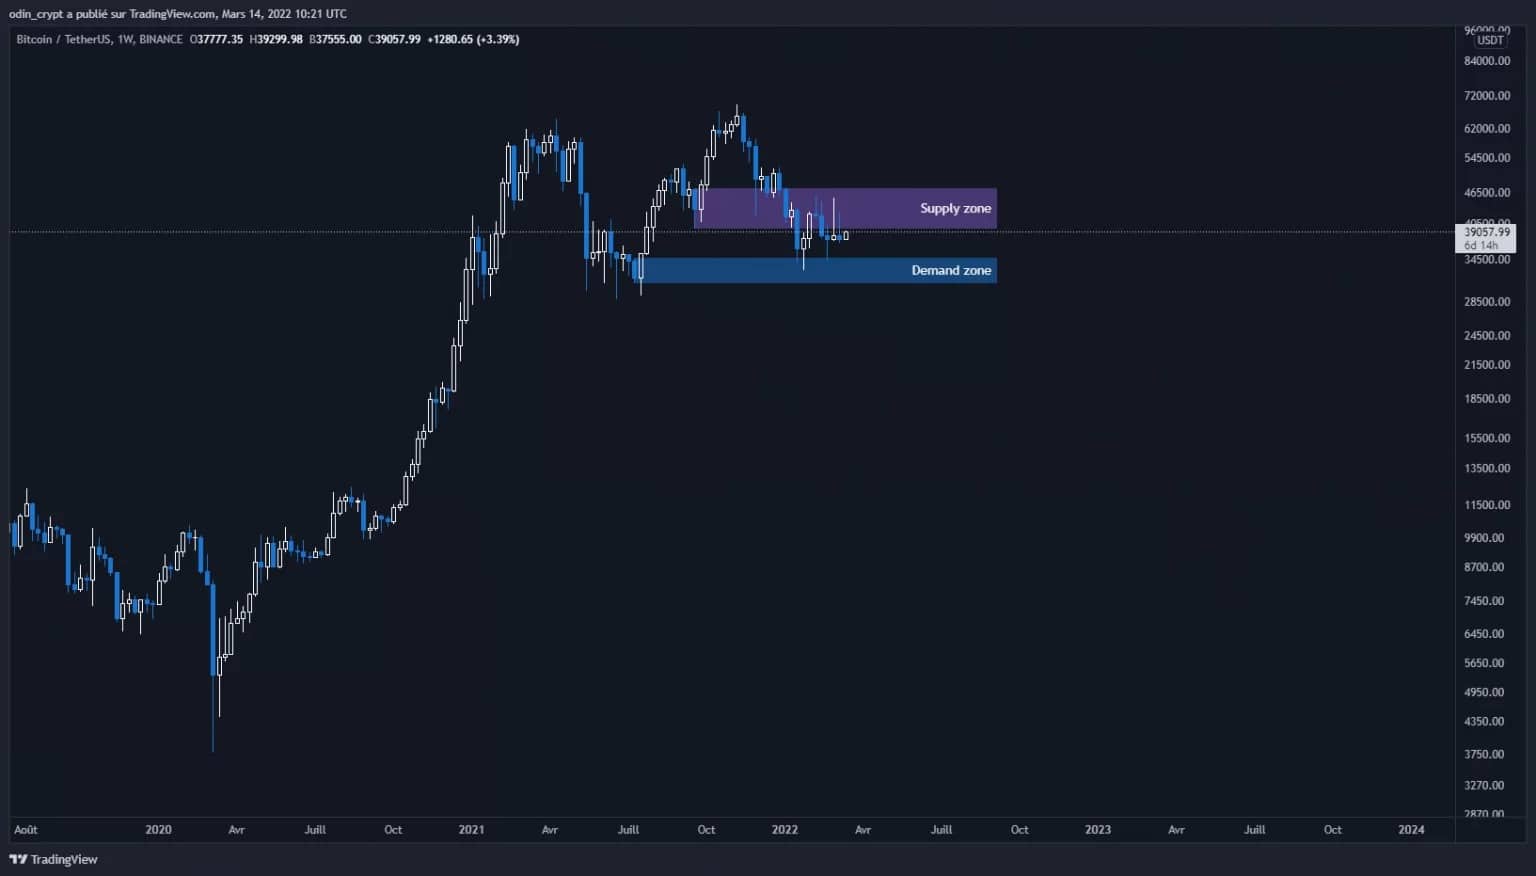
Bitcoin (BTC) analysis in 1W
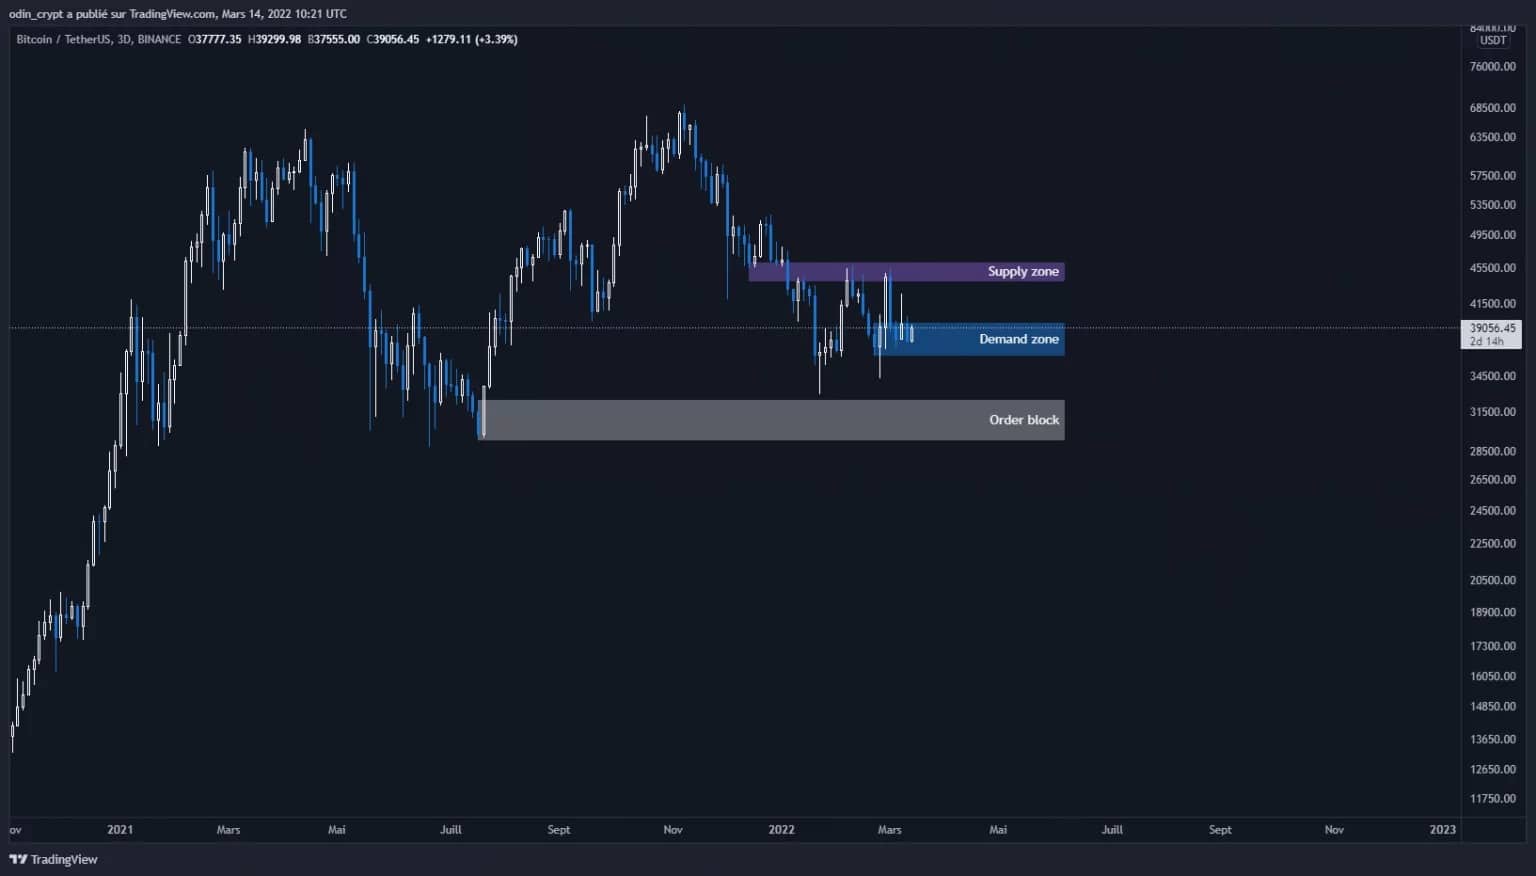
Let’s now focus on the 3 day consolidation to clarify our observations. The price is back in its demand zone ($36,400 – $39,500) and seems to be stabilizing for the moment. In case of a break of this zone, it is a new test of the order block zone that is looming at $29,200 – $32,300.
On the upside, it is indeed the $44,000 – $46,000 that will have to be taken back in order to reverse the trend and make a bullish move to $51,000.

Bitcoin (BTC) 3D analysis
On the 4h view, the uncertainty of the situation is clearly felt. Indeed, the price is back on its demand zone as we observed in the daily view. However, I expect a further upward movement to $45,000, with the hope of a bullish passage from this point.
For now, the situation remains neutral, and for this reason the price does not seem to give us a clear indication.
Bitcoin (BTC) analysis in 4H
Ether (ETH) technical analysis
On the Ether (ETH) price side, the pattern remains the same. On the daily unit (3 days), the price is also in a lateralisation phase between $2600 – 3100. The demand zone at $2,300 – $2,500 is still acting as a buying zone, and the price has made several rebounds. On the other hand, the supply zone at $3,100 – $3,400 has rejected the price twice.
In this classic range configuration, the most likely outcome is a final manipulation phase before taking the exit direction. At the moment we cannot clearly state the objective of the exit, but we can understand the development in smaller time units.
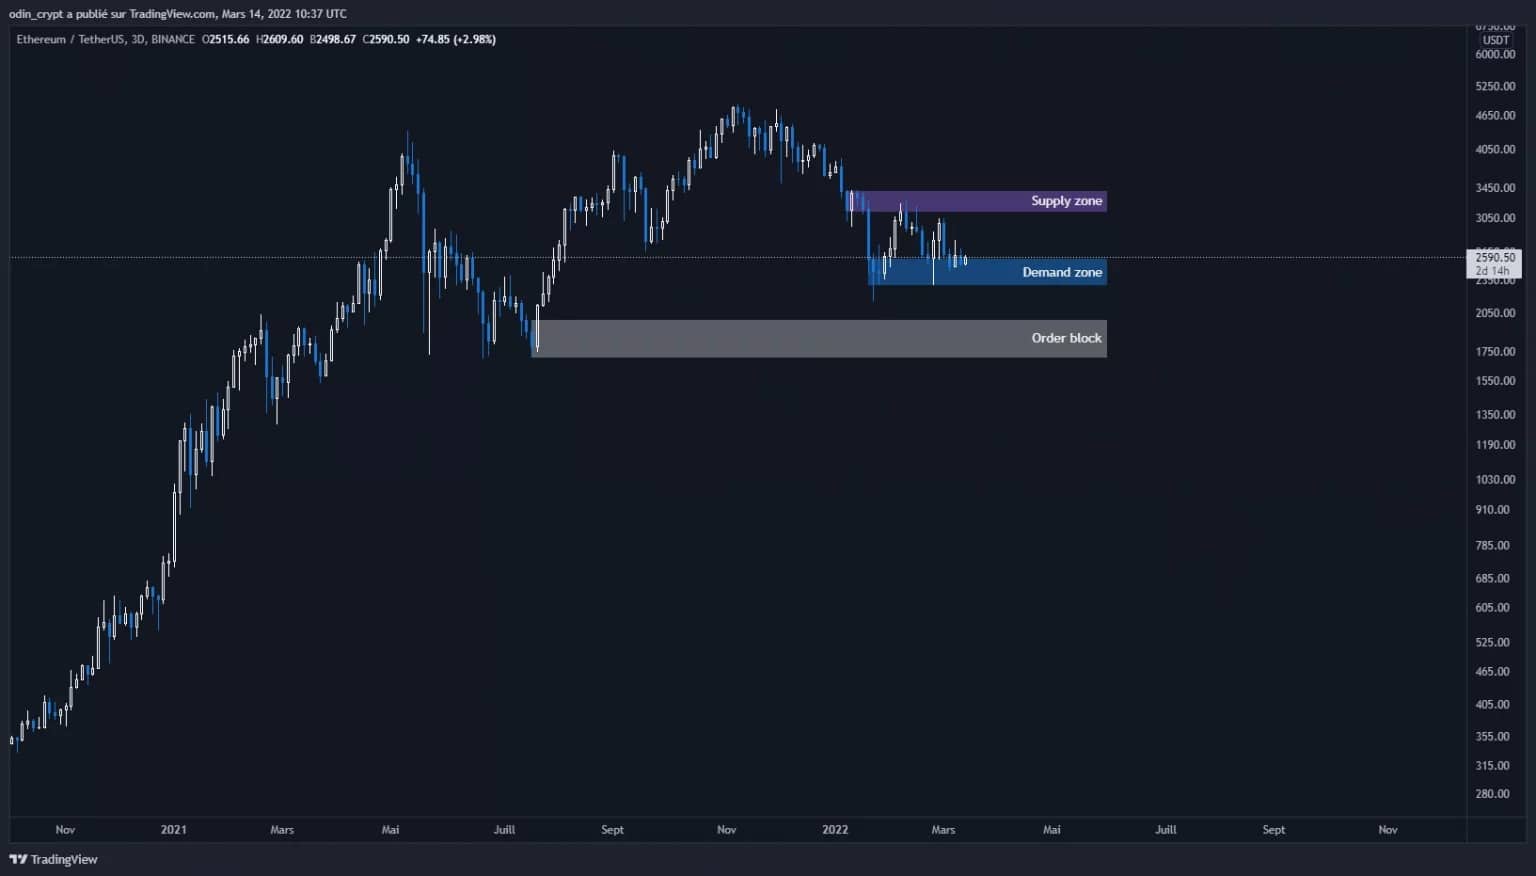
Ether Analysis (ETH) in 3D
The 4h view will allow us to refine this analysis. On the one hand, we see a structure where the highs are getting lower and lower, characteristic of a bearish trend. But on the other hand, we see higher and higher lows characteristic of a bullish trend. The reality behind this phenomenon is a phase of price compression.
Volatility is decreasing, and as we can see on Bitcoin, an explosive move is coming.
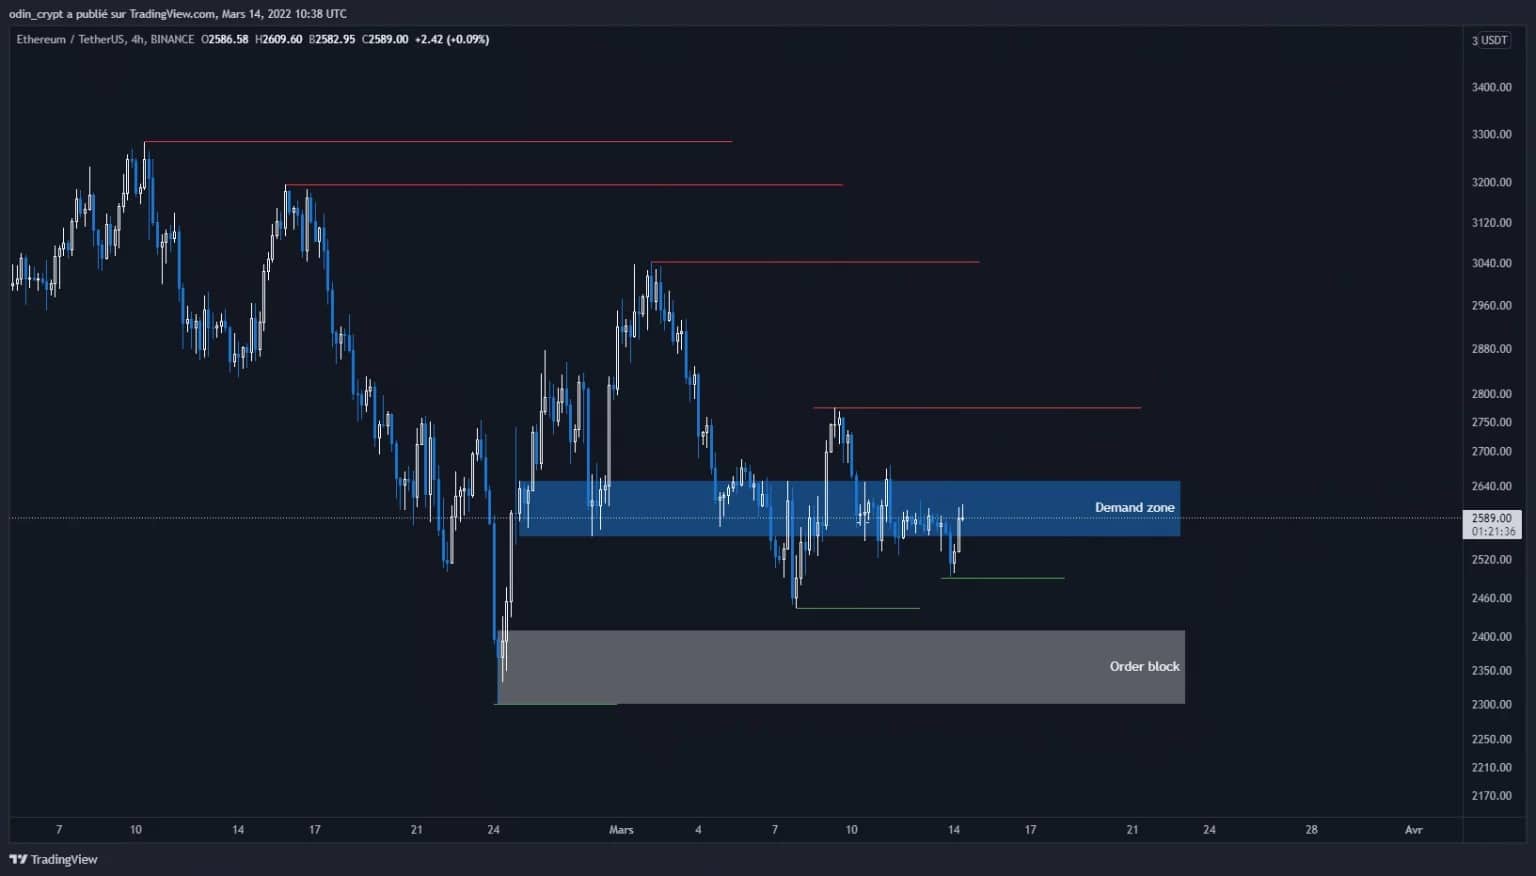
Ether (ETH) analysis in 4H
Technical analysis of Aleph.im (ALEPH)
Today for this article I propose you an analysis of the token of the Aleph.im project (ALEPH). It is part of the projects that I find fundamentally interesting, and that I regularly monitor to increase my share of investment in it.
So I offer you my technical view on this crypto-currency.
The weekly view is quite interesting to define relevant buying zones. Given the information we have, we can say that the macro of this asset is bullish. Indeed, the price is printing higher highs and lows than the previous ones.
This is a very good sign and it guides our strategies to define a buying zone. In this trend, the price will have to correct to generate liquidity before resuming the upward path.
To do this, we can define a very relevant zone between $0.12 – $0.17. I am convinced that the ALEPH price will revisit this area before entering a re-accumulation phase. On this assumption, we will therefore look for a potential exit zone. I will personally target the $1.5 area as a theoretical target.
This will bring the total capitalisation of the project to 290 million, placing it in 157th place, just behind Digibyte (DGB).
Once the target is reached, I would monitor the price movements in order to exit on a breakout of the market structure in daily view. And I will look again for an entry for a new high afterwards.
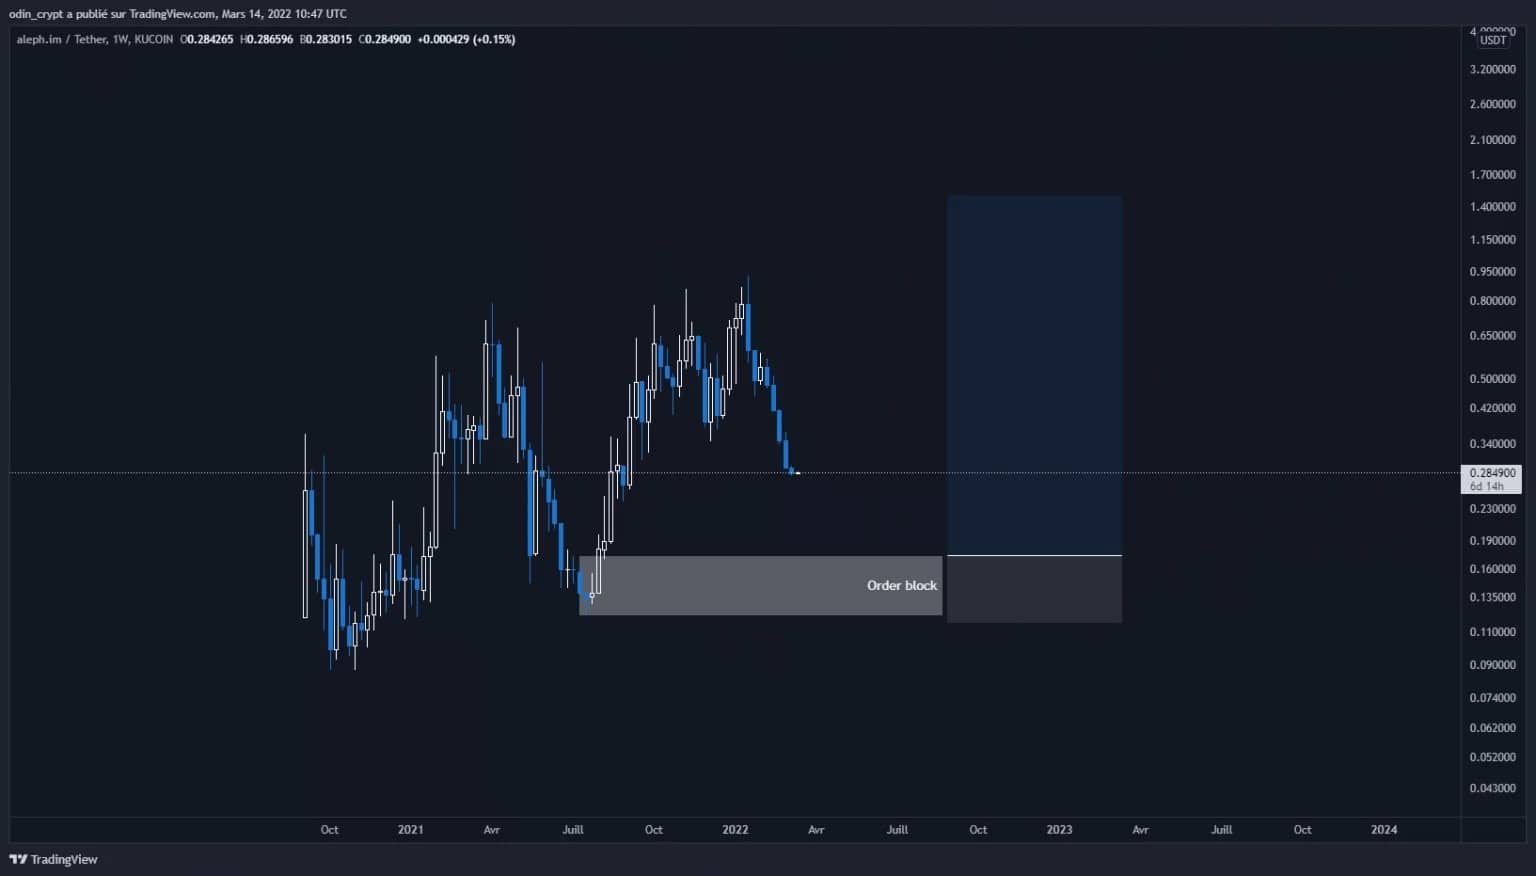
Analysis of Aleph.im (ALEPH) in 1W
Conclusion
The price of Bitcoin and Ether remains perfectly neutral. At the moment, the prices are on demand zones and these still seem to serve the price. On the other side, local resistances have also rejected the price on multiple occasions.
Volatility and amplitudes of price movements are increasingly reduced. This indicates a strong compression of the price, and we can expect very strong movements afterwards.
As for Aleph.im (ALEPH), the price has largely started its retracement of the upward movement, and good opportunities will be available. A buy on the $0.12 – $0.17 area seems to me to be a good action plan. The goal is to reach a new ATH on the next move.