
As we approach the end of the year, Bitcoin (BTC) and Ether (ETH) are showing signs of a potential reversal. Will prices finally start to rise again in the next few days
Bitcoin (BTC) continues its range on key support
Since last week, the Bitcoin (BTC) price is still in a range above its daily support (in green at $46,000 on the chart) and still fails to take a clear direction.
However, a big move is likely to take place again in the next few days, if not hours.
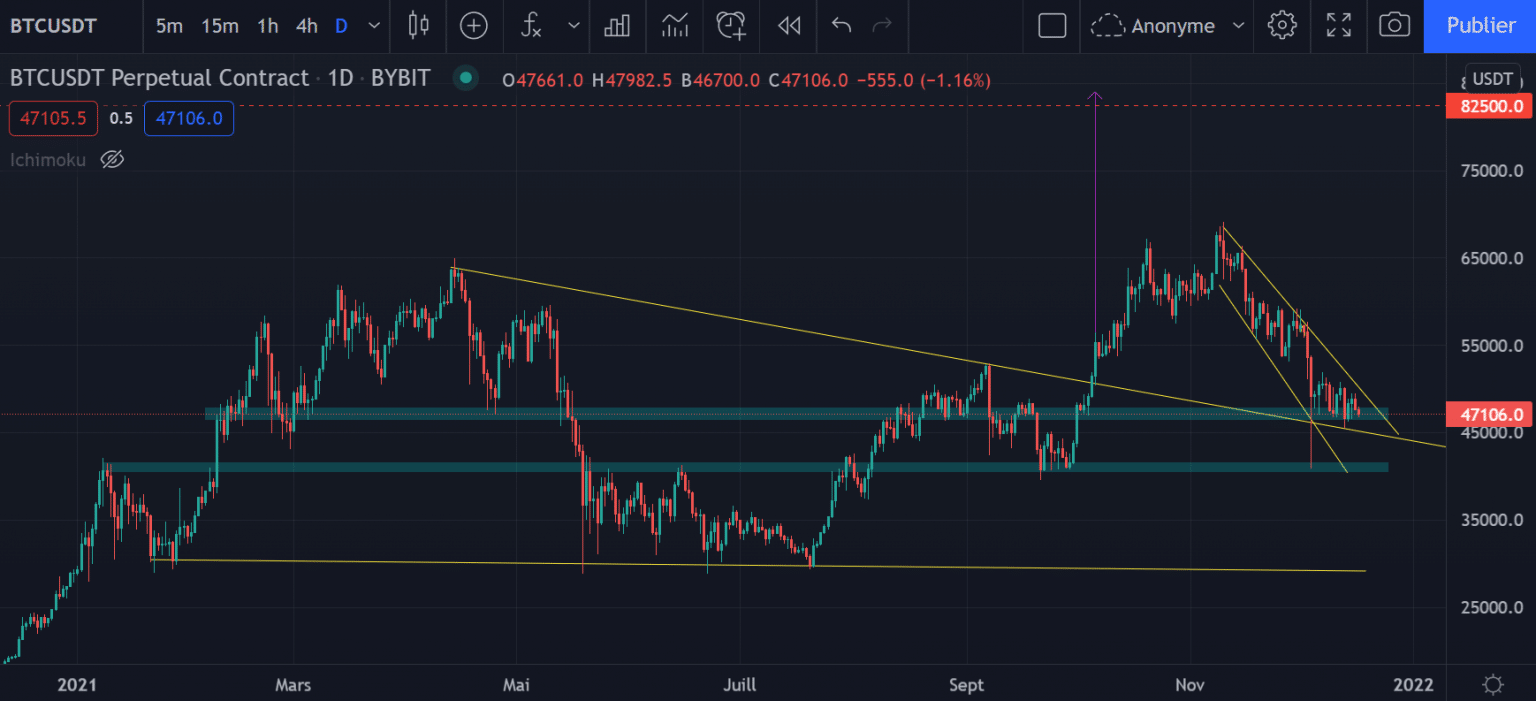
The Bitcoin Daily Chart
Although the $82,500 target is still active following the breakout of the multi-month daily compression triangle (yellow), we’ll have to watch out for the price to finally manage to bounce off the all-important support at $46,000. Indeed, as this level has been used repeatedly as support and then as resistance, it will have to be held again in the coming days.
A bullish rebound would confirm a full pullback to the top of the yellow pattern, before finally moving back towards the bullish target in the coming weeks.
As a reminder, if the $46,000 support were to give way, a return of the price to the next support at $41,000 would be considered.
Triangle breakout in the next few hours
On the 4h chart, we can observe for several days a price compression inside a continuation triangle.
If in general the break is more likely to be from the bottom (hence the name “continuation” according to the trend), it is still appropriate to wait for the price to break its support or resistance to determine the price target, the market being more indecisive than ever.
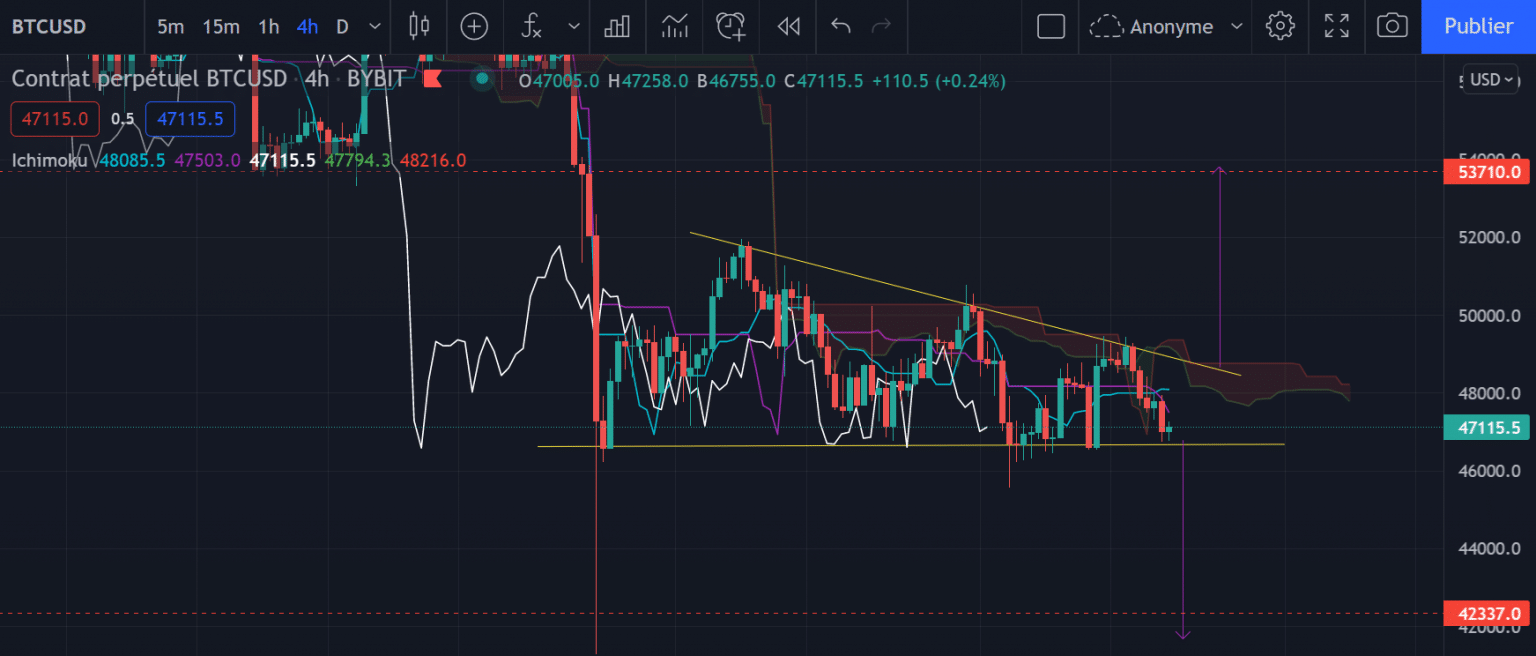
The H4 chart of Bitcoin
On a breakout from the top, price should surge towards the triangle breakout target around $53,700. This level also corresponds to the previous support level, which could well become the next resistance.
If the price breaks the triangle trendline from below, the target would be $42,300, just above the next daily support.
Either way, the compression in the triangle is coming to an end, so a big move should be coming in the next few hours.
Can Ether (ETH) go back up
In a bearish range also for several weeks, the price of Ether is now stabilizing around $ 3,800, a very important support area to keep.
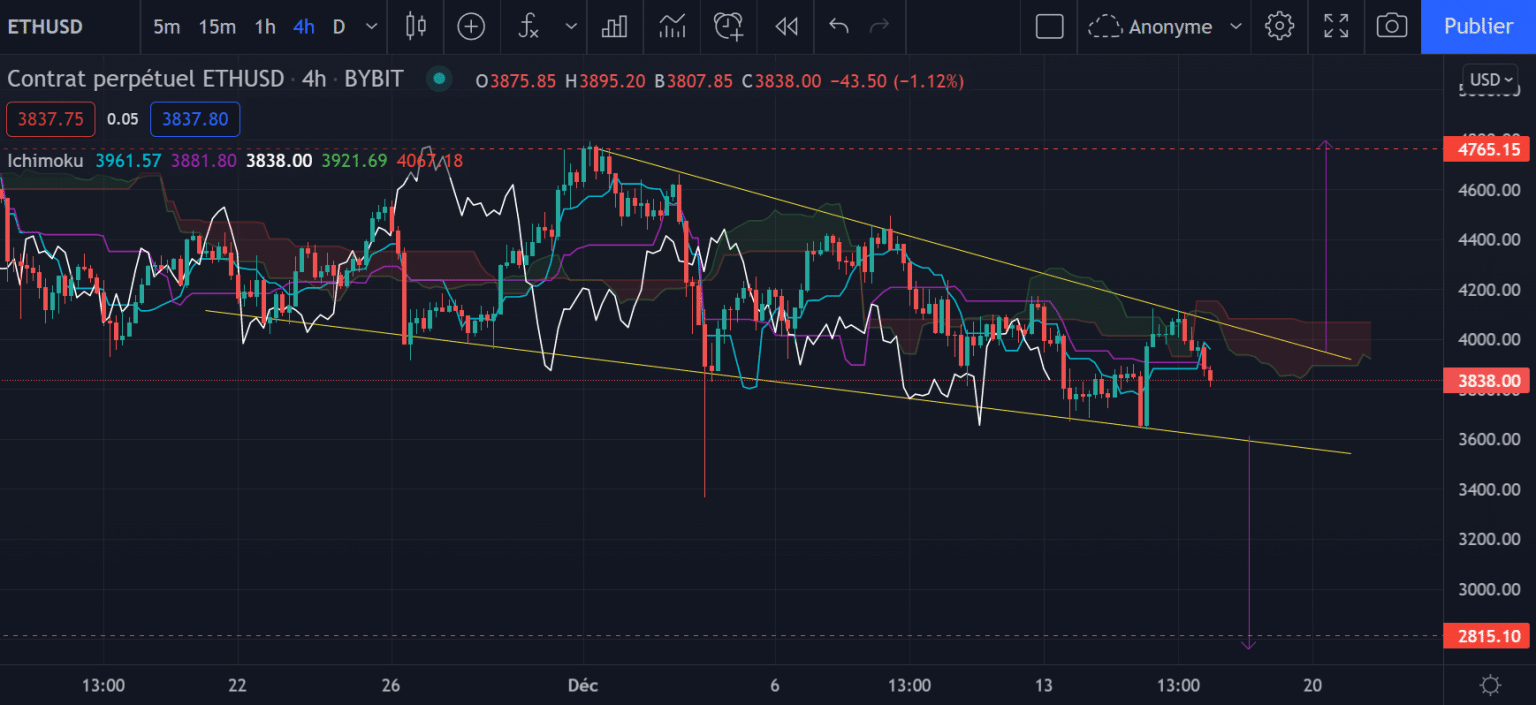
Ether (ETH) chart in H4
Indeed, last week we were looking at the very likely return of the price to this support level, following a rejection of the $4,000 price level. Now we can see that ETH is in a falling wedge and that a breakout from the top is still very possible, especially since this type of chart pattern usually breaks from the top.
Will Ether break this pattern from the top, towards $4,700, or from the bottom, with a return to the next support at $3,300 or even the objective of breaking the triangle at $2,800? To know the answer, we will have to wait a little longer to see on which side the breakout will take place
In conclusion
Bitcoin (BTC) and Ether (ETH) are still in a short-term downtrend, but patterns suggest the possibility of a bullish recovery if they break out from above. We are therefore watching for a breakout of these chartist patterns, in order to enter a position towards their target