
Despite a nice bullish impulse in the middle of the week, Bitcoin (BTC) and Ether (ETH) have finally lost all their progress of the last few days. How far will this decline continue?
Bitcoin traps buyers and goes back down
While a majority of cryptocurrencies were seeing some bullish momentum re-established in the short term, with the breakout of a descending wedge at h4, the market eventually turned around very quickly, rejected by resistance at $40,000.
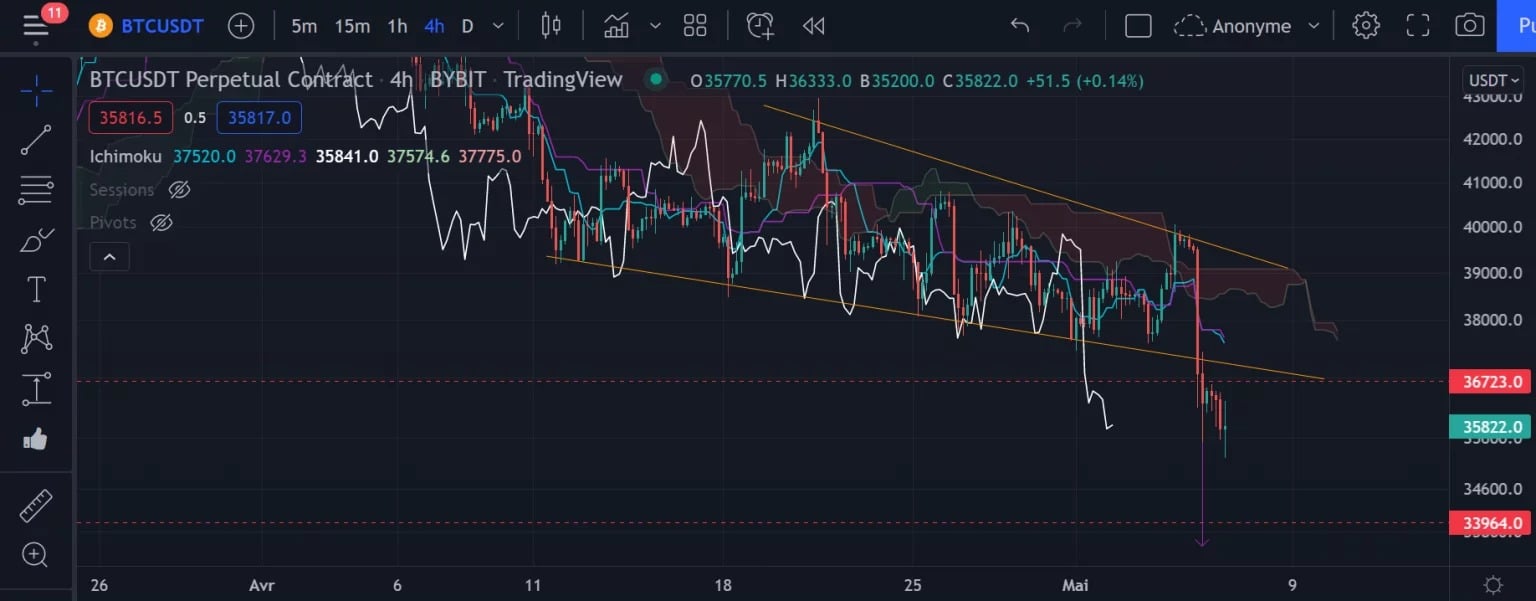
Figure 1: Bitcoin price chart (h4)
The Bitcoin (BTC) price had managed to break out of its bullish bevel, thanks to the weak passage of the cloud. But it was at the opening of the US markets on Thursday that the price finally took off violently with a daily red candle of -10.87%, the day after the FED announced an additional 0.5% rate increase.
After breaking its multi-week low trendline, BTC yesterday triggered a bearish target at around $34,000. This corresponds to the height of the triangle at its entry, carried over to the location of its breakout. A price target that corresponds to the previous low point of the market, made last January. If this support at $34,000 were to give way, the $31,500 level would then be in sight (next support).
So is the medium-term bullish scenario unfortunately to be forgotten? It would seem so. It is imperative that the price breaks above its previous high at $40,000. As long as this resistance is not broken, crypto currencies are likely to continue their downward trend. If Bitcoin were to break back above this key level, the prospect of a possible return to $42,000 would be open.
Ether is holding up, but it’s still at the end of its compression
Like Bitcoin, the price of Ether (ETH) has finally pulled back inside its downward sloping wedge, after a false breakout.
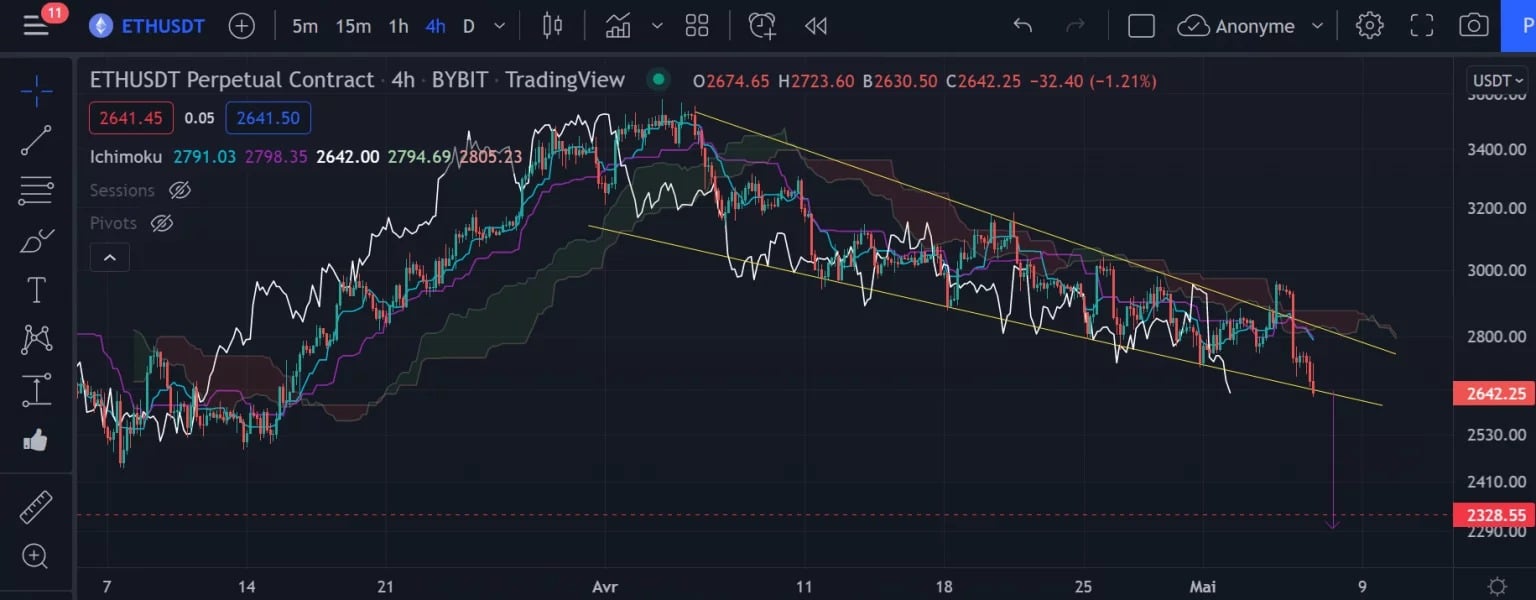
Figure 2: Ether (ETH) price chart in h4
While the ETH seems to want to break its wedge from below, the bullish scenario seems to be compromised since it would have to break back above the previous high at $2,970. A resistance that will now be quite difficult to pass since the Ichimoku cloud is rather thick, reinforced by the Tenkan and the Kijun on the way.
The preferred scenario in the short term will therefore be bearish, with a target at around $2,330 once the wedge has been breached from below.
In conclusion
Bitcoin and Ether have failed to preserve their bullish signals. The large rejections that have taken place over the past few days suggest that the downside is likely to continue on the cryptocurrencies.