
The significant volatility recorded recently can be explained by a strong influx of futures and spot demand, particularly from ETFs. How far could BTC go if the rise continues?
New surge for BTC
After a strong upward momentum last week, the price of Bitcoin is attempting to push towards new records. The significant volatility recorded recently can be explained by a strong influx of futures and spot demand, as well as a series of short liquidations on the derivatives markets.
With BTC on the verge of price discovery, what can we expect in the coming weeks?
Towards new historic highs
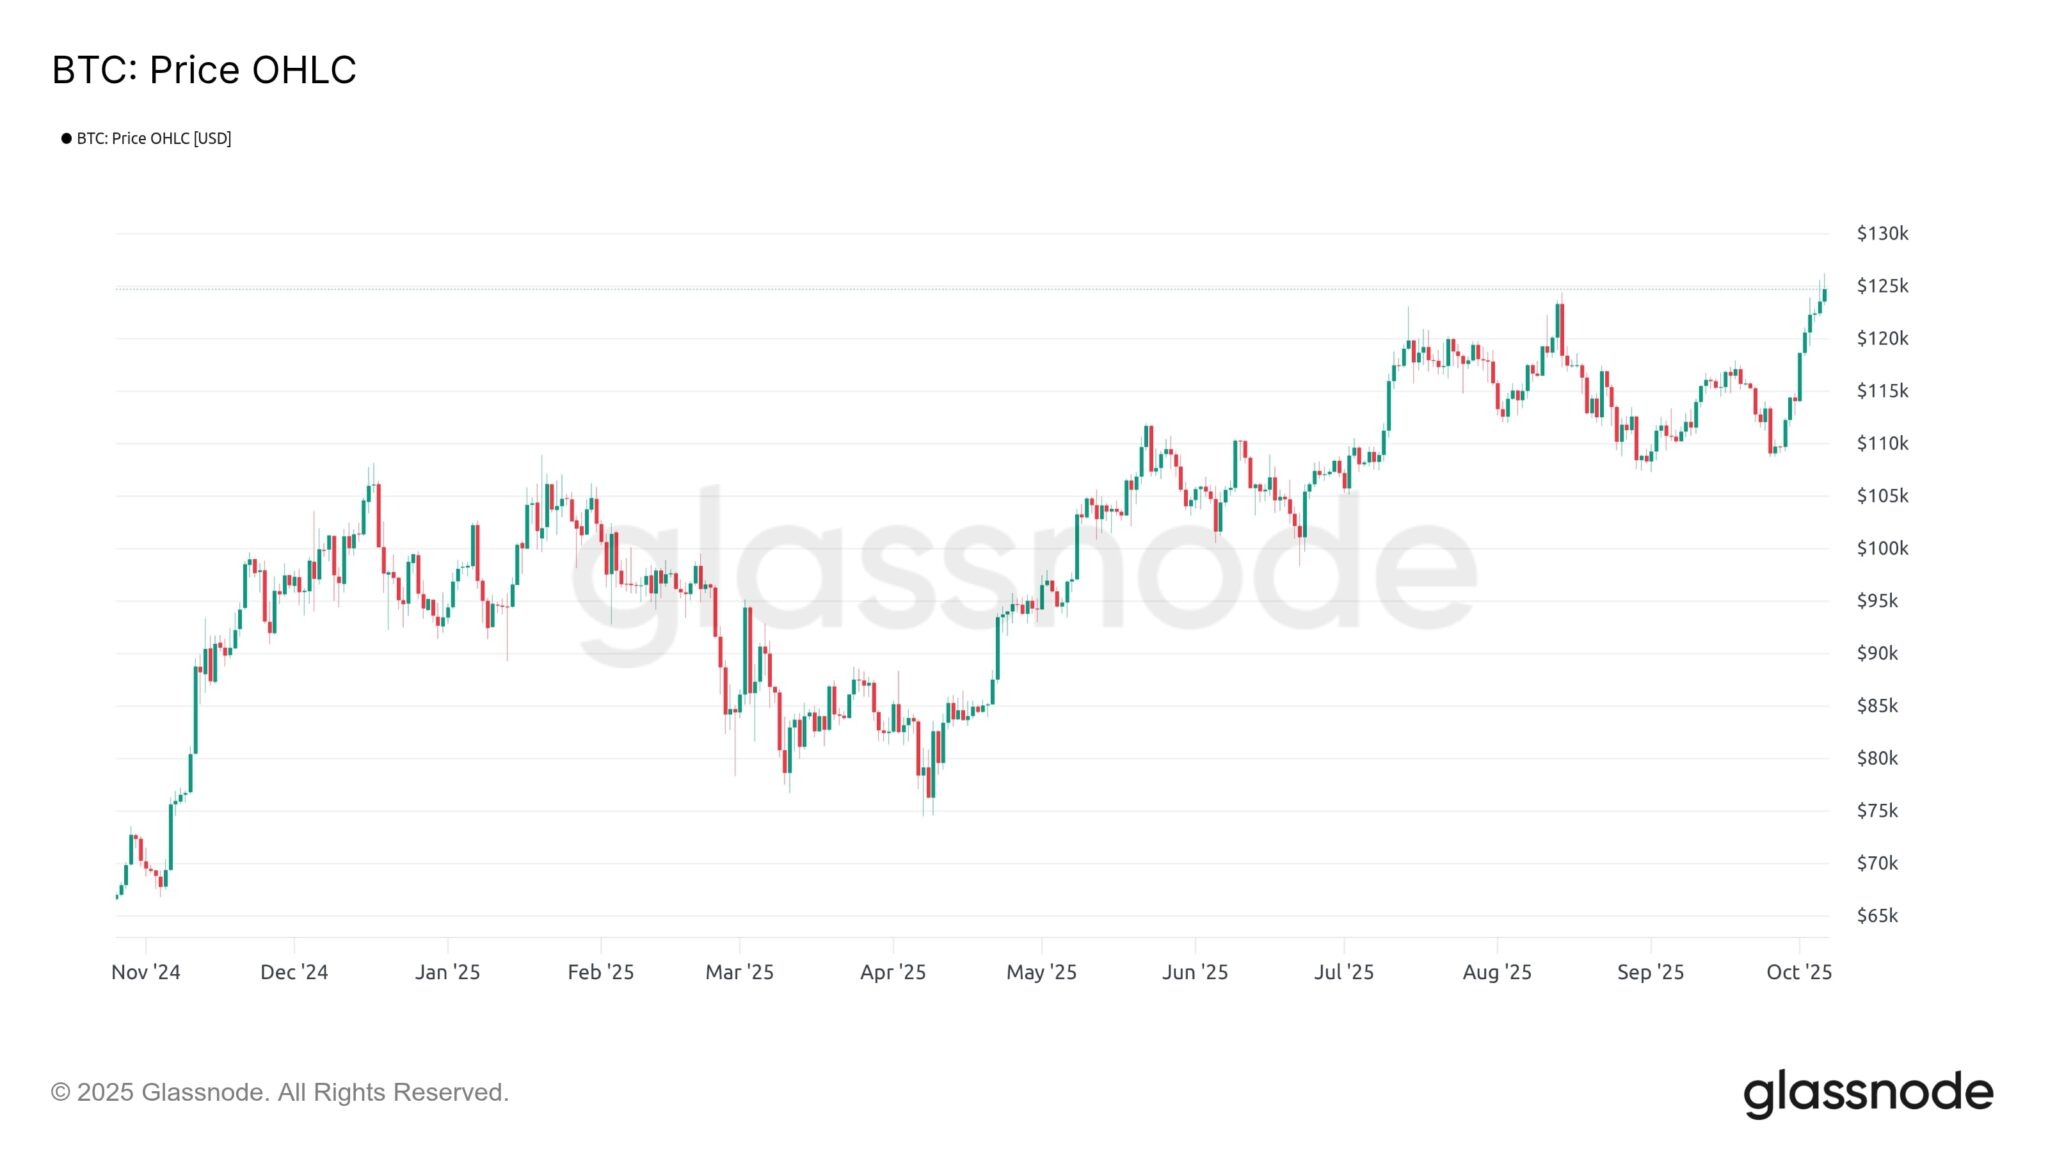
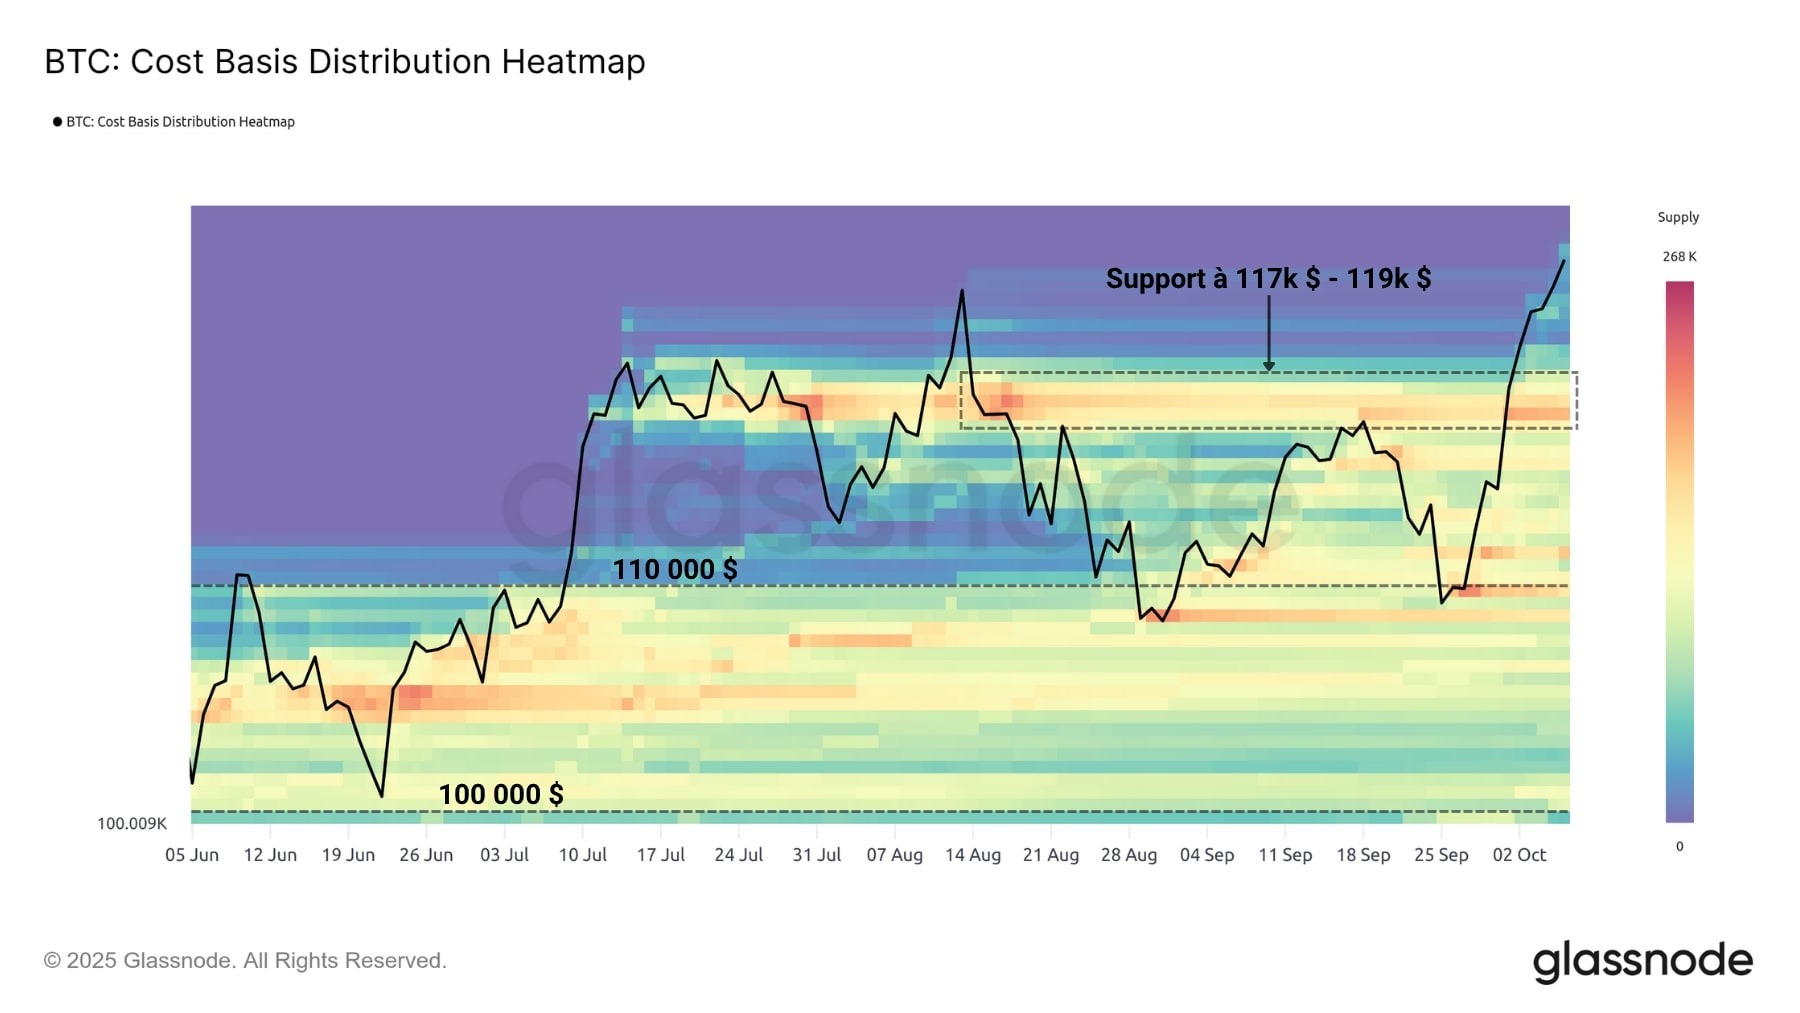
The BTC price finally managed to break through the resistance level of $117,000 to $119,000, triggering a bullish continuation that has been ongoing since last week.
As long as the market remains above this former resistance (now considered support), BTC’s uptrend will remain intact.
If this support is invalidated, a new downtrend could emerge and call into question the viability of the bullish cycle that has been underway since 2022.
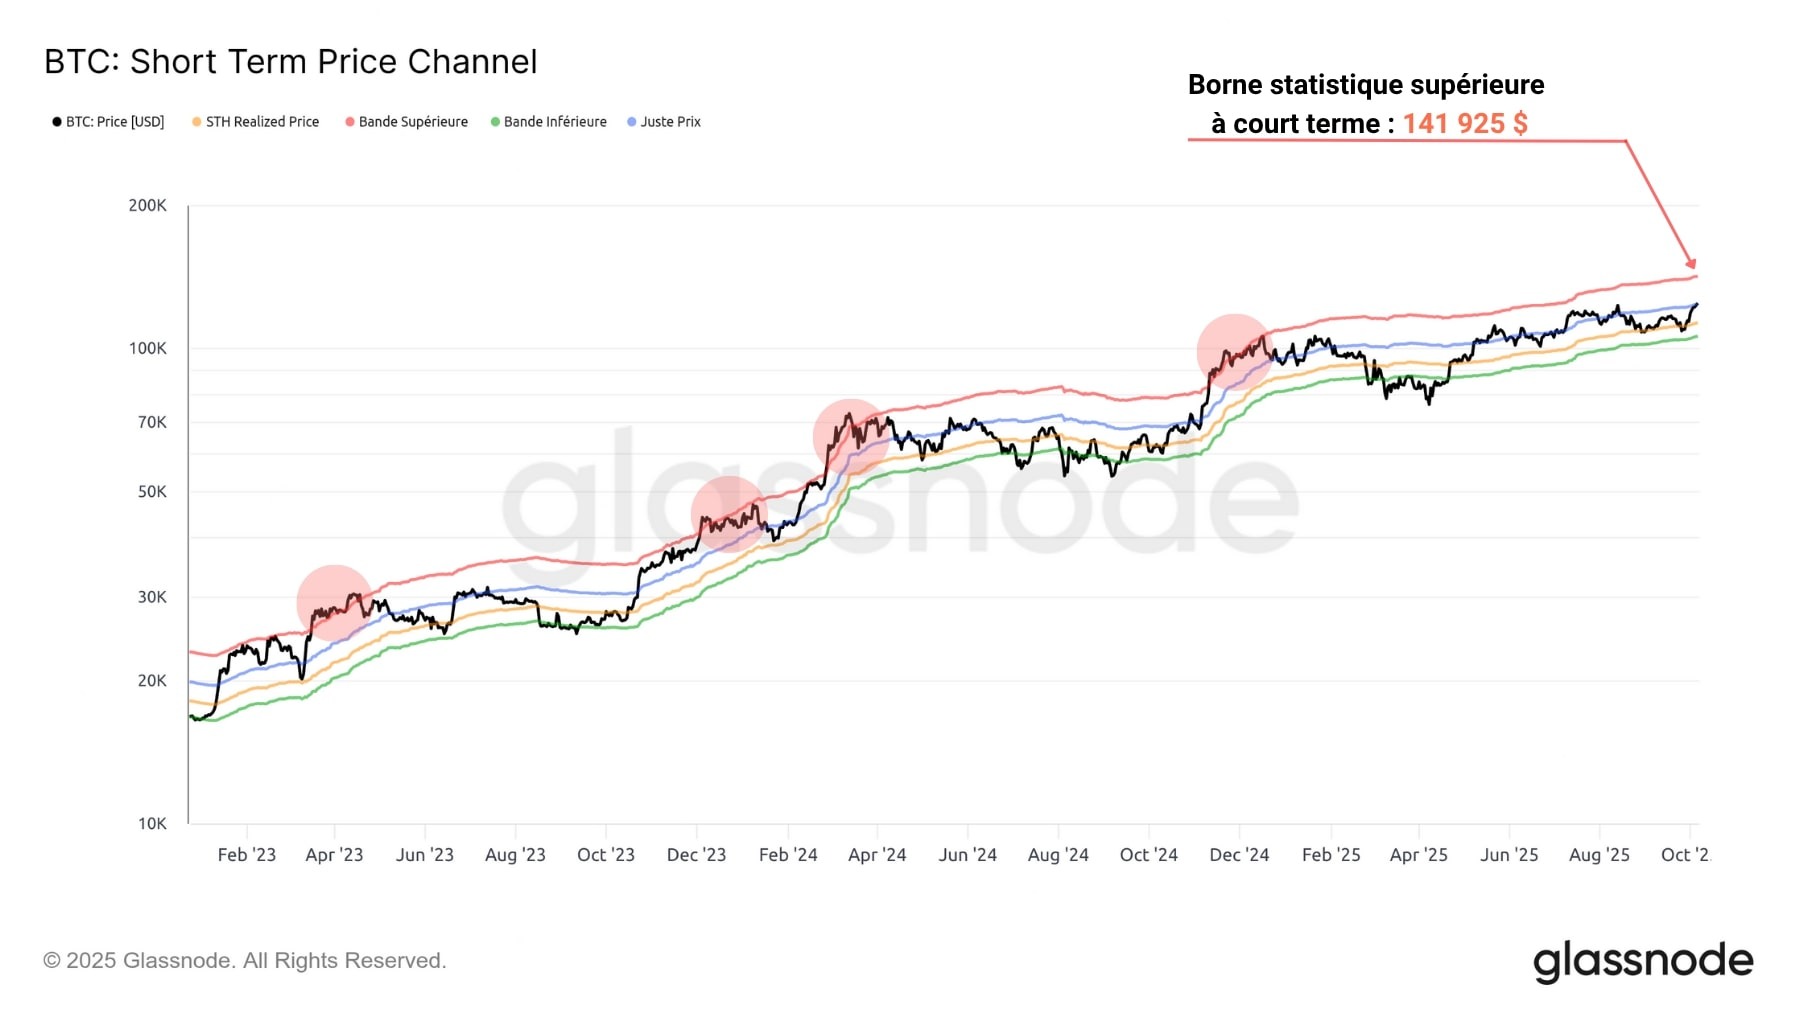
If the uptrend continues, the price target mentioned in our previous analyses remains the same, at around $140,000.
As this statistical threshold is mobile, it is possible that this estimate will be revised upwards in the coming weeks, potentially reaching values close to $150,000.
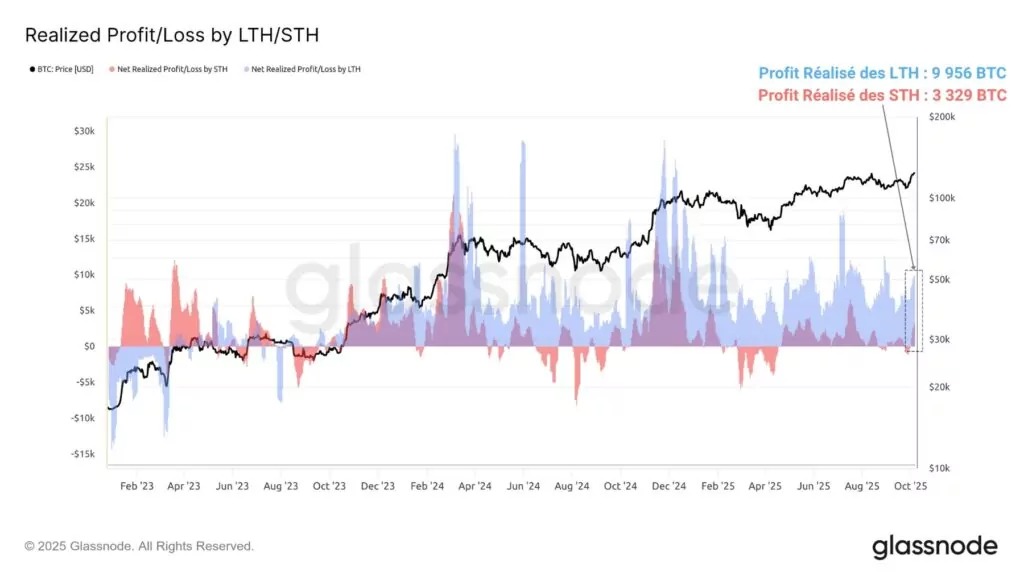
During price discovery phases, it is essential to measure the distribution behaviors of short-term (STH) and long-term (LTH) investors to estimate the selling pressures that could potentially slow down the price.
To date, LTHs are generating selling pressure of close to 10,000 BTC per day, realizing profits in excess of $1 billion per day. On the other hand, STHs are also taking profits, but at a rate three times lower than their long-term counterparts.
Compared to the local peaks in March and December 2024, current sales volumes remain low, suggesting that potential obstacles to growth are not currently significant.
Who is fueling the rise?
After examining the potential selling pressure from short- and long-term investors, we can look at other aspects of the market to estimate the buying pressure that is driving the price at the moment.
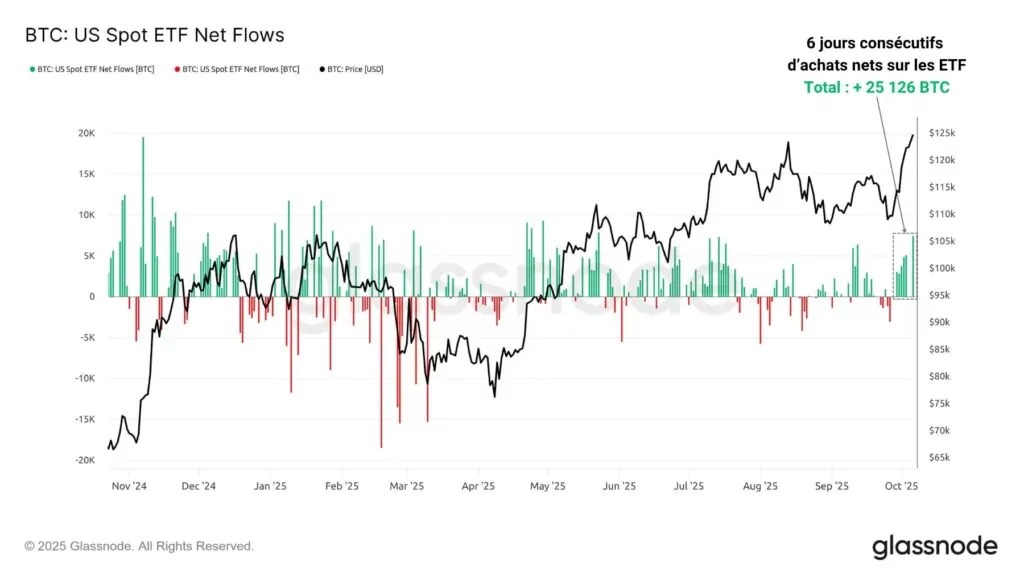
First, spot ETFs in the US are a major catalyst for the current rally, recording nearly 25,000 BTC accumulated over the last six days of traditional market trading.
The growing demand for ETFs over the past week has clearly helped BTC recover, bringing a significant amount of spot buying pressure.
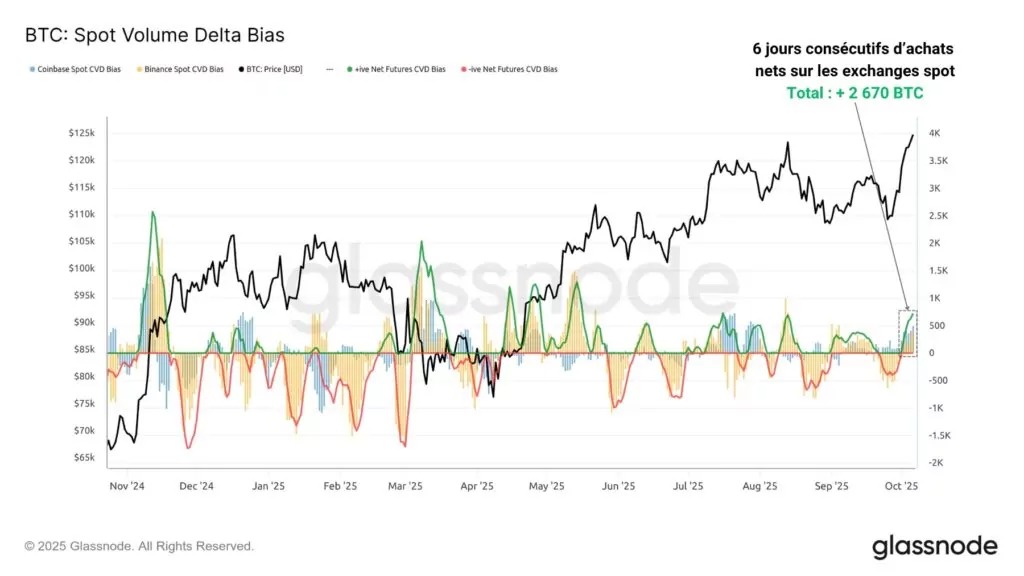
On centralized spot exchanges, a similar dynamic is visible, although the intensity of demand is much lower.
For nearly six days, Binance and Coinbase have also traded nearly 2,700 BTC in net purchases, nine times less than spot ETFs. Although this buying pressure is welcome, it is difficult to say whether it has really tipped the balance.
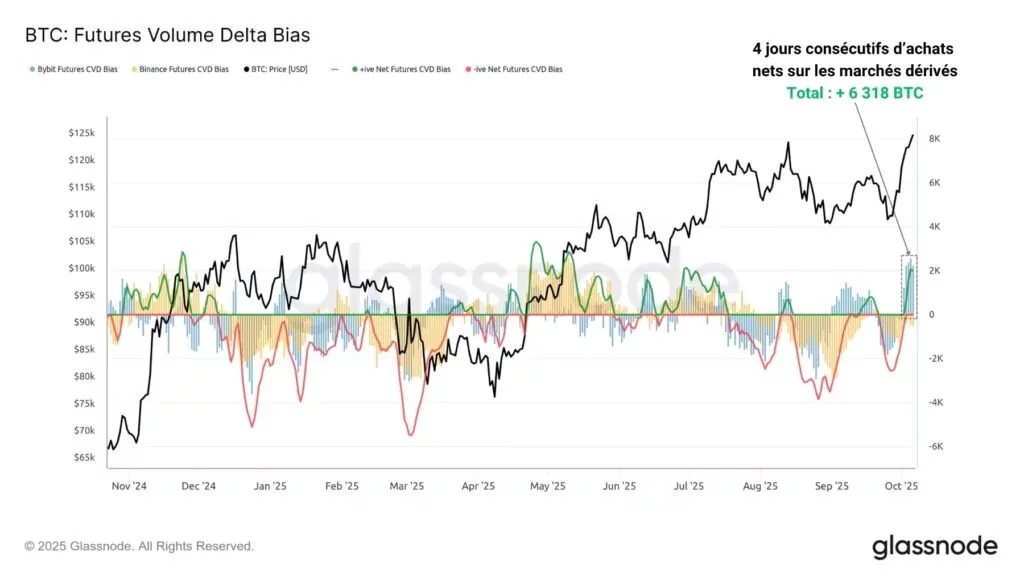
Finally, the Bybit and Binance futures markets recorded four consecutive days of net buying, totaling nearly 6,300 BTC, more than double that of centralized spot exchanges.
This signals the opening of numerous long positions, repeating the eternal cycle of speculative risk and posing new dangers to the markets in the event of a rapid correction in BTC.
Ultimately, without demand from spot ETFs, buying pressure from derivatives markets would have been predominant, which could have led to less impulsive price action and a less sustainable rise.
Summary of this on-chain analysis of BTC
Finally, this week’s data indicates that the recent high volatility is explained by a strong influx of futures and spot demand.
Spot ETFs in the US are the main driver of the current rally, with nearly 25,000 BTC accumulated over the last six days.
The second source of demand comes from the Bybit and Binance futures markets, where many long positions have been reopened, putting new risks of liquidation cascades on the markets.
However, as long as the market remains above the former resistance level of $117,000 to $119,000, BTC’s uptrend will remain intact.