
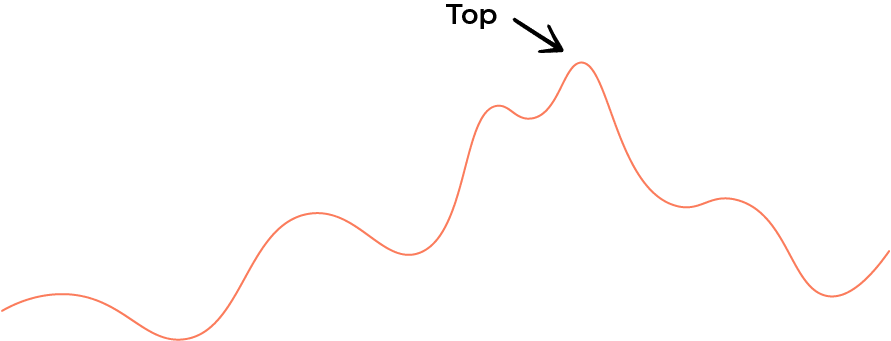
A top is a high point reached by the price of an asset over a given period of time. In technical analysis, it is imperative to know how to detect these tops, because they not only make it possible to define relevant price targets, but also to anticipate possible reversals of the trend. We explain how to spot them
What is a top
In trading, a top reflects a high point reached by the price of an asset. These tops can be identified in all types of chart patterns, regardless of the trend.
Indeed, the price can touch high points in the short term without this calling into question the long-term downward trend, hence the importance of the time scale used to carry out graphic analysis.
It is also important to remember that the price of an asset naturally oscillates between high and low points, which are natural market breaths.
For cryptocurrency trading or the stock market, a top can be considered as resistance, a fundamental concept in technical analysis. The latter plays a major role in predicting a trend reversal, and placing your stop orders (take profit and stop loss) accordingly.
Why is it important to spot tops?
Tops are key thresholds that can be seen as profit taking thresholds for traders who are long (those betting on the asset going up). They can also be seen as support in the making for short traders (those betting on the asset going down).
If the price repeatedly hits a high and retraces each time it hits it, then the high will be identified by the market as resistance: this means that there is a high probability that the price will fall back once it hits this high. This is why traders try to spot tops: buyers will take profits when the price hits that high point. Sellers will choose this point to place their stop loss.
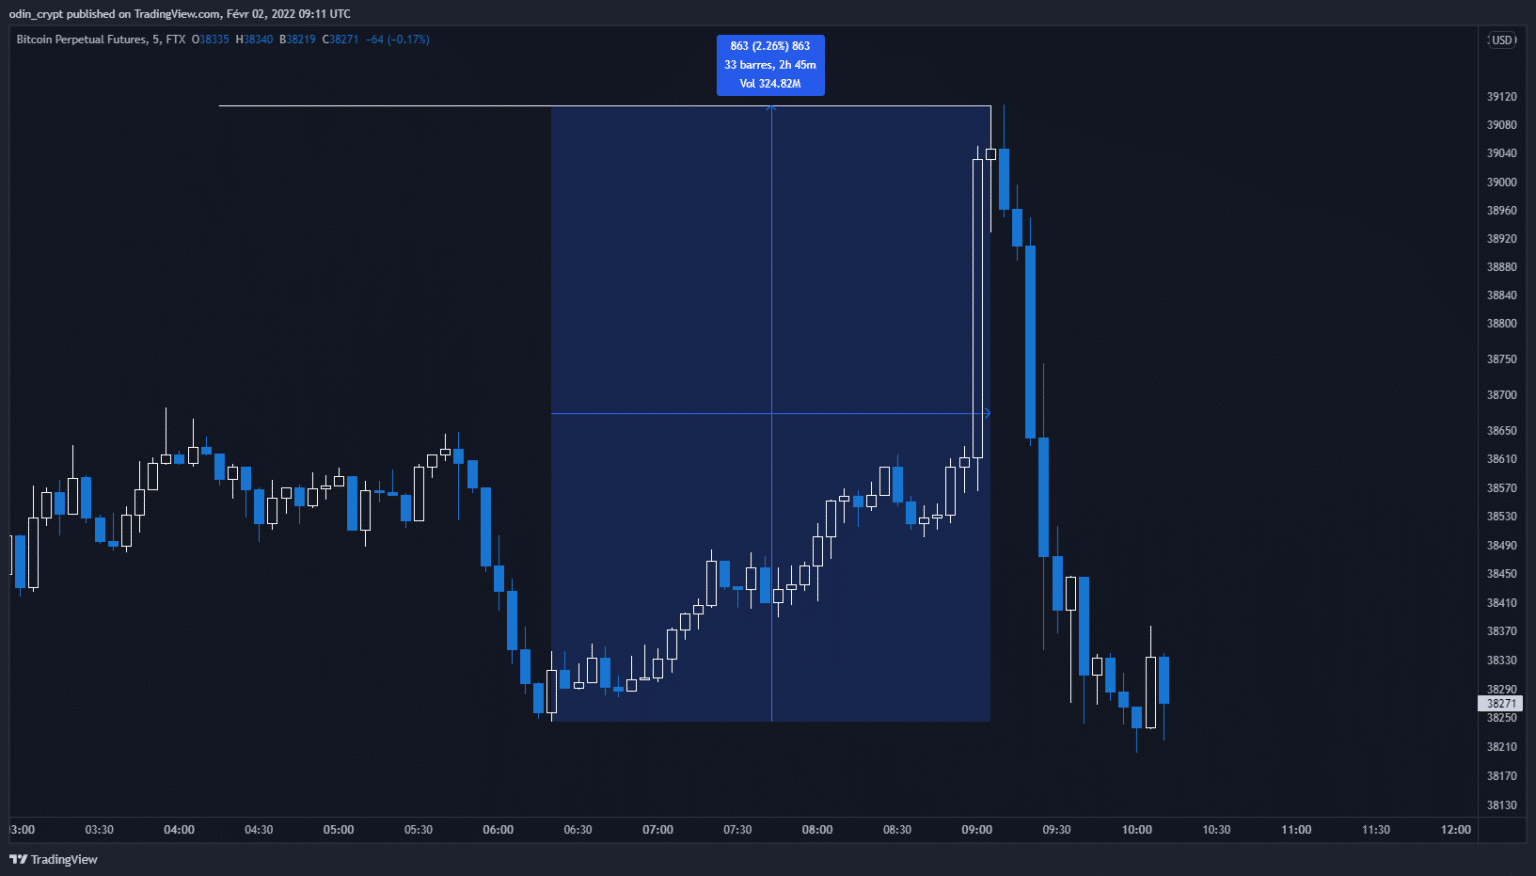
Example of a top (Source: TradingView)
Conversely, what happens if resistance is breached? Breaking resistance sends a strong signal to the market: the balance of power between buyers and sellers is clearly in favour of the buyers, sellers capitulate and the price can then accelerate upwards. From the point of view of technical analysis, the overcoming of resistance transforms the latter into support. A top can therefore be both a threshold to take profits or to cut losses, depending on your trading strategy.
Chartist patterns that use tops
Many Chartist patterns can be identified by a succession of tops. Among these tricks, we can mention two famous reversal tricks: the double and triple tops

A double top
As a reminder, a double top appears at the end of an uptrend. It is easily recognizable as an M-shaped pattern that predicts a bearish reversal.
The triple top is a chartist pattern represented by three successive tops. Like the double top, this pattern indicates a weakening of the buying current and the inability of an asset’s price to break above its highs, resulting in a bearish reversal.
Conclusion
The ability to spot tops is fundamental in technical analysis, as it is from these thresholds that trend reversals can be triggered. Detecting tops also allows you to gauge the balance of power between buyers and sellers and to define relevant objectives (stop loss or take profit).