
The continued slowdown of inflation in March in the US and the prospect of a bearish monetary pivot by the FED are still the two anchoring factors for the uptrend in the bitcoin price. The latter is attempting this week to make a bullish technical break of the $29,000 chartist resistance, a potential signal that must be confirmed at Sunday’s weekly close.
Inflation continues to decline in the US, the US dollar is under bearish pressure
The bullish performance of the Bitcoin (BTC) price this year now exceeds 80%, with 35% of that alone following the March banking crisis. Gold, silver and BTC are in the same basket of winners from the distrust of US regional banks, but it is not the banking crisis that is driving the upward movement of BTC and precious metals.
This episode of banking stress sustained an older dynamic of capital outflow against the US dollar in the foreign exchange market. The bearish movement of the US dollar started last fall and is acting upwards on the crypto market through a well established reverse correlation effect over time.
Recall the sources of the decline of the US dollar:
- The disinflation sequence initiated a few months ago in the United States;
- The increased probability of a recession in the United States;
- The envisaged proximity in time for the Federal Reserve’s (FED) terminal rate;
- An anticipated downward pivot this year for the FED interest rate cycle;
- More generally, a gradual de-dollarization of the world economy, a desire expressed in particular by several major Asian countries.
So let’s keep in mind that bitcoin would not be at $30,000 without this generalized decline in the dollar on Forex and that therefore it is imperative that the dollar continues its decline for BTC to reach further upward price targets.
In terms of technical analysis of the (US) dollar, the market is currently testing the 101 point mark, a level that would accelerate the decline if broken.
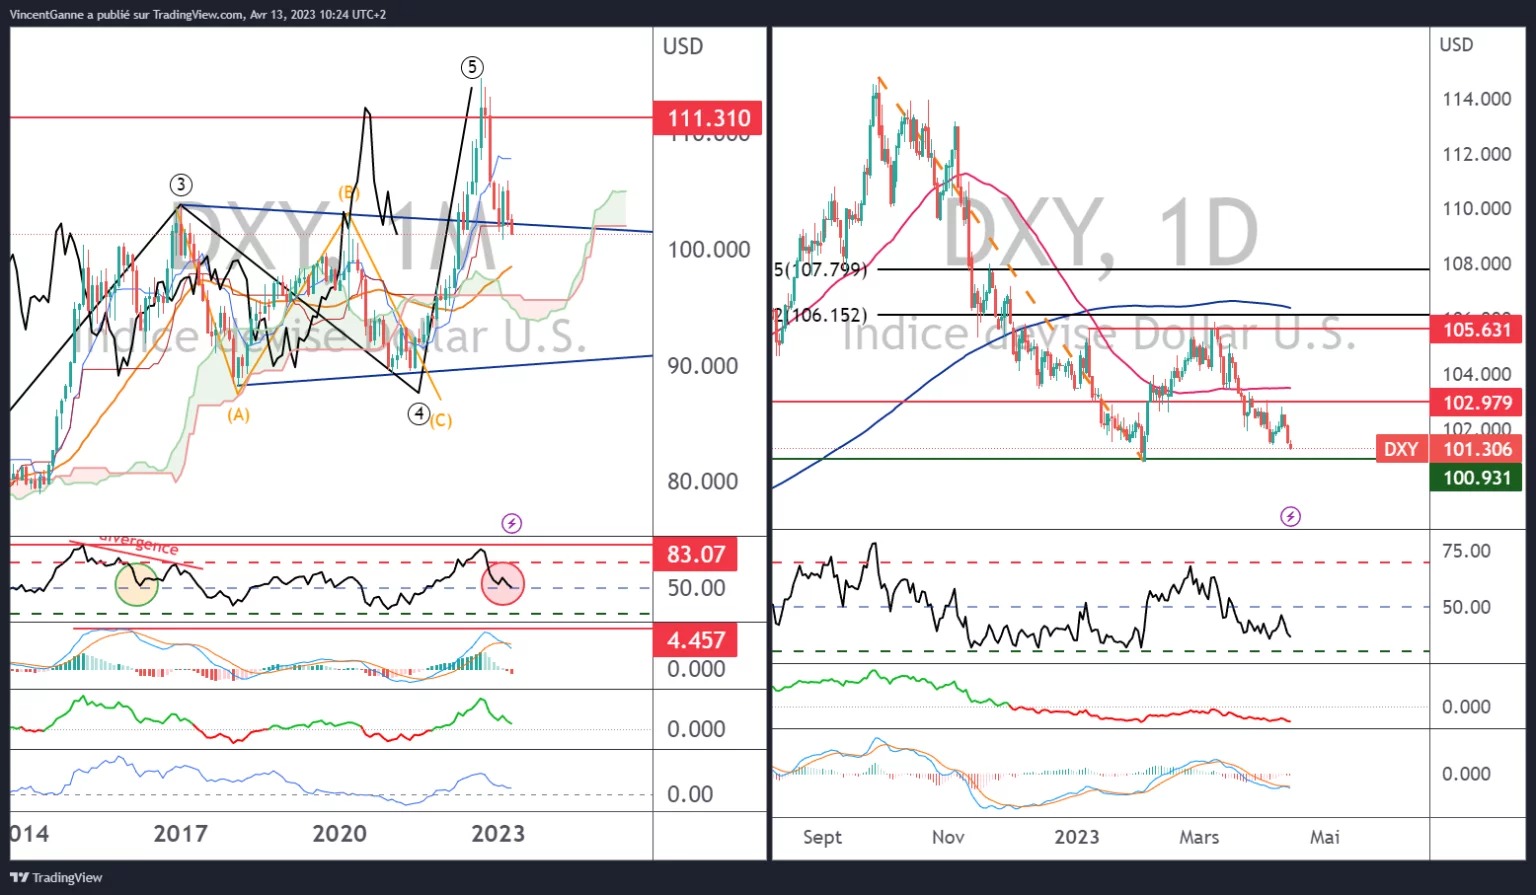
Chart that juxtaposes the weekly Japanese candlesticks (left) of the US dollar price (DXY) with the daily Japanese candlesticks (right)
Bitcoin attacks major chartist resistance at $29,000
Now back to chart considerations for the bitcoin price, which is attempting this week to break through the major resistance of $29,000, the top of the powerful bearish gap that was opened on Monday, June 13, 2022.
If this resistance is breached on a weekly closing basis, then the next chartist targets will be at $32,500 and $34,000.
Finally, I note that BTC’s dominance is holding below its range top resistance, gradually passing the baton into the hands of ETH and some altcoins. If the troops start to follow the general, then this will be positive for the overall bullish pattern.
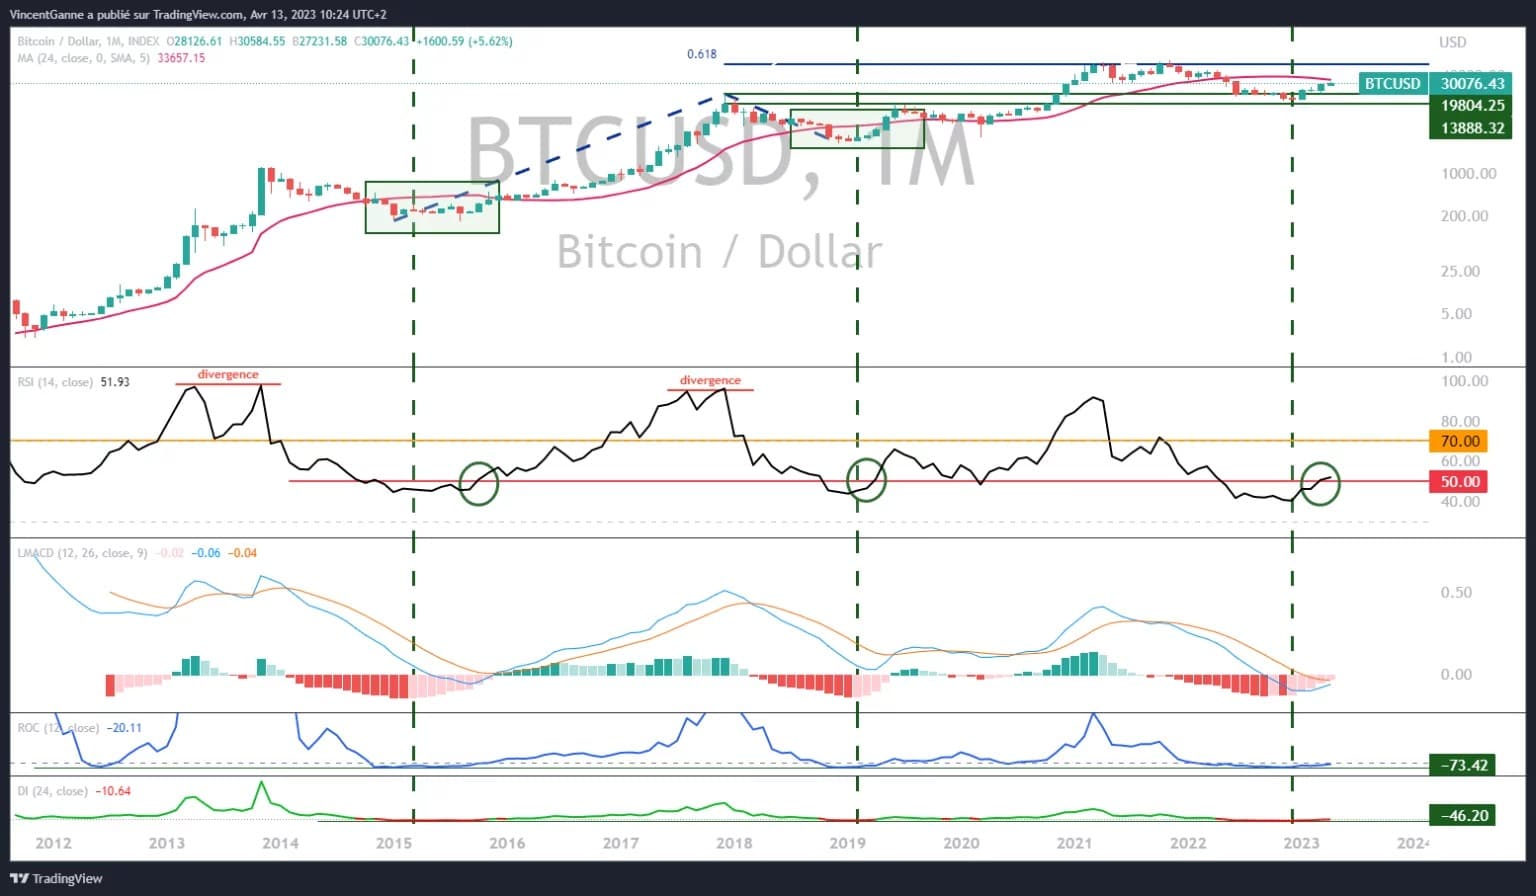
Chart that reveals the monthly Japanese candlestick price of bitcoin