
Bitcoin appears to be entering a period of consolidation following the correction that began in early November. A rebound is currently taking shape, but will it be enough to confirm a bullish reversal that paves the way for new highs, or will it instead mark the end of the previous rally?
Expectations for rate cuts are on a rollercoaster ride
On Tuesday, November 25, 2025, at 10:41 a.m., Bitcoin is trading around $86,800, after finding support in the $80,000 range, reflecting an attempt to stem a sustained downtrend.
The NFP employment report released late last week reignited tensions surrounding the U.S. Federal Reserve’s monetary policy, reducing expectations of a rate cut in December to 30%.
This structural signal suggested a shift in market sentiment, triggering a “risk-off” dynamic and unfavorable arbitrage for risky assets.
Against this backdrop, major stock indices edged lower, while cryptocurrencies plunged into a sharp downtrend, serving as a reminder that a bearish reversal remains a very real possibility.
Indeed, the widespread optimism that has prevailed for several months may be running out of steam. The market has reminded us of this in recent days through rising fears, affecting a wide range of financial assets.
However, statements from Federal Reserve members on Friday had a calming effect: a consensus seems to be emerging in favor of further rate cuts at the next meeting.
Of course, inflation remains a concern, and the job market is showing signs of recovery. Yet this morning, 80.9% of market participants anticipate a rate cut, paving the way for a moderate but confident rebound.
In the Bitcoin derivatives markets, sentiment is once again consistent with the prevailing fear, and sellers now hold the majority.
In fact, this sentiment is prevailing at the start of the week, despite a rebound of about 10% for BTC.
It is reassuring that the bearish denial is coming to an end, which could finally allow a bottom to form.
Nevertheless, the situation should be monitored closely. Indeed, a return to a bullish bias that is too rapid could be punished one last time.
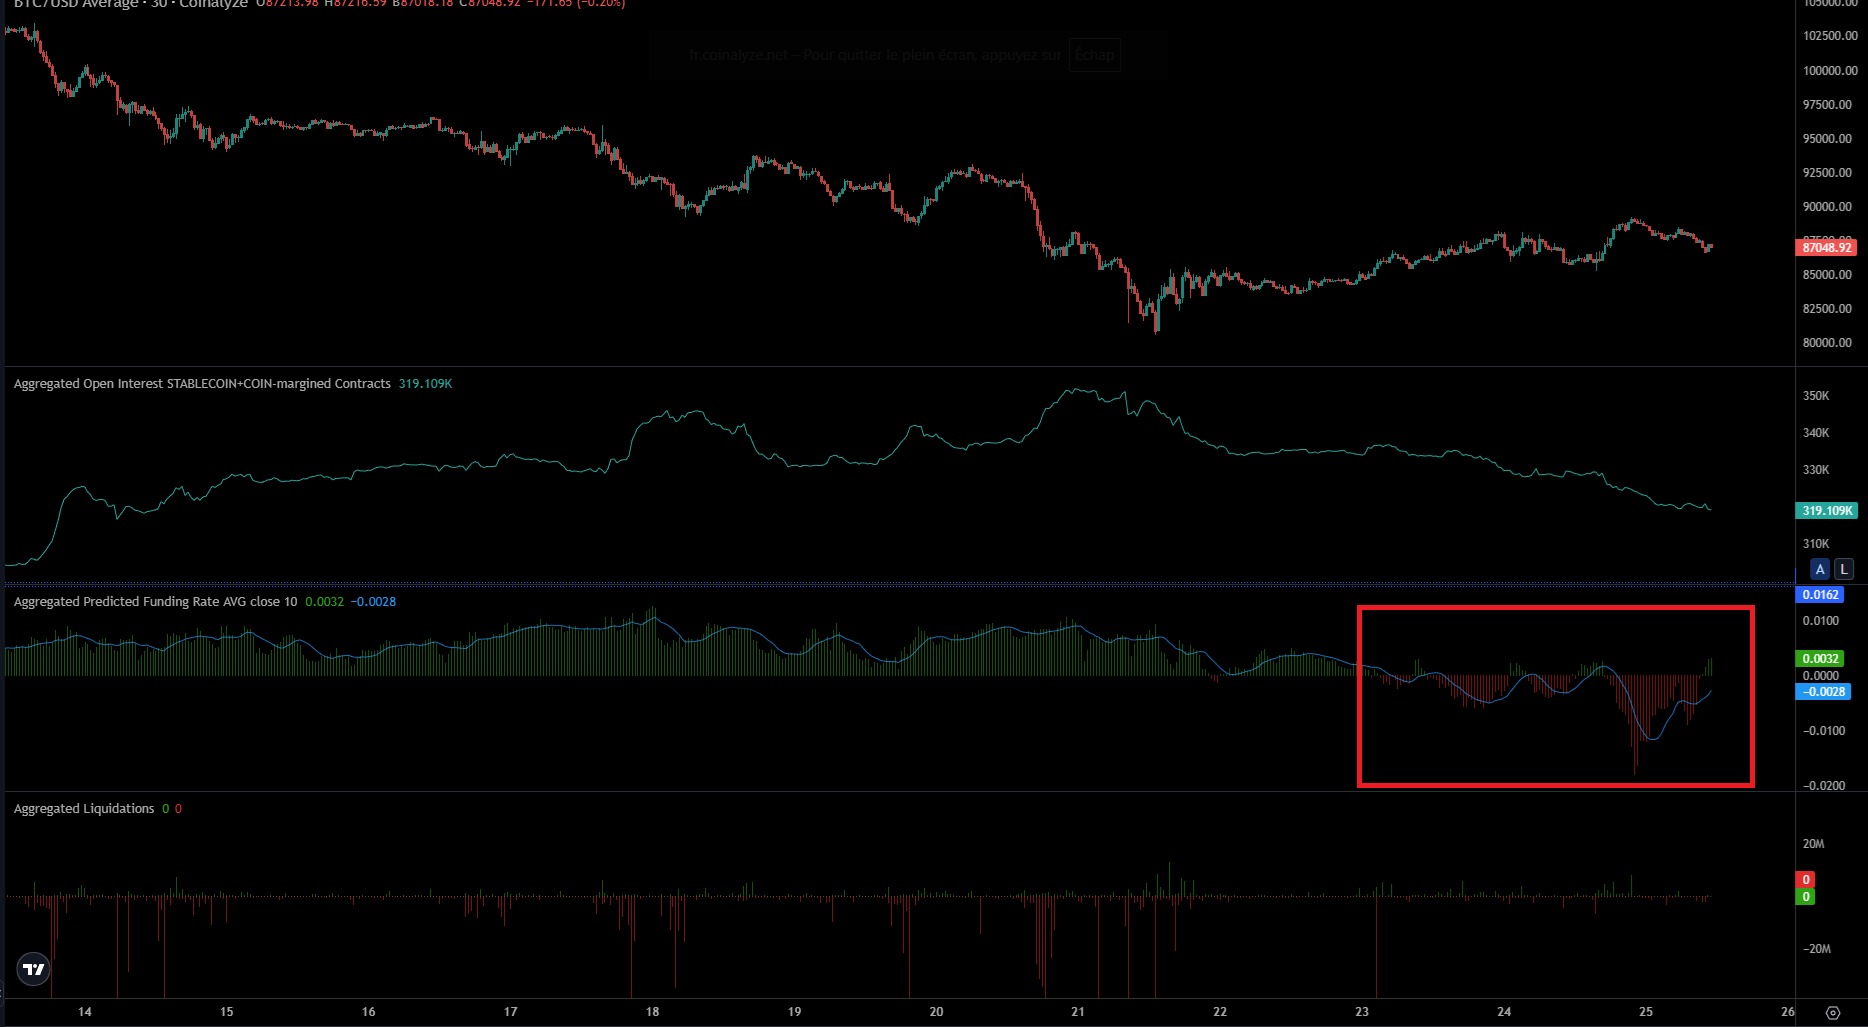
Bitcoin derivatives market chart and indicators
Bitcoin’s performance indicators largely reflect the correction observed in recent weeks, while highlighting BTC’s resilience compared to its counterpart, Ethereum. However, the momentum appears to be gradually reversing, as evidenced by recent 24-hour data trends.
Is this a technical zone conducive to forming a sustainable low?
In several previous analyses, we highlighted the obvious denial of the downtrend, which was clearly visible in the derivatives markets, despite a rapid and powerful move.
This contradictory behavior—which saw long positions being opened during the downturn—fueled the movement and made it difficult to establish a consolidation phase aimed at restructuring for an upward trend.
Now, within a zone where a rebound is highly likely—as part of the weekly structure formed from March to April 2025—Bitcoin is showing an initial positive reaction upon reaching the $80,000 level, the polarity zone of this same consolidation phase.
It is difficult, for the moment, to characterize the current movement: it could be a simple technical rebound or a correction leading to a continuation of the weekly downtrend that began in early November when the $103,000 level was broken.
In this second scenario, BTC could attempt to reach a new high below the previous one. The $98,000 threshold is a rebound target that, if rejected, could confirm this scenario.
A second, broader zone can also be considered in the event of a deeper “dead cat bounce”-style correction: it is located between $103,000 and $108,000.
The price reaction in these two zones, should we revisit them, will be extremely important.
The scenarios outlined above may take time to unfold; the current downtrend, much like the structure that formed at the end of the first quarter of 2025, may require a few weeks before providing a sufficiently solid foundation for a rebound.
This sideways transition phase would logically fit into a macroeconomic context awaiting key developments, thereby providing the time needed to lay the groundwork for a potential new uptrend.
It is also possible that the price could dip lower, near $74,000—the level of the most recent major monthly low. Long-term time frames rarely produce false signals; thus, if we were to break below this level, it is likely that the price of Bitcoin would aim to reach $55,000.
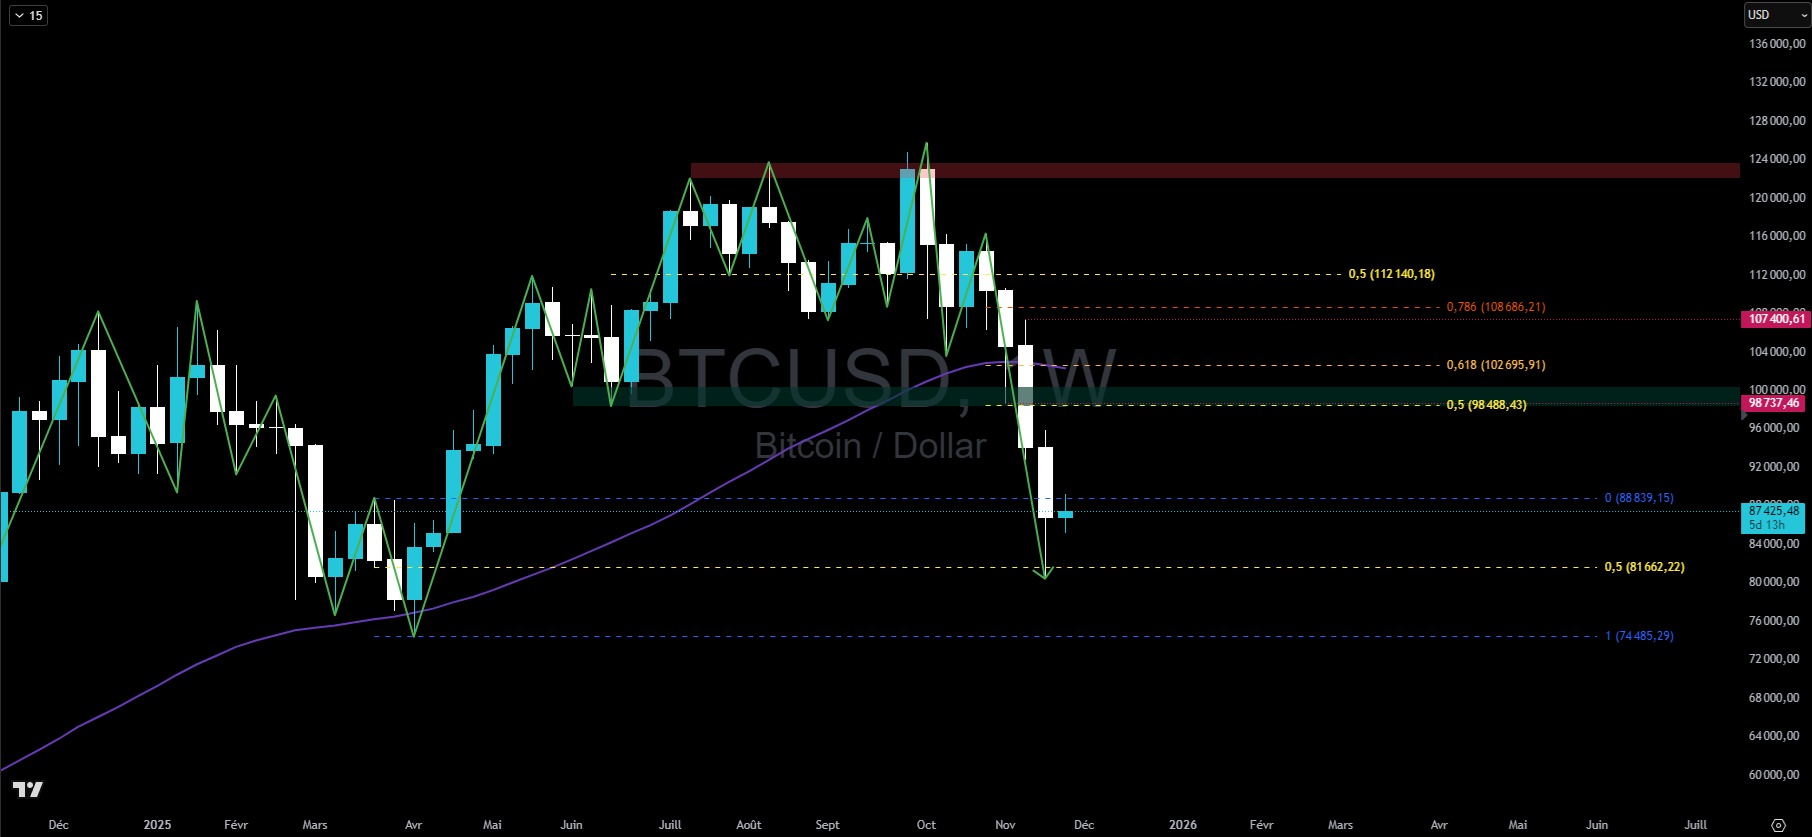
Bitcoin price chart on a weekly timeframe
On the daily chart, the bearish trend that had set in appears to be losing momentum, as the 7-day moving average has been broken. However, structurally, there are no major signals indicating that the low has been reached.
The reaction is clearly visible, and Monday’s confirmation—a continuation of Sunday’s movement—is also good news. However, it is very rare for such a powerful downtrend to reverse without some effort.
For the coming trading sessions, we will be monitoring the completion of the peak of the new uptrend currently developing, which should provide an essential reference point.
Once this peak is confirmed, it will provide us with reliable information to gauge the zones to which BTC might pull back in order to form a potential low higher than the previous one—a necessary element for the reversal to take hold.
At the current stage of development, assuming the peak was reached yesterday, a pullback to the $83,000–$84,000 range would be reasonable in order to continue the reversal process.
If this attempt were to fail, we would need to consider a further decline to establish the low point.
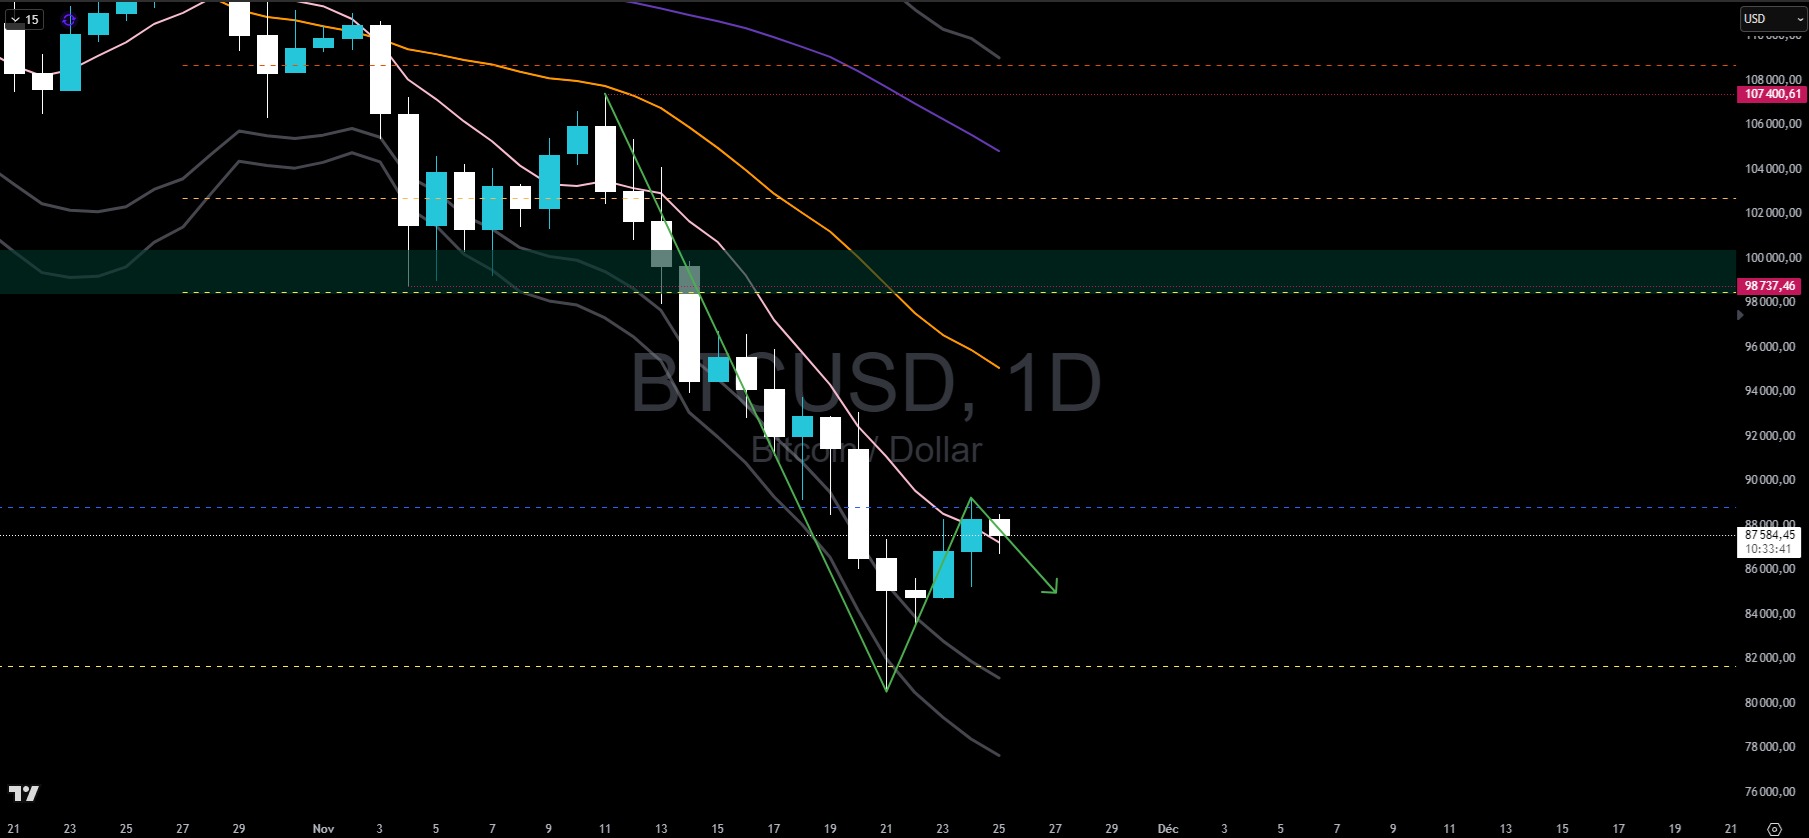
Bitcoin price chart on a daily timeframe
Join our premium Cryptoast Academy group, where we share altcoin analysis charts every week!
In summary, Bitcoin is still in a downtrend, although a rebound has begun. This rebound does not yet show any signs of a reversal. However, the area remains favorable for a bullish recovery, but we’ll have to wait for confirmation.
So, do you think BTC could reach $150,000? Feel free to share your thoughts in the comments.
Have a great day, and we’ll see you next week for a new Bitcoin analysis.