
Bitcoin (BTC) has been developing a bullish momentum since the beginning of the week, a move that could be the beginning of the end of a stock market lethargy that has lasted since mid-summer. Indeed, the measure of historical volatility of Bitcoin broke last week its bear market support in place since the spring of 2021, the historical low of volatility is in sight for a strong rebound, this is the guarantee of a November 2022 that will be hyper impulsive.
Bitcoin price volatility near all-time low support
The volatility of the Bitcoin (BTC) price has reached a level very close to its historical low at the end of October, with 7-day volatility possibly dipping below 1%.
This is an anomaly for an asset class with the highest volatility characteristics in the stock market, and we should now expect a very strong rebound in BTC volatility in November from the all-time low.
In concrete terms, what is the significance of an upcoming strong rebound in BTC volatility?
It heralds an early stage price movement that will be very broad this November, which is the following alternative and without half measures:
- A market stall below $19,000 support and a drop into the $10,000/$14,000 price range;
- A bullish resolution of the chartist compression that has been building since the summer and a bullish recovery towards $25,000/$28,000.
The choice of direction will be based on the major market correlations with the trend of the US dollar in Forex, market interest rates, and the equity market.
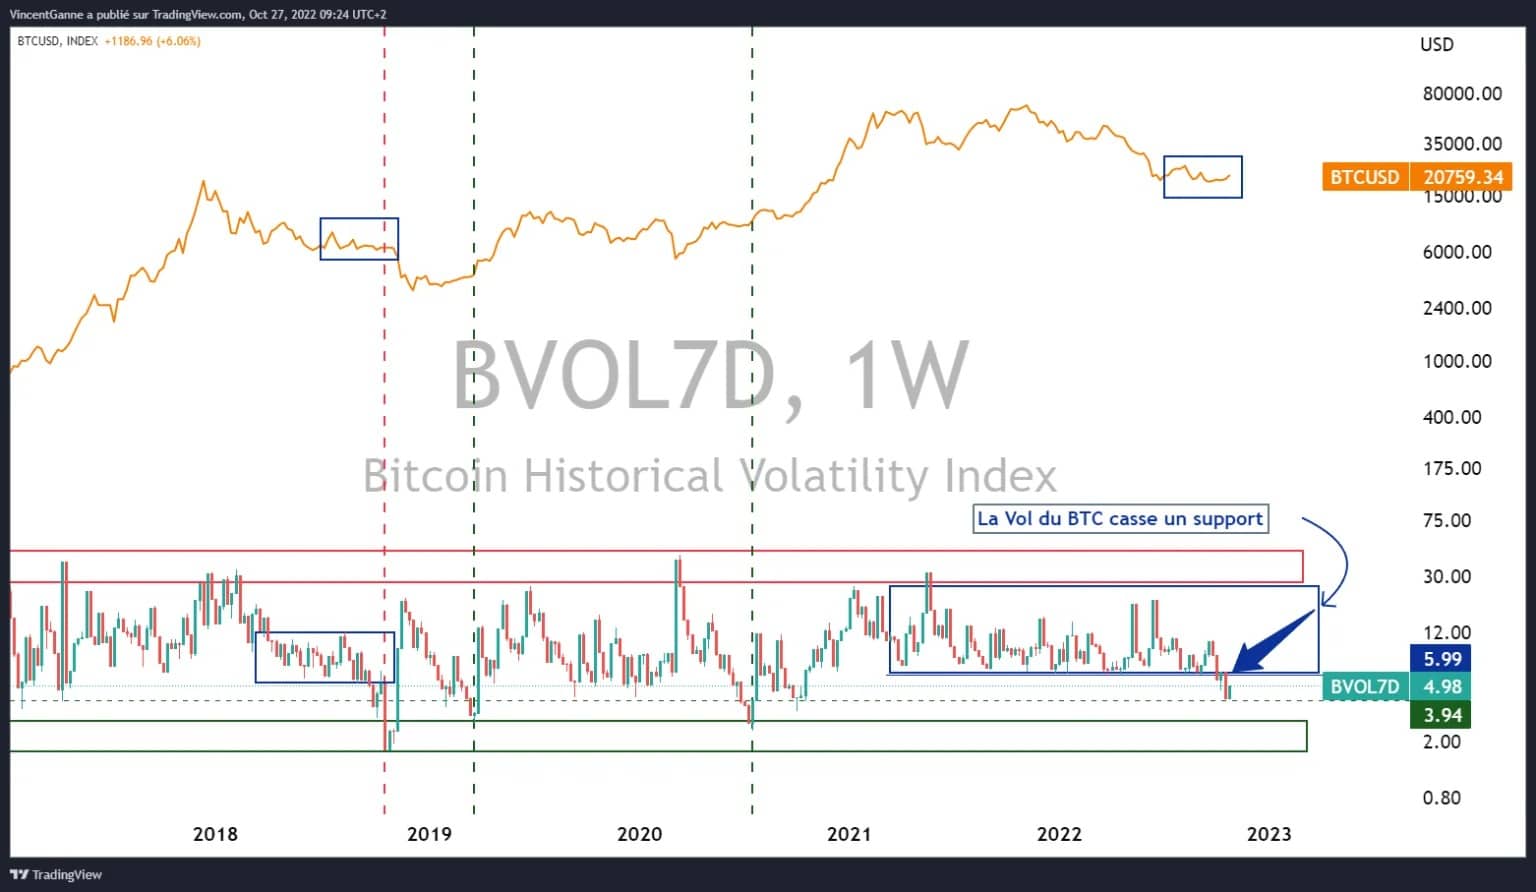
Bitcoin’s price compared to its 7-day historical volatility measure (bottom curve)
Cross-asset market and seasonality factors could be in favor of a bullish recovery in BTC
The starting point for the bullish impulse in the Bitcoin price earlier this week was the release of a very negative figure for US housing prices.
While house prices account for an average of 30% of the inflation rate calculation in the US, this gives the market hope for disinflation in the coming months and an end to rising interest rates.
Such a fundamental pattern of disinflation and falling rates would be a source of bullish recovery for total crypto market capitalisation.
Technical analysis also suggests that the Bitcoin price could outperform the equity market over the next few months on Wall Street. Technical analysis applied to the BTC/S&P 500 ratio curve gives bullish signals, i.e. a better relative performance of BTC against US equities.
Finally, the seasonality data reminds us that November is the best performing month for the Bitcoin price in 13 years, with an average performance of 55%.
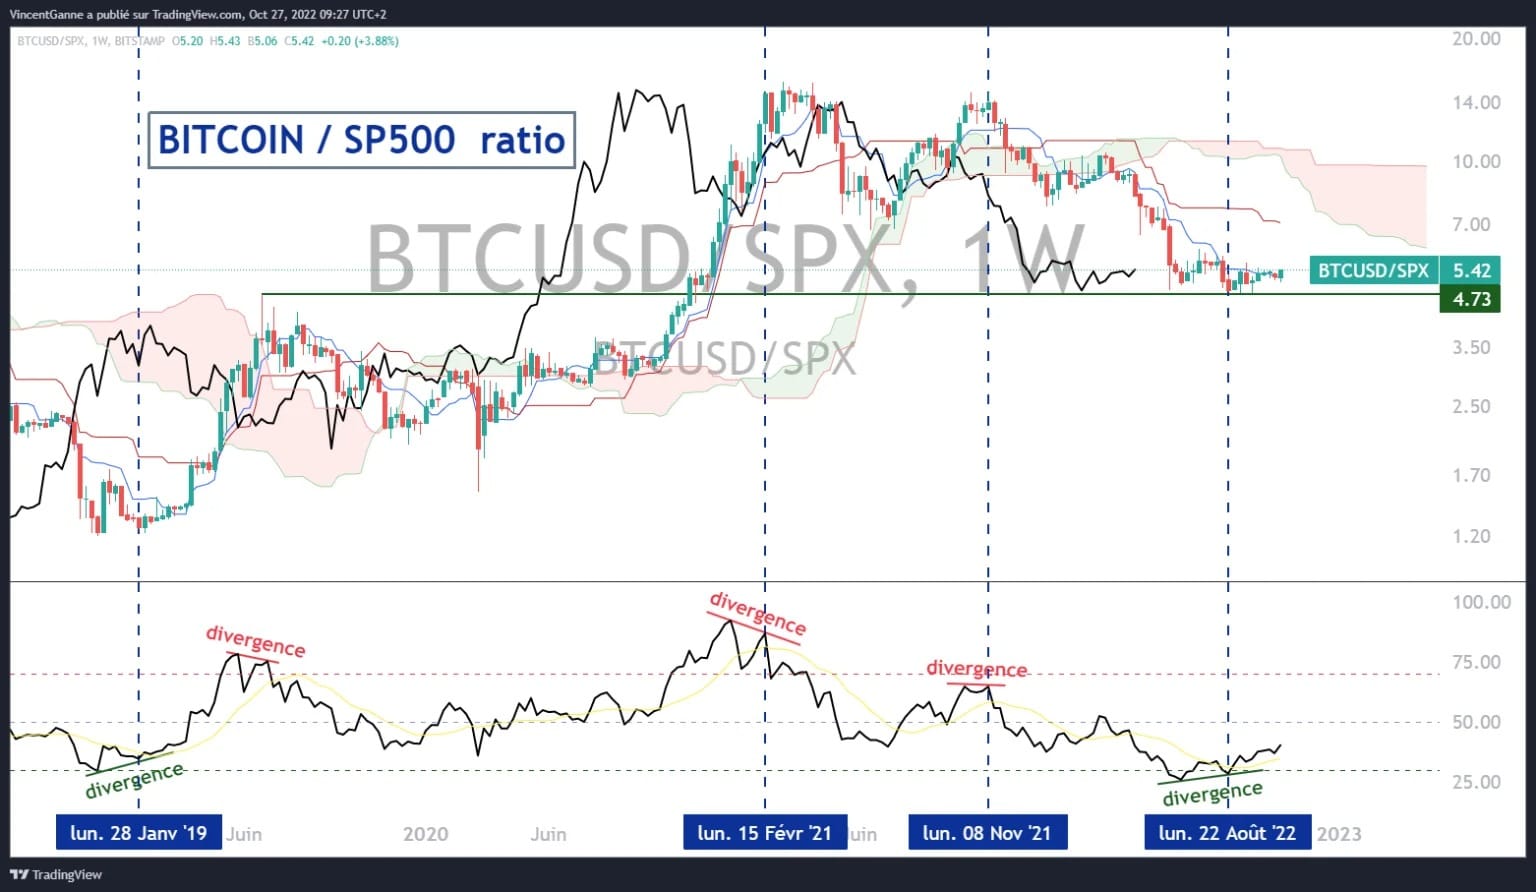
Weekly Bitcoin to P500 ratio, the relative ratio of BTC to the US equity market