
User engagement and activity on the Bitcoin network have been particularly low since 2024. As transaction demand plummets, the market is also facing significant spending behavior. Let’s take a closer look at what this means.
BTC Takes a Dive
As the BTC price attempts once again to dip below $100,000, recent entrants find themselves once again in the red.
Adding to the market’s apparent short-term fragility are new signs of a slowdown, with a notable drop in on-chain activity on the Bitcoin network.
How is Bitcoin network usage evolving, and what are the dominant trends right now? Let’s take a look!
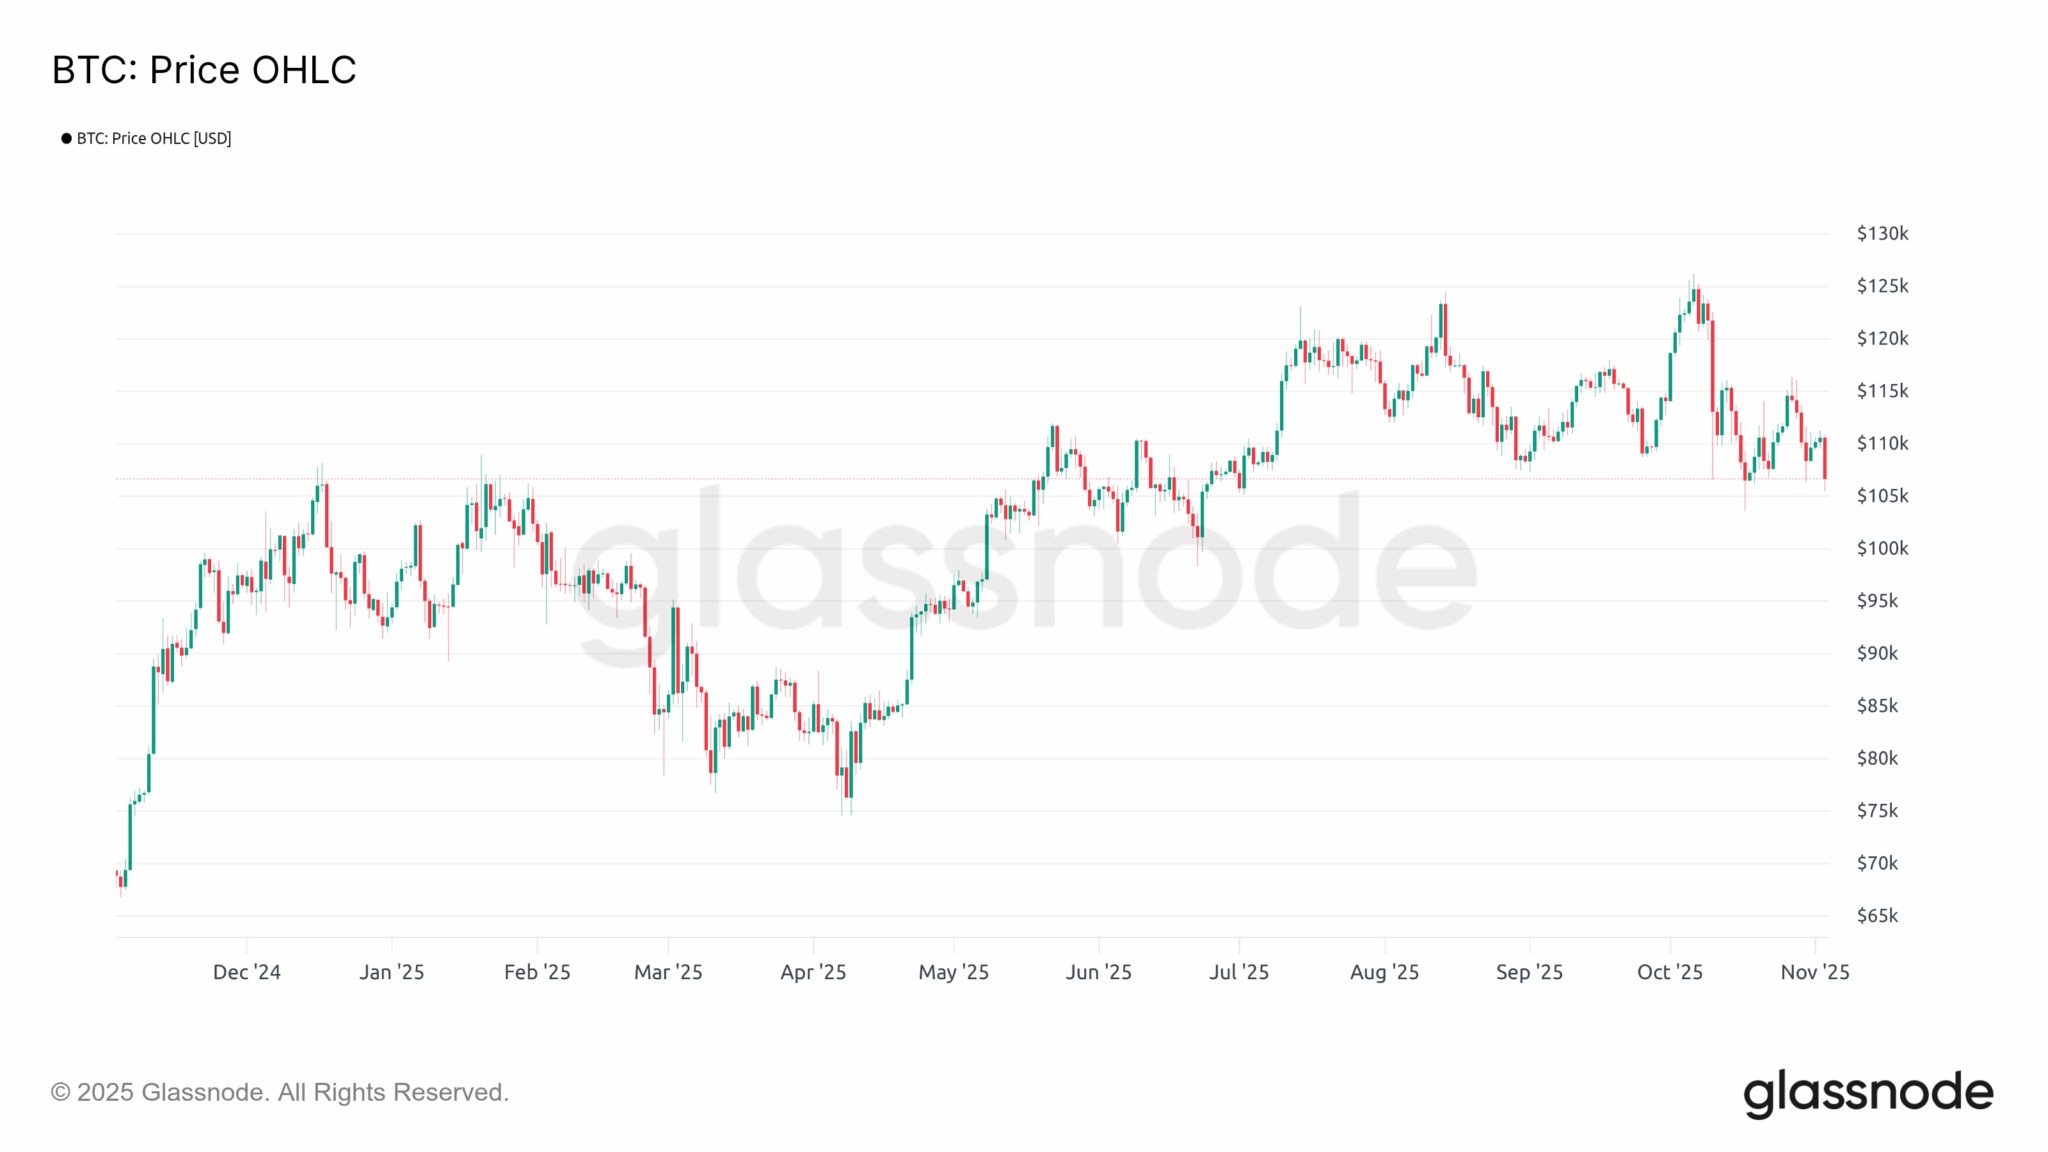
Figure 1: BTC Spot Price
Decline in on-chain activity
In our previous analysis, we identified early signs of a slowdown in the BTC market, notably a significant divergence between Bitcoin’s price and investors’ average unrealized returns.
Today, we examine metrics related to Bitcoin network usage to assess whether user activity and engagement levels are sending positive or concerning signals.
The following chart shows the number of BTC addresses that have conducted at least two valid transactions per day during the last three bull cycles.
While a parabolic growth in address activity is visible for the 2017 and 2021 bull cycles, the current trend resembles a gradual slowdown.
This striking contrast suggests that participant engagement and activity have been particularly low since 2024. It also signals a loss of interest in traditional Bitcoin use cases and a shift in trading activity toward off-chain platforms (centralized exchanges), such as derivatives markets.
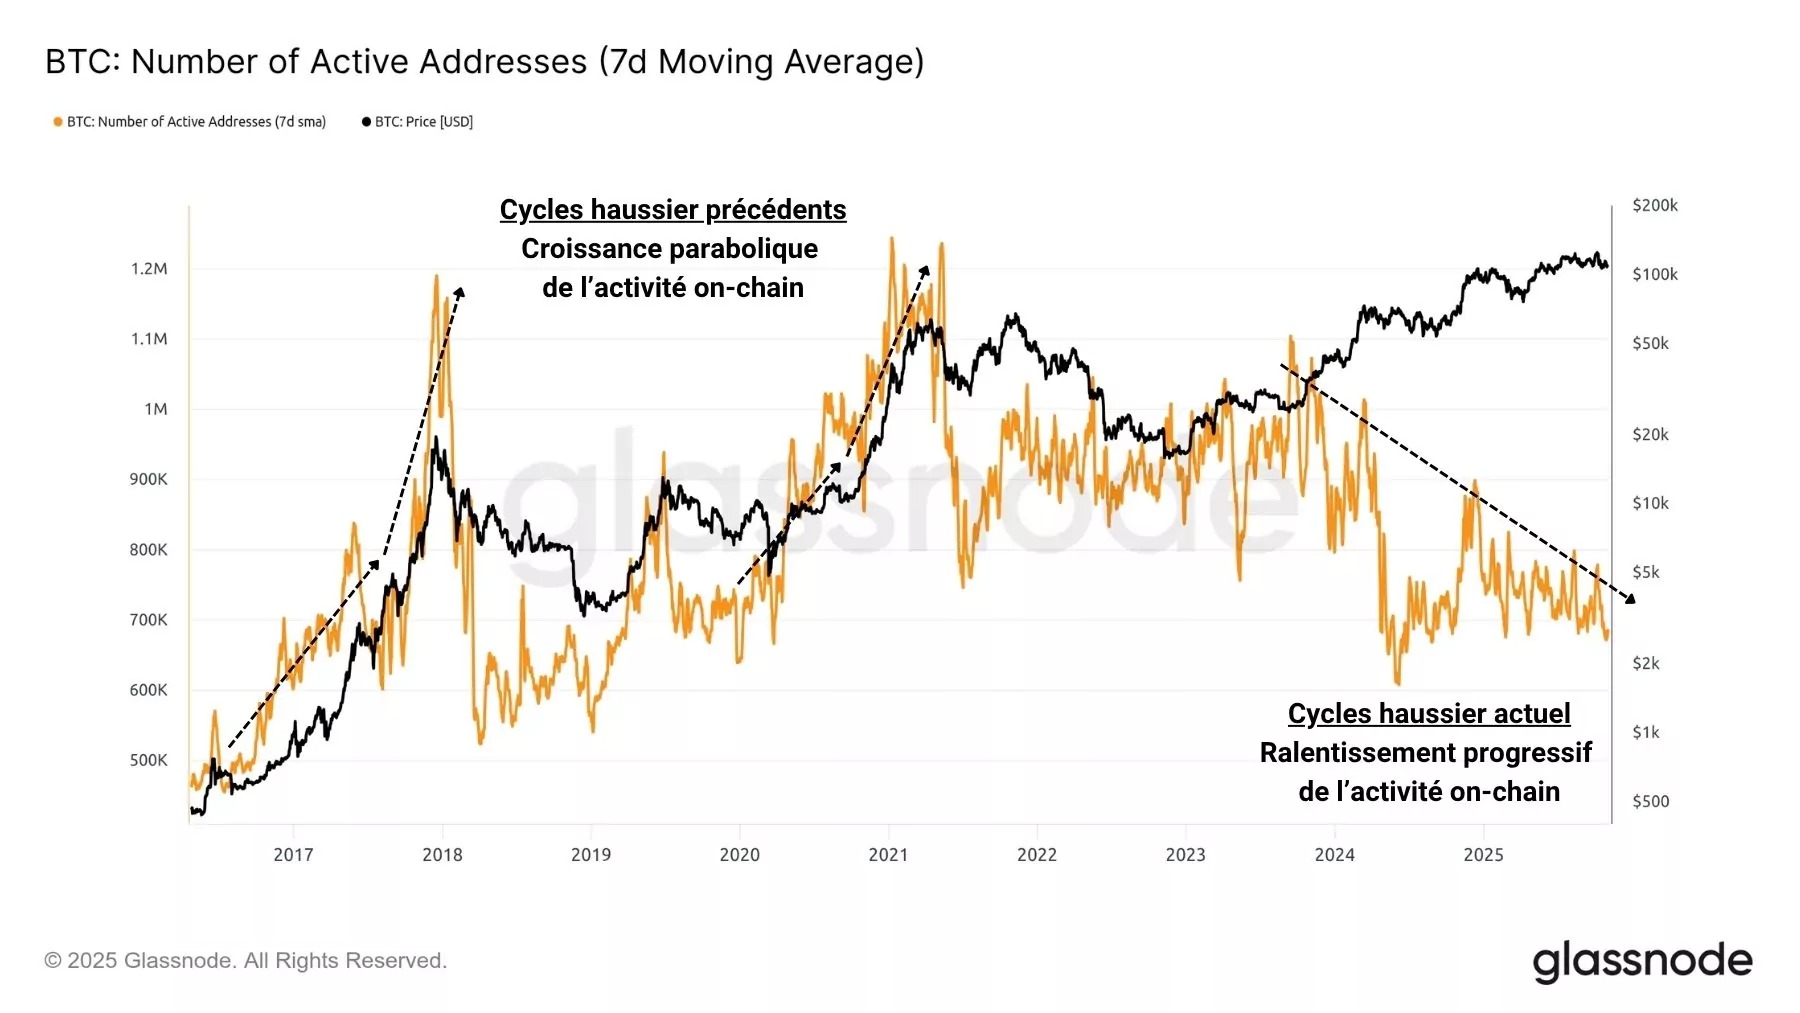
Figure 2: Number of active addresses
A similar observation can be made regarding the metric of the number of new addresses created per day. Here again, a major difference is evident between the dynamics of past cycles and the current context.
Since the creation of new addresses is generally associated with transactional demand, a stagnation in this metric indicates reduced network usage and a lack of interest among its users.
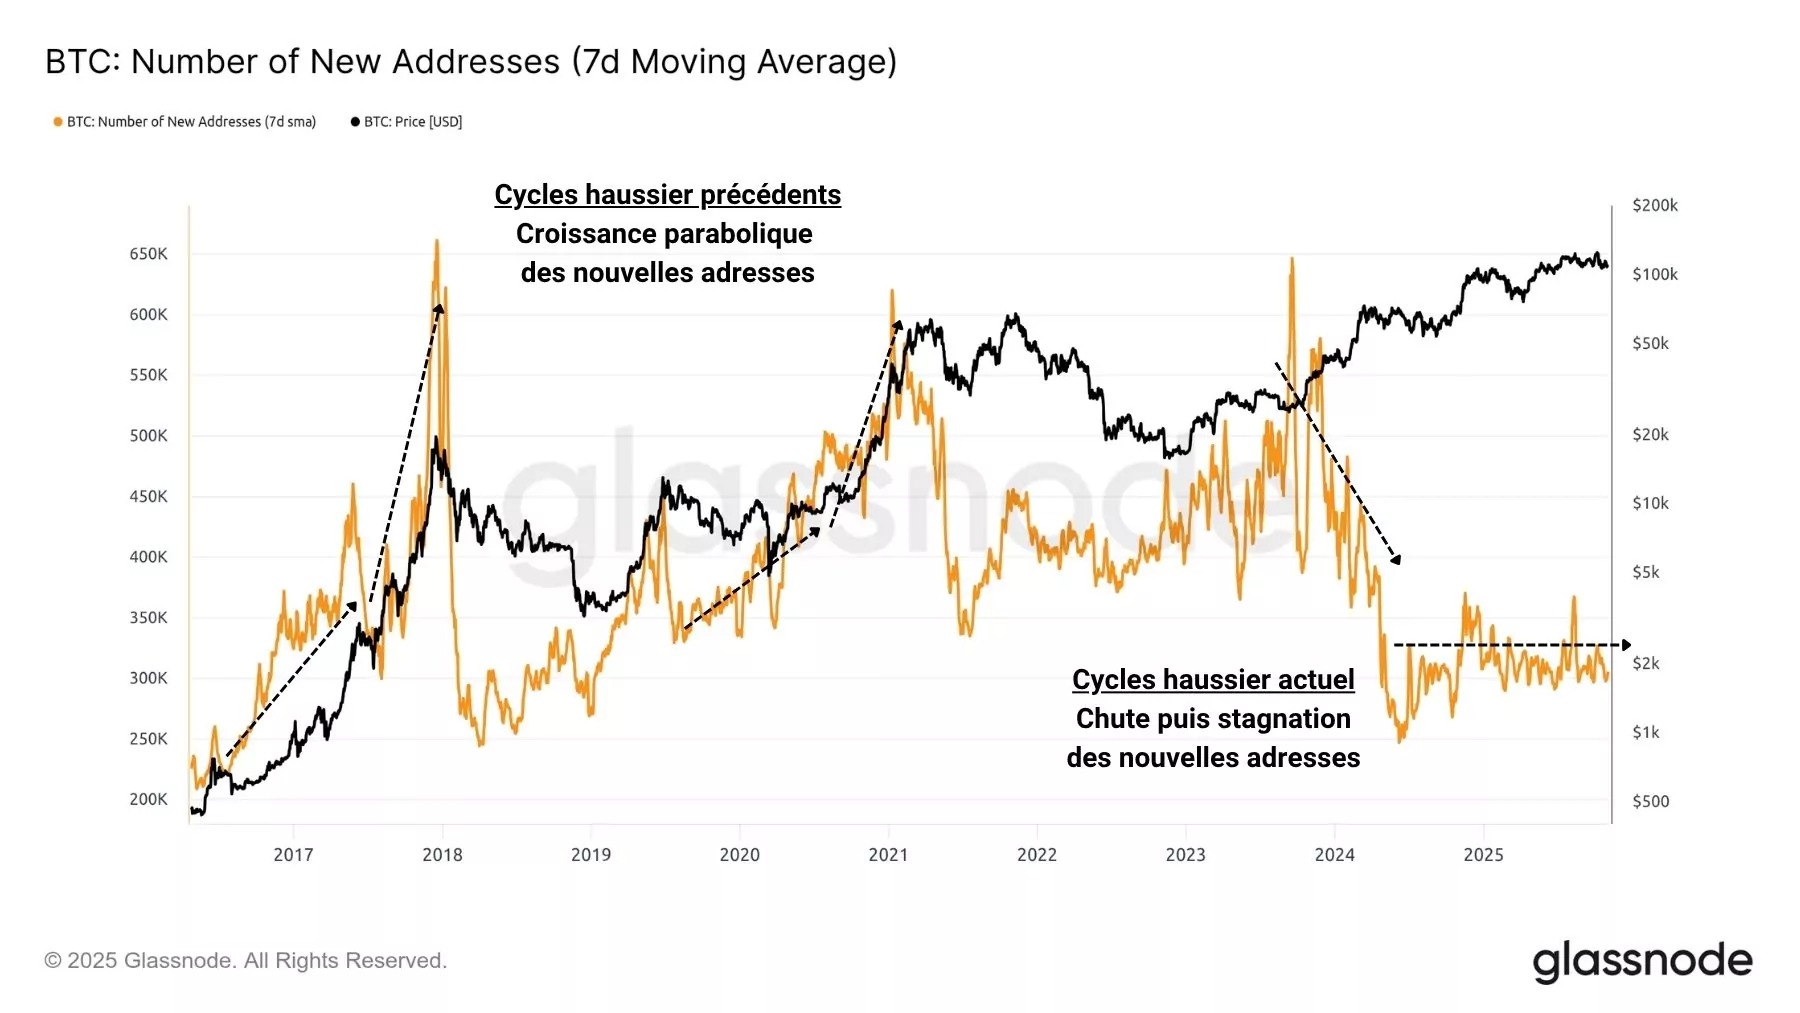
Figure 3: Number of new active addresses created
The situation is even more striking when observing the state of the mempool, the waiting room where transactions that have not yet been included in a block are held.
While the mempool experienced several waves of high transaction demand between 2023 and 2024—notably due to the craze sparked by Inscriptions/Ordinals and, later, Runes—nothing of the sort is visible at present.
Today, the mempool is virtually empty and transaction fees have plummeted, evidence that demand for block space has collapsed compared to previous years.
In fact, Bitcoin network users are less active, whether transferring funds between entities or storing arbitrary data on the blockchain.
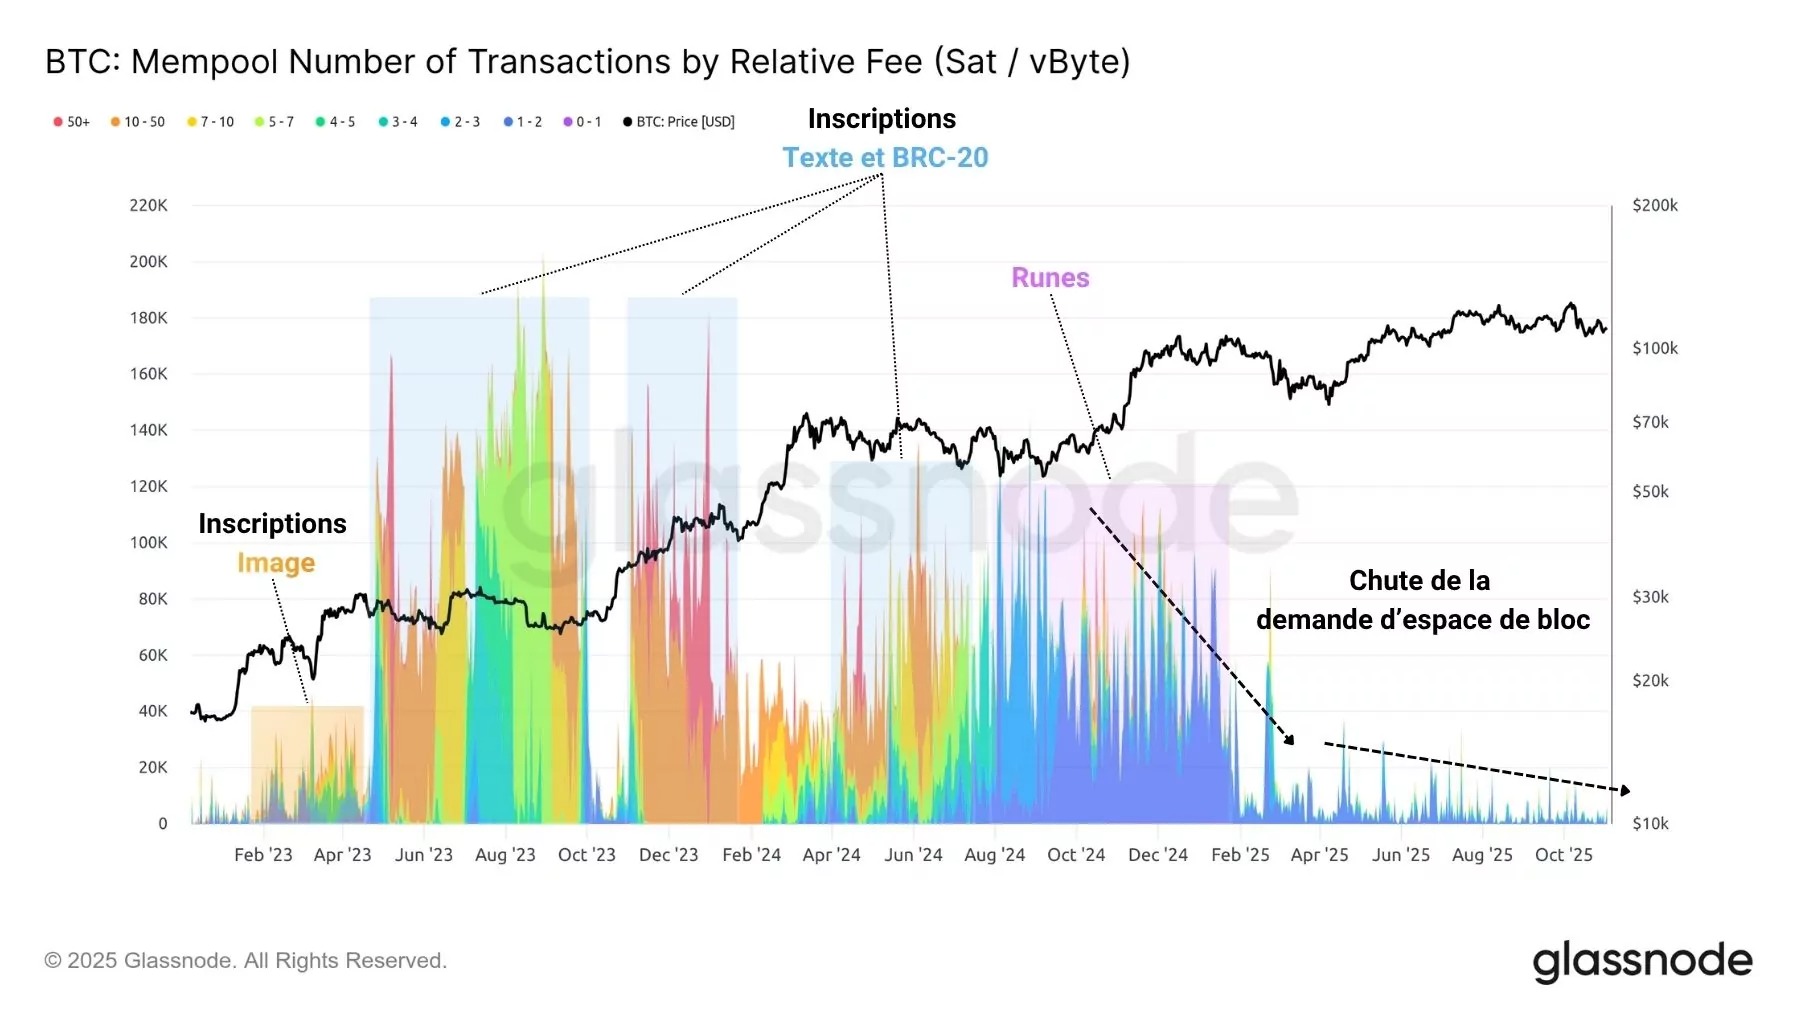
Figure 4: Number of pending transactions in the mempool
The chart below measures the distribution of transactions based on their dollar value, adding a new essential dimension to the previous findings.
Since the cyclical trough at the end of 2022, we have observed a significant increase in the share of transactions exceeding $1 million in volume.
While these transactions accounted for between 40% and 50% of total trading volume in early 2017, they now account for over 70% of daily transfers.
This suggests that the market is attracting more and more institutional capital and that BTC investment and trading are becoming more professional as the bridge between traditional finance and the cryptocurrency sector widens.
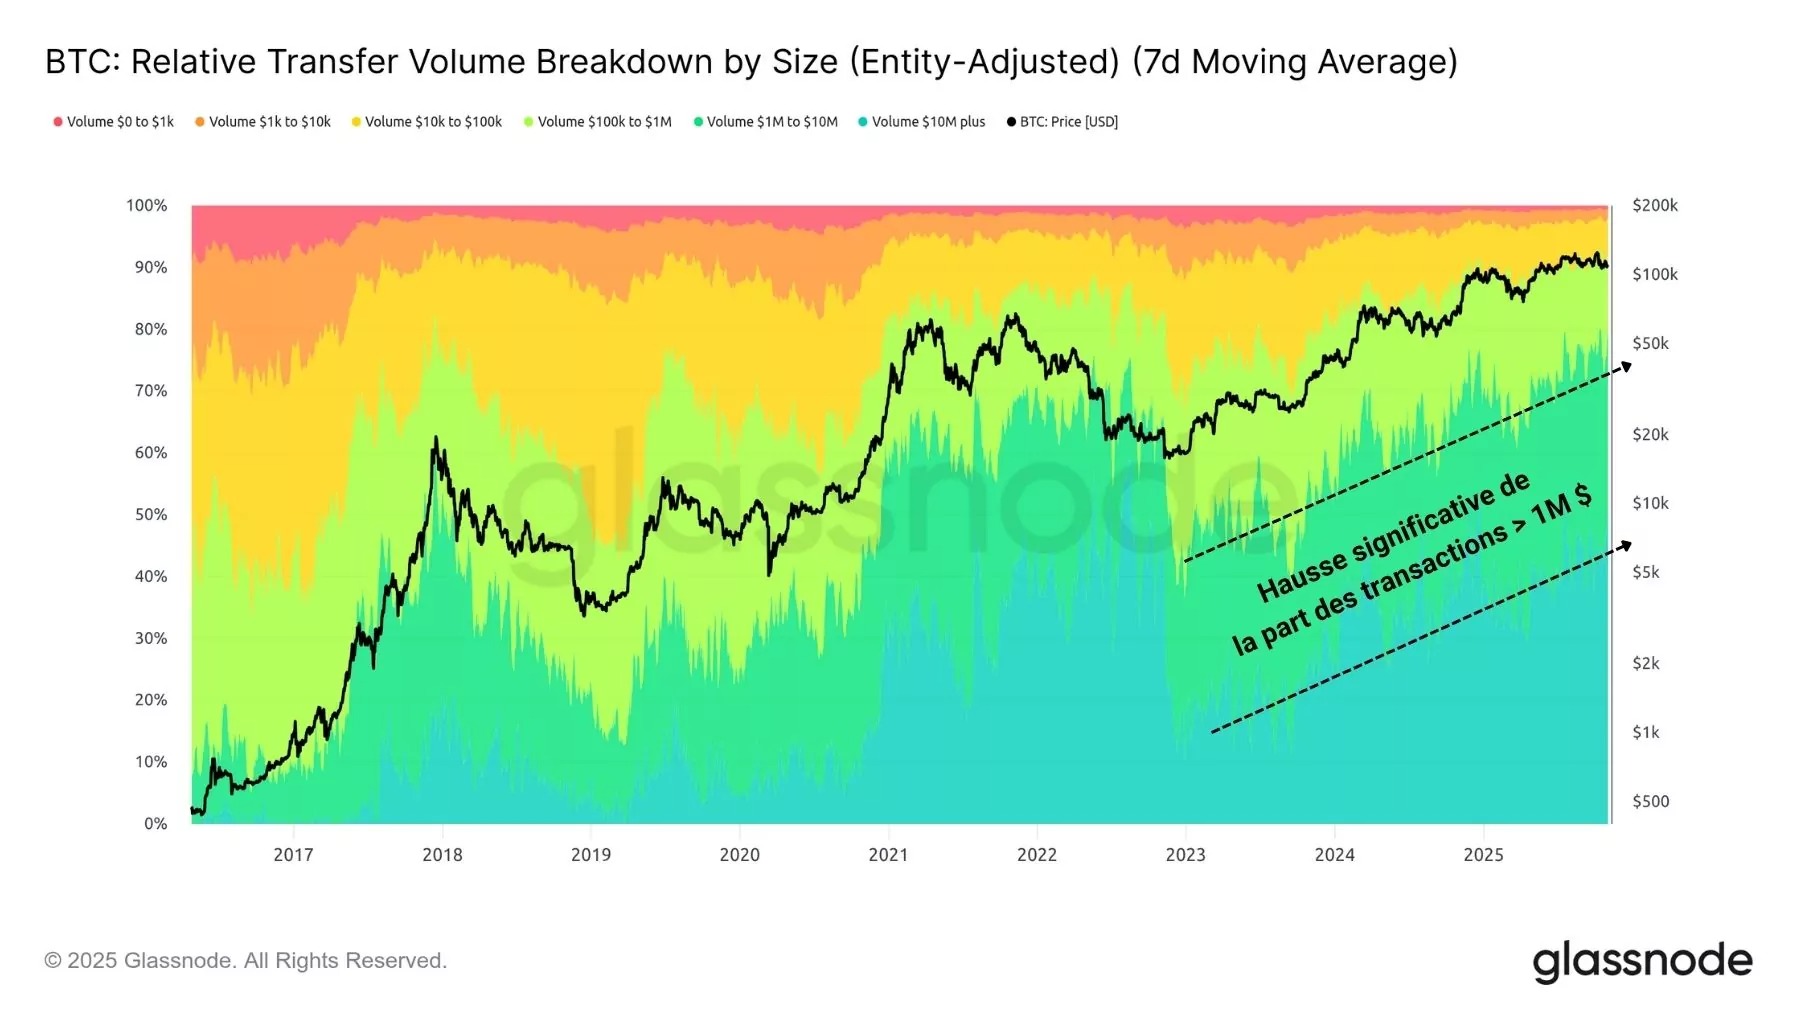
Figure 5: Transfer Volume by Transaction Size
Distribution Dominates
While BTC’s on-chain activity is visibly slowing down, it is essential to ask what the dominant behavior of transactions remaining on the network is.
The following metric measures the age distribution of spending to estimate whether the dominant behavior is saving or spending over a given period.
As in most bull cycles, this indicator signals that significant volumes of BTC are currently being moved, indicating that investors are spending more than they are saving.
This behavior is typical of the final stages of bull markets, where investors take profits during price surges, increasing selling pressure that causes the price to fall during a correction phase.
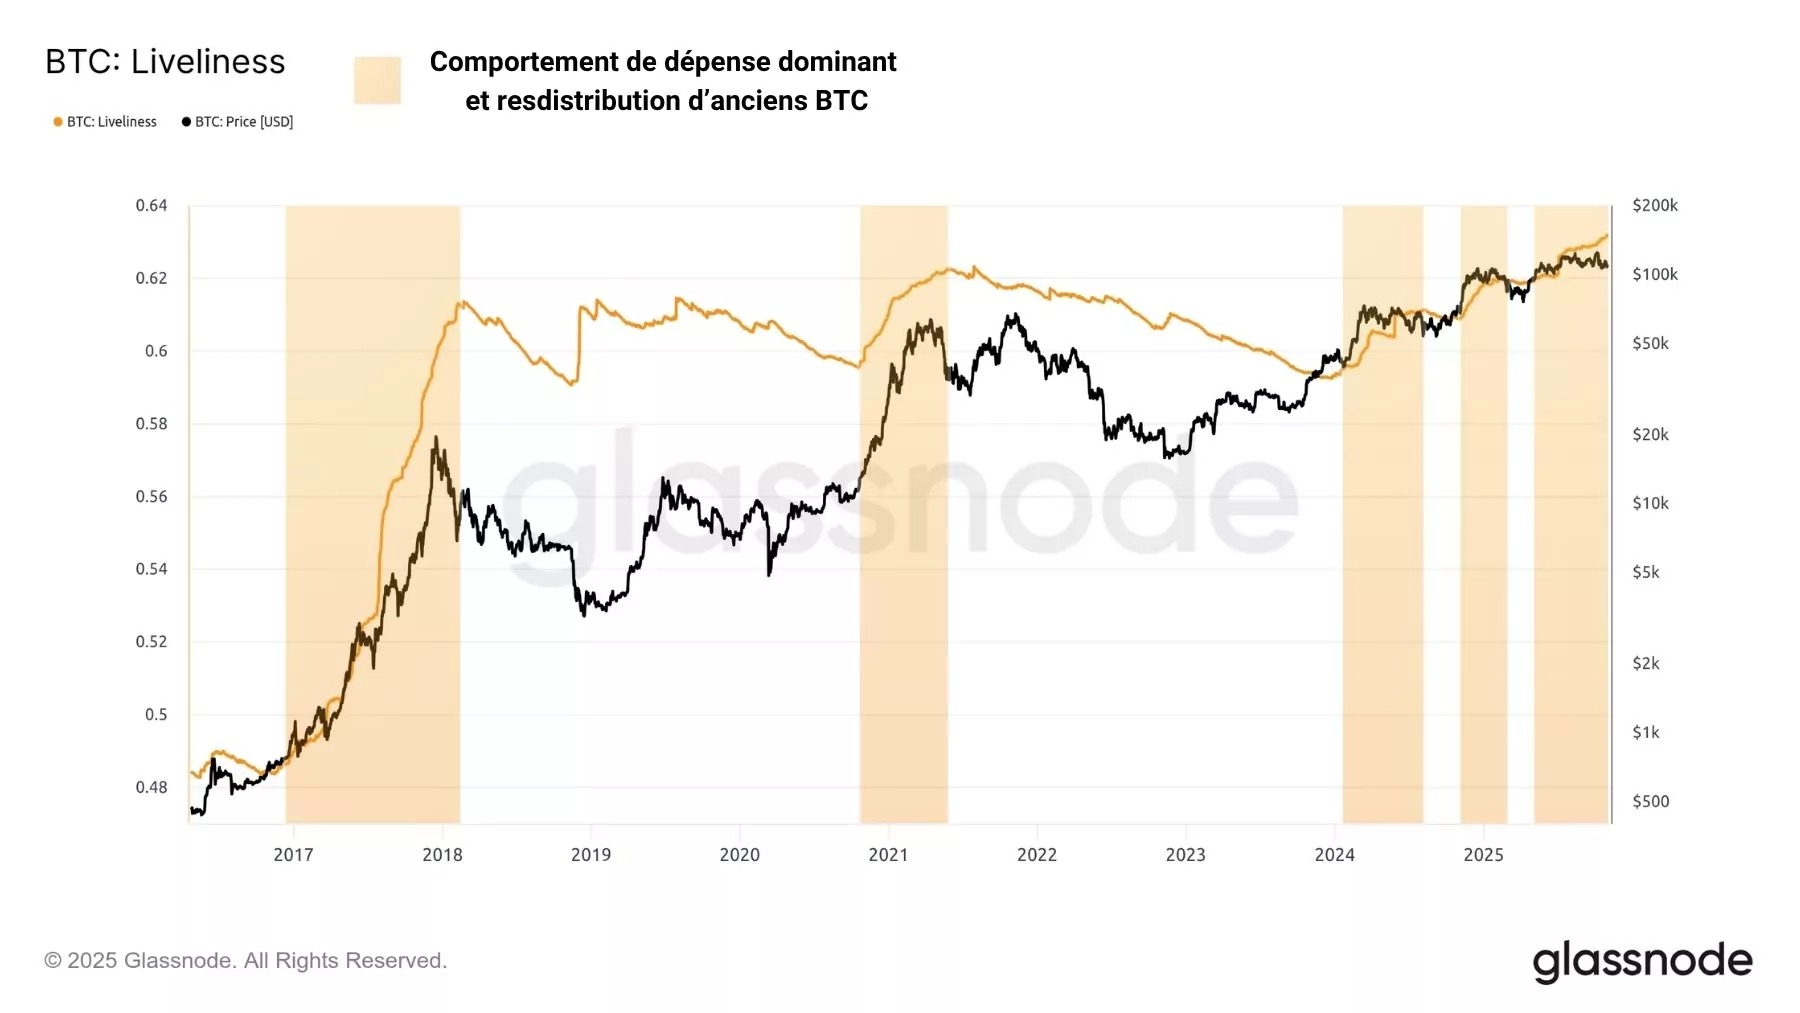
Figure 6: BTC Activity
To delve deeper, the indicator below measures the intensity of investor spending behavior to estimate the pressure weighing on the market at a given point in time.
The Bitcoin market has recently exhibited statistically high spending activity, as was the case during the previous local peaks of 2024, or the cyclical peaks of previous bull markets.
Significant demand will therefore be required to absorb the selling pressure currently weighing on the market.
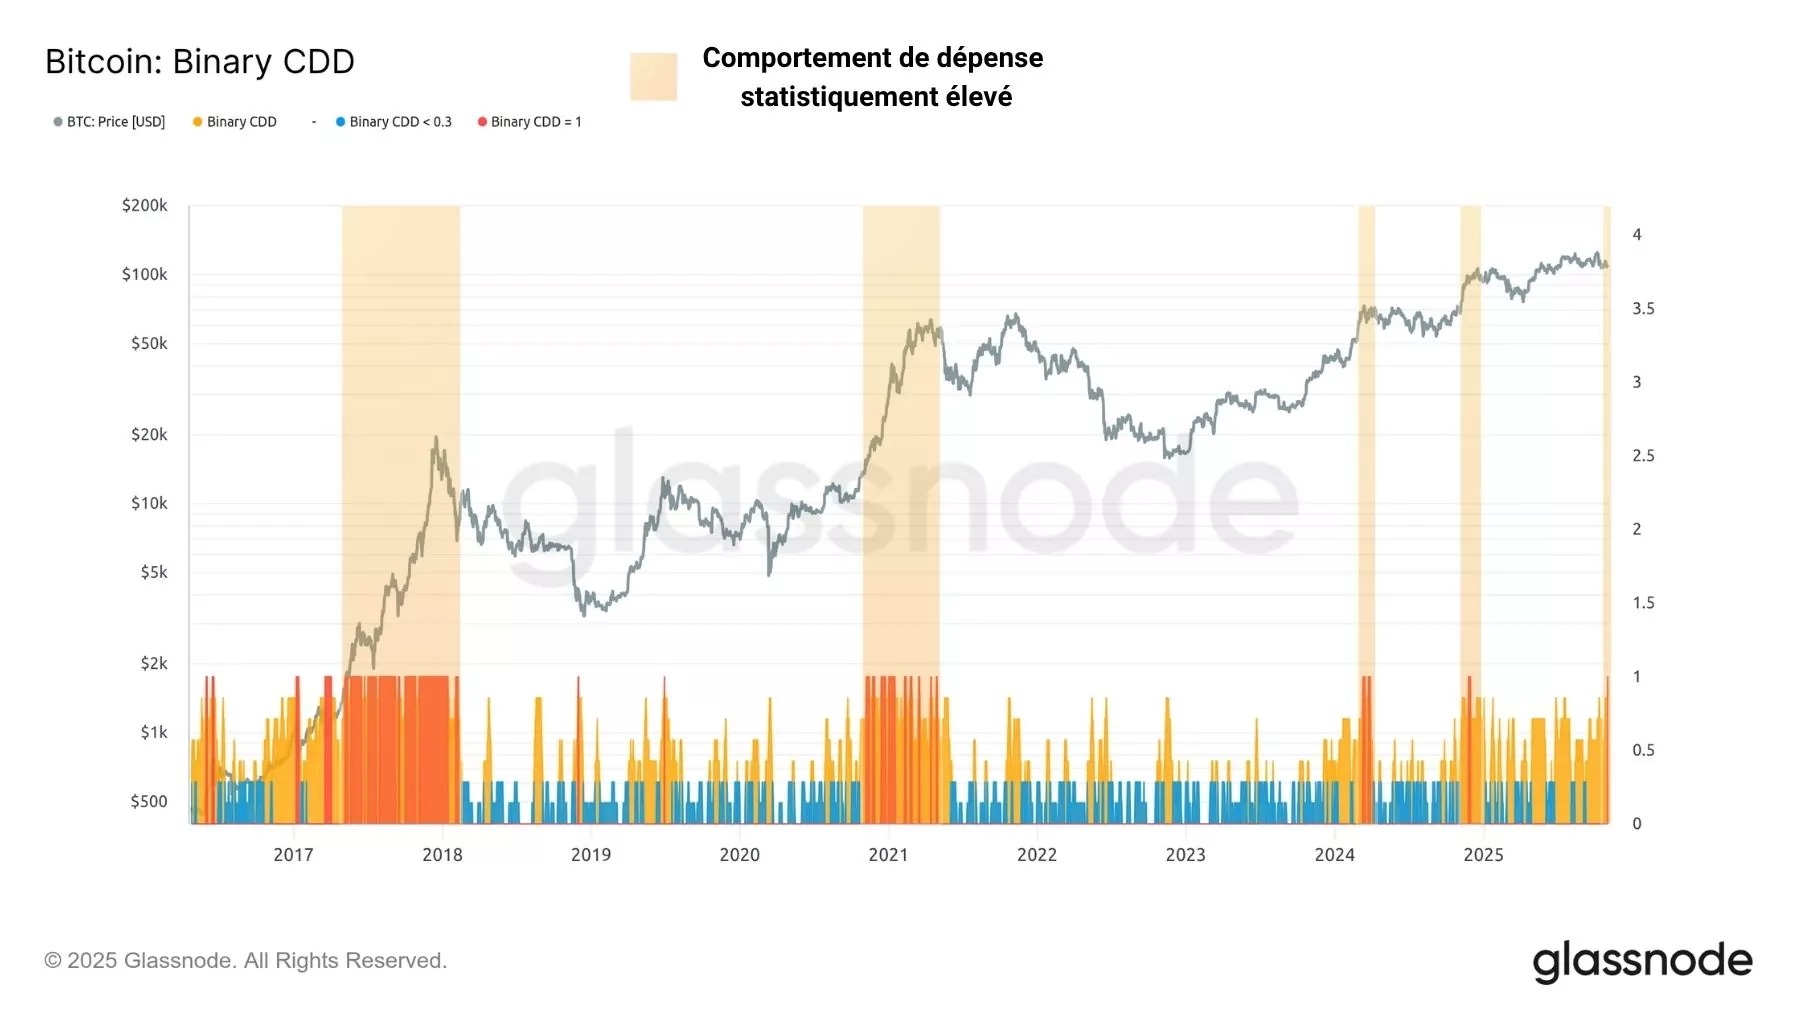
Figure 7: BTC Binary Spending Indicator
Summary of this on-chain analysis of Bitcoin
Ultimately, this week’s data indicates that engagement and activity among Bitcoin network users have been particularly low since 2024, with transactional demand now very weak.
As the mempool empties, a shift in trading activity toward off-chain platforms, particularly derivatives markets, is one of the most plausible explanations for the current decline in activity.
The increase in transactions exceeding one million dollars confirms a clear trend: the market is shifting toward institutional capital, while retail investors are becoming scarcer.
Finally, the BTC market has recently exhibited statistically high spending activity. Significant demand will therefore be required to absorb the selling pressure weighing on order books.