
The Bitcoin price held the major support zone of $102,000/$106,000 in the second half of October, but this rebound on support is not enough to confirm that the $126,000 reached on Monday, October 6, is not the peak of the cycle. Holding support is good, breaking through resistance is better. Here is Vincent Ganne’s technical analysis of BTC.
The Bitcoin price has maintained its major support zone
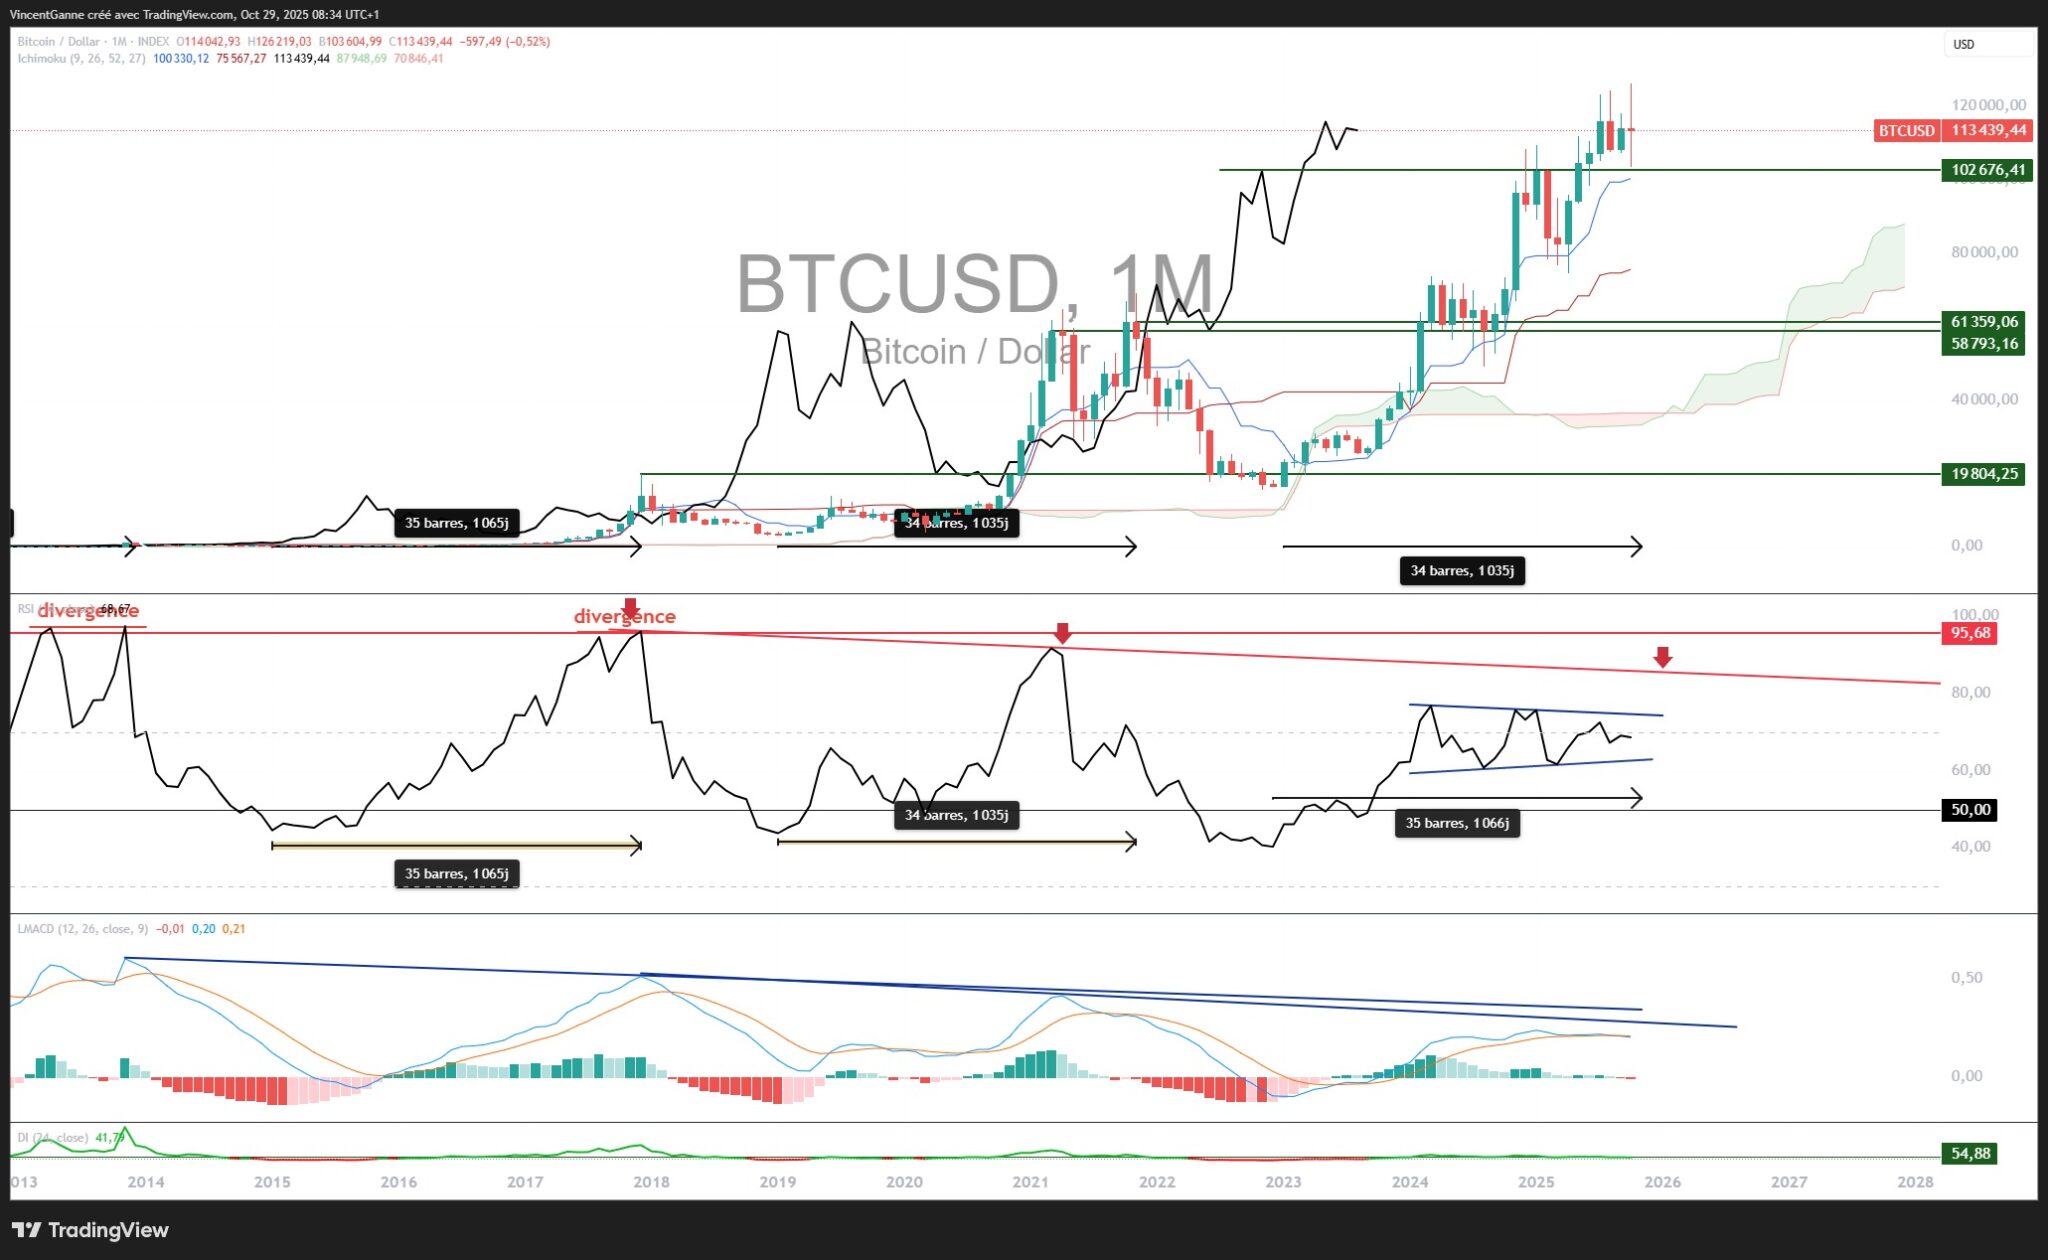
Potentially, the cycle has ended for Bitcoin since October 6, with a local peak at $126,000. It is still too early to say for sure, but several technical signals call for caution.
For now, the underlying trend remains bullish as long as the monthly support level of $102,000-$106,000 holds. Below that, we would enter a different dynamic, with the risk of a structural shift and a definitive entry into a cyclical bear market. But we are not there yet.
But it remains covered by extreme technical resistance
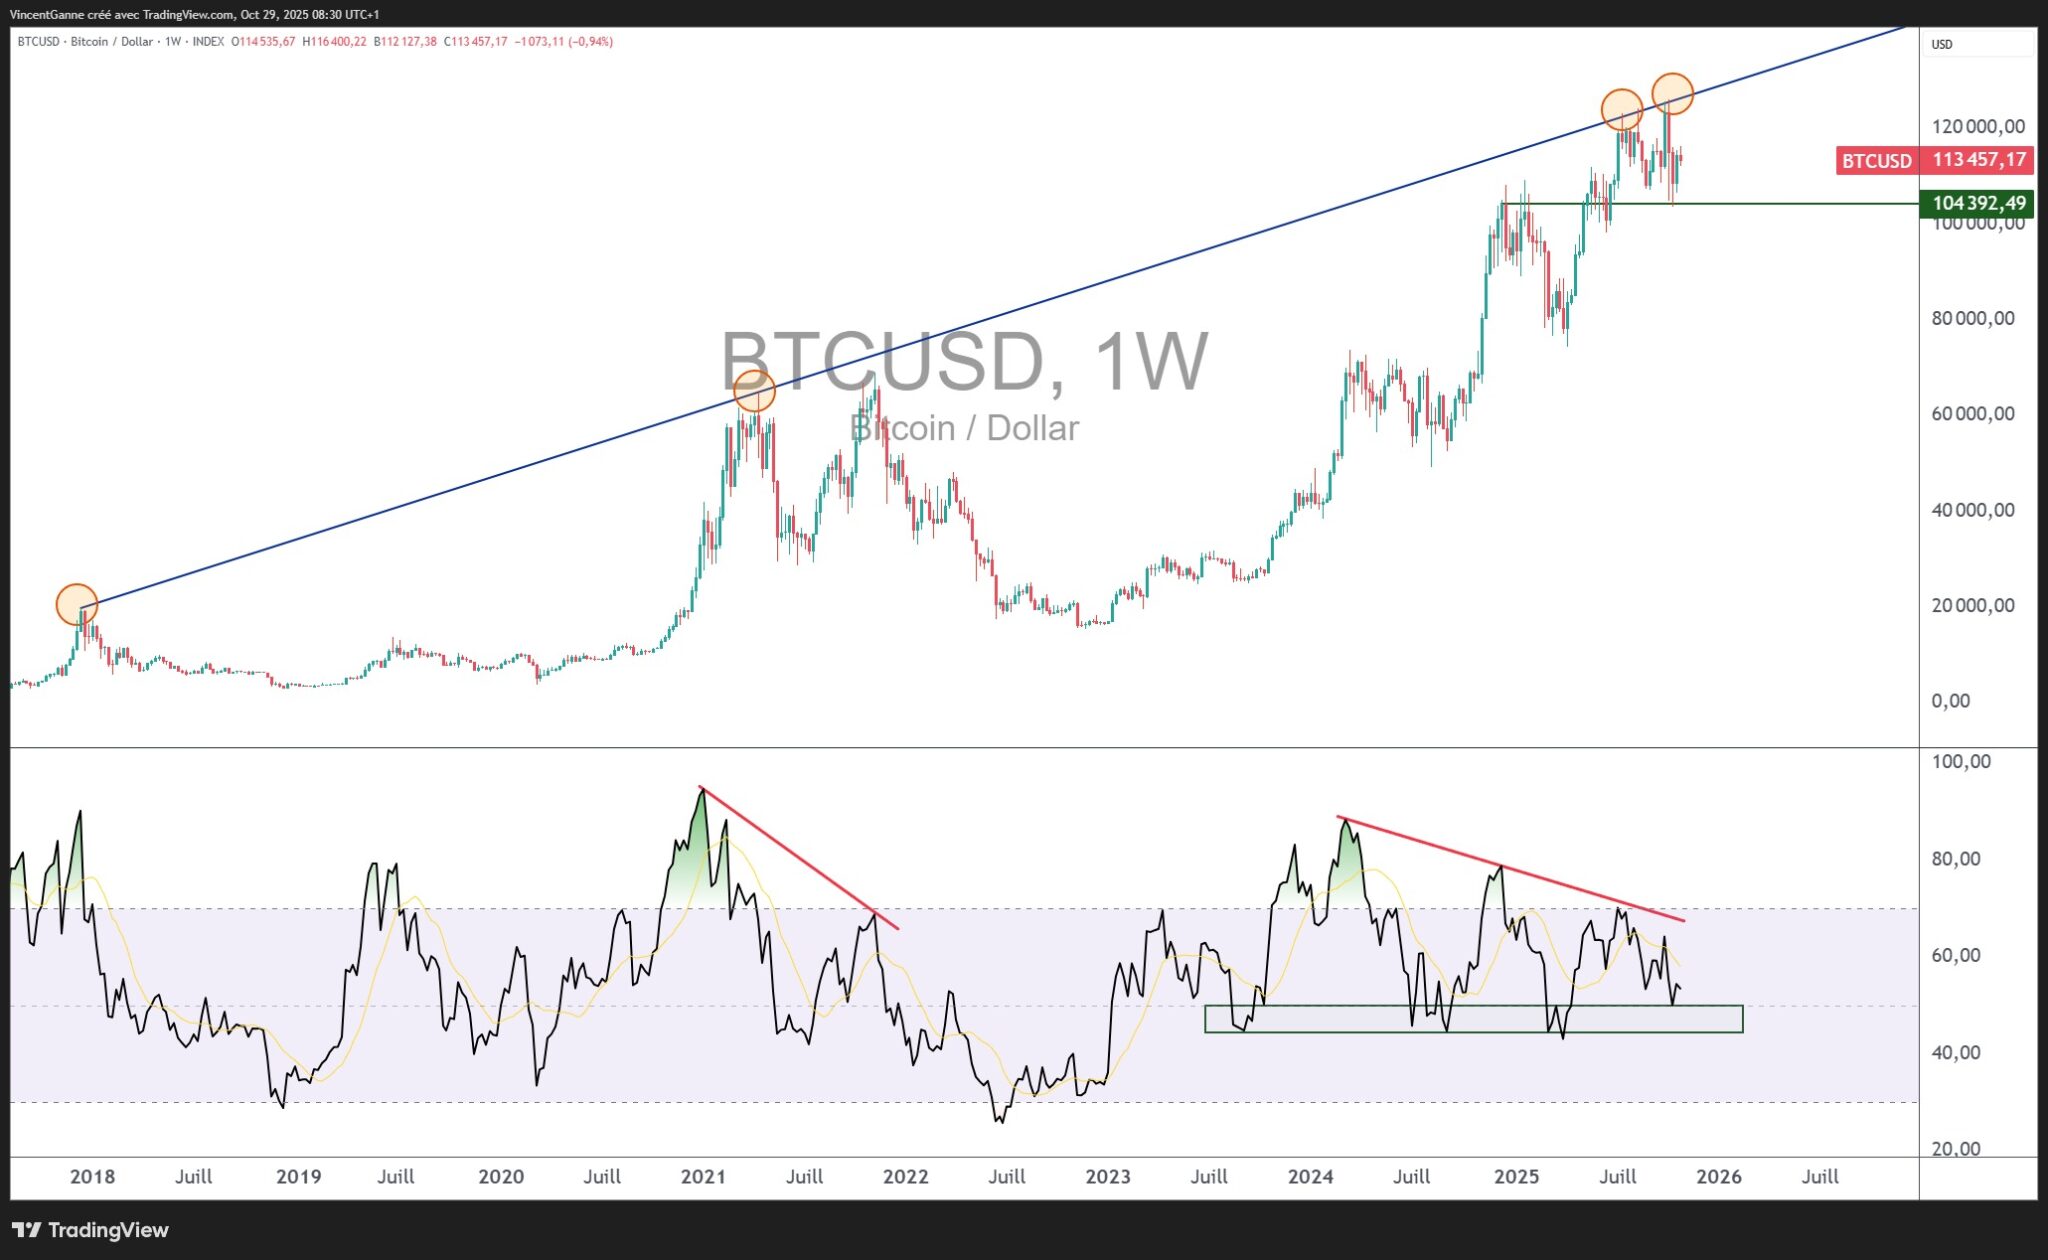
In the long term, there is one key element to watch: the large sloping resistance line that connects all the peaks over the last 10 years. This historical trendline passes precisely through the $126,000 zone. The rejection observed in early October is therefore not insignificant, as it corresponds to a major point of convergence between technical and cyclical factors.
Each previous peak (2013, 2017, 2021) formed close to this same resistance level. This is what makes the current configuration particularly interesting: either the market manages to break through this line to validate an unprecedented bullish extension of the cycle, or we enter a long-term distribution phase.
The BTC/GOLD ratio and global M2 liquidity provide support
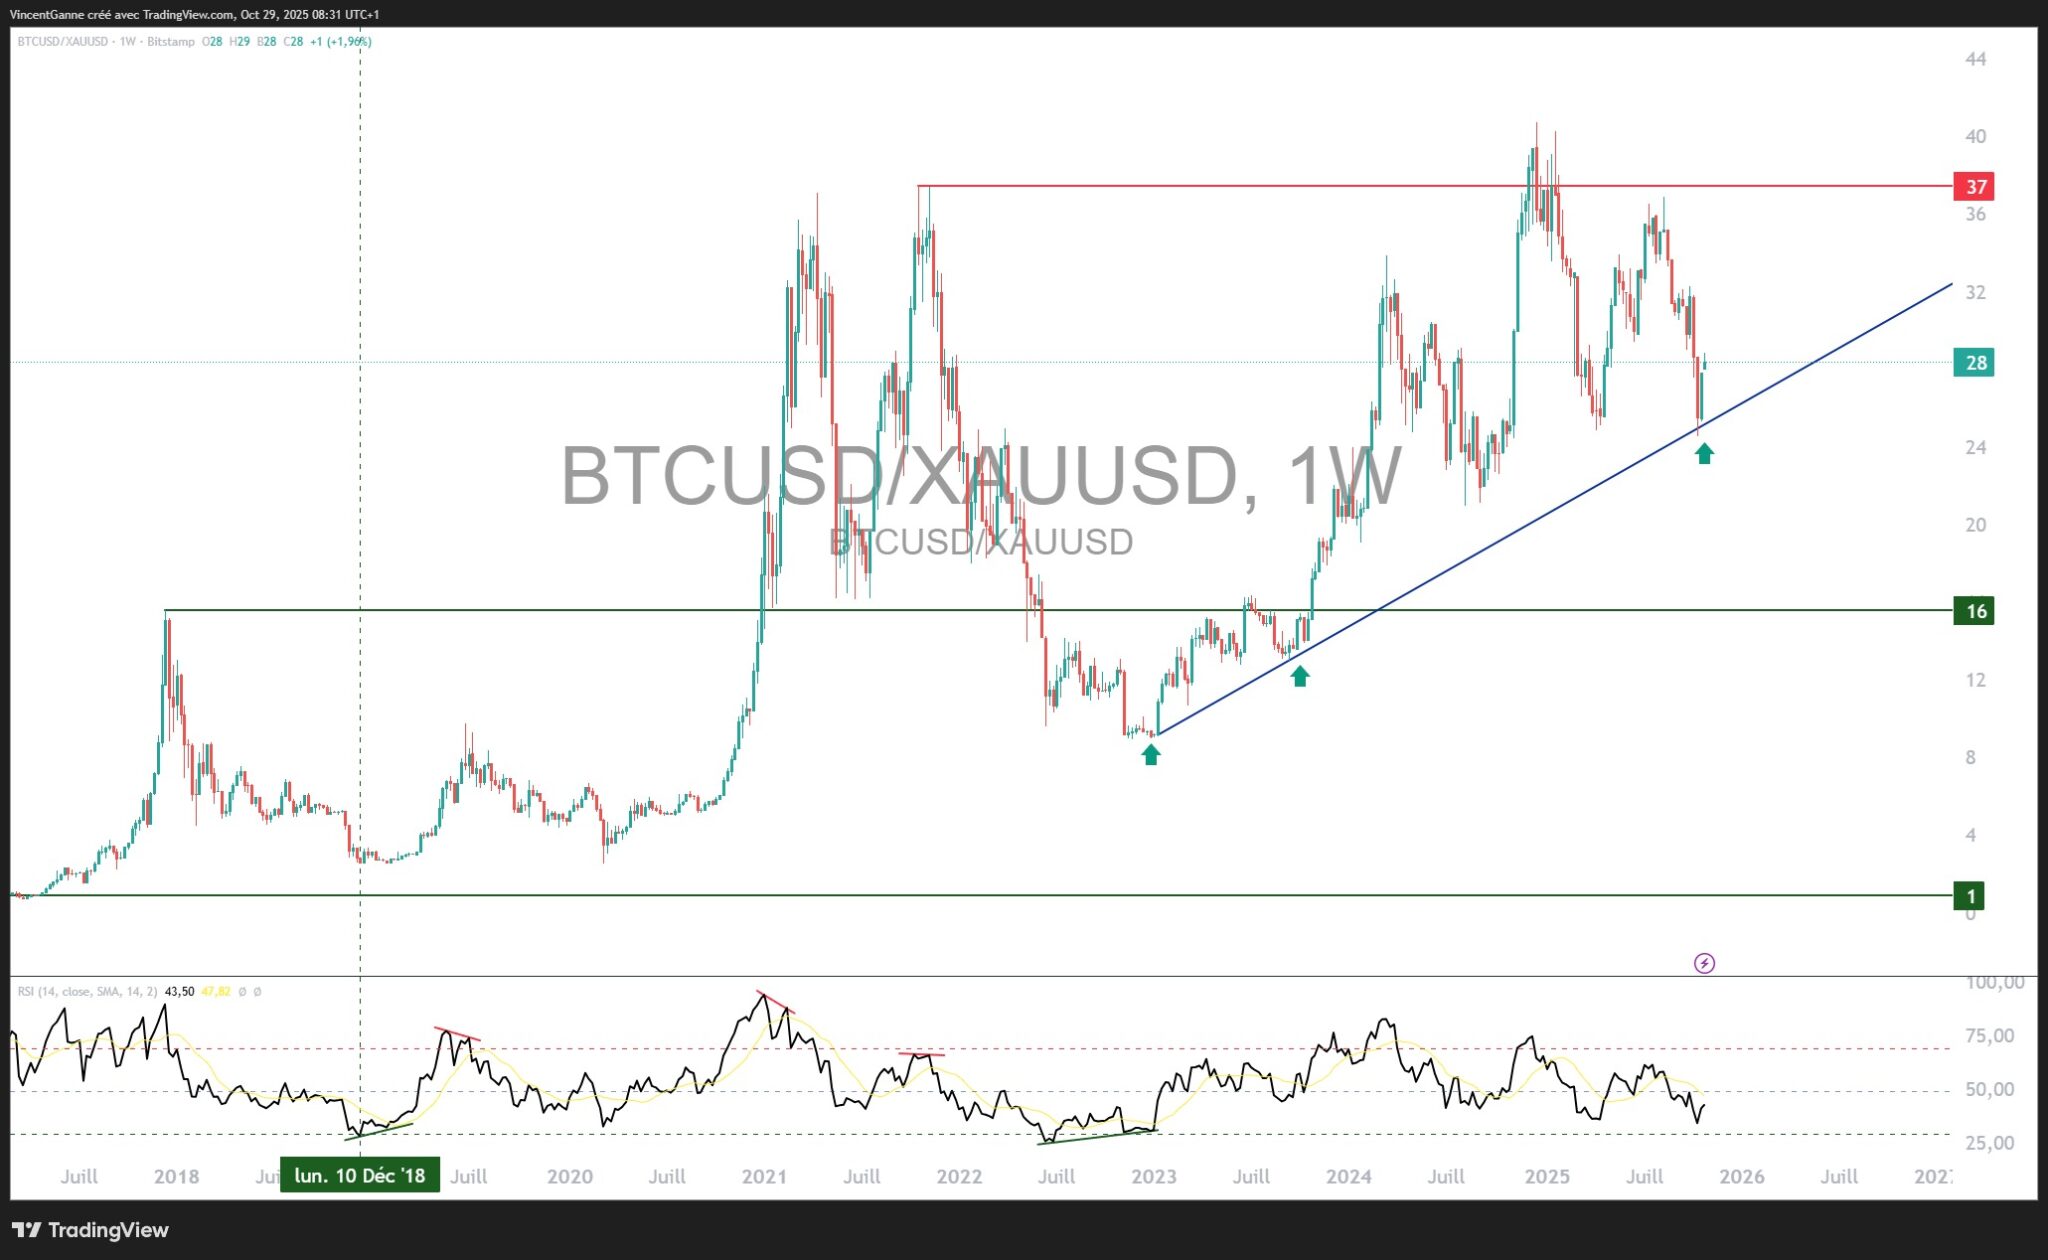
There is a supporting factor in terms of arbitrage between asset classes. The BTC/GOLD ratio has returned to test a long-term support level, a key level that has historically marked the end of consolidation phases before periods of expansion.
As long as this ratio does not break down, the relative momentum of the Bitcoin price against gold remains favorable. In other words, even if BTC consolidates, it still retains a macro dynamic superior to that of safe-haven assets.
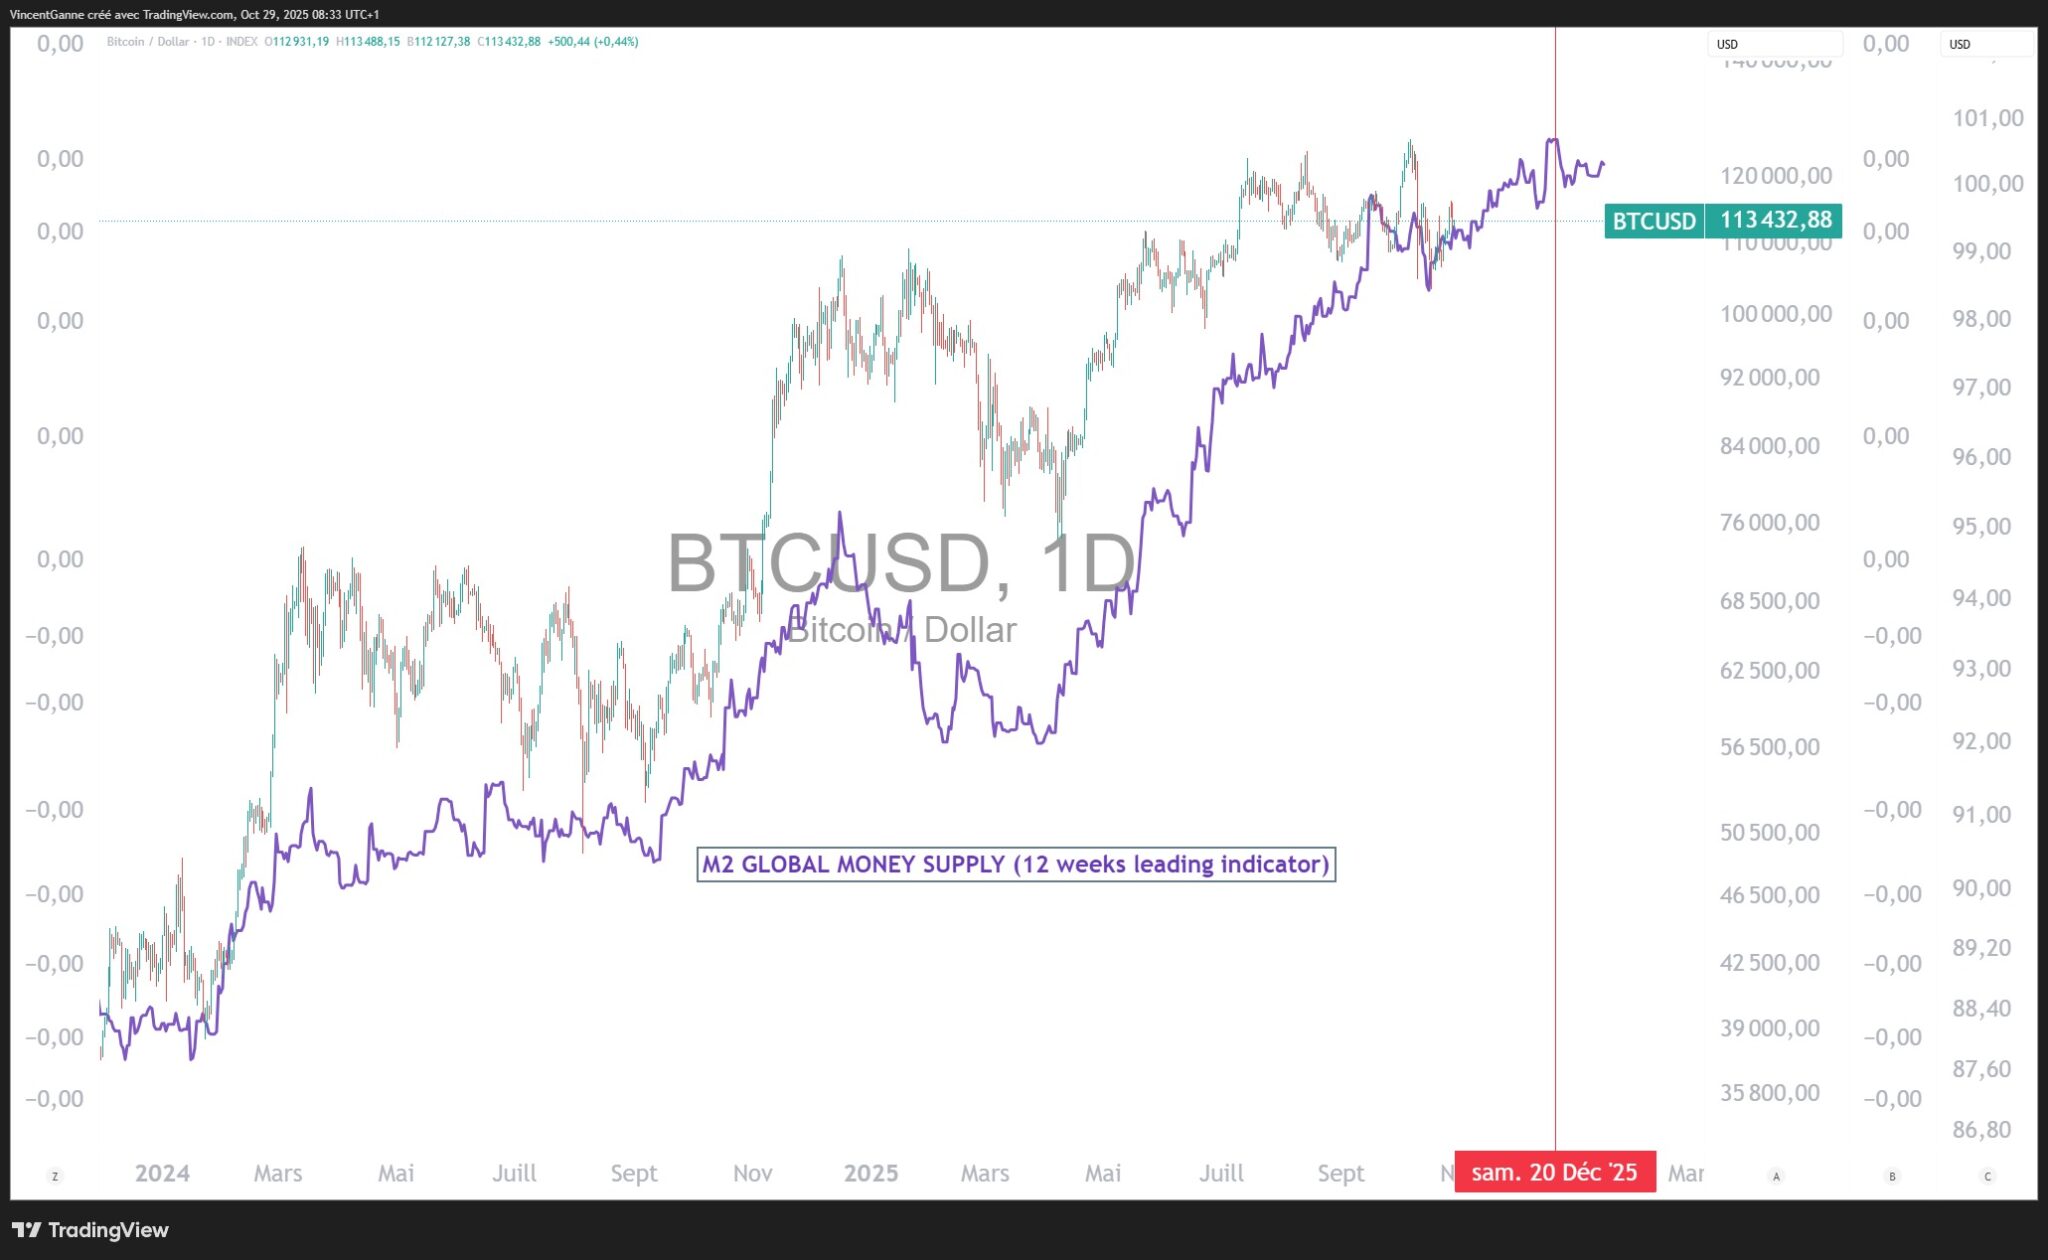
Another important factor is global liquidity (M2), which remains in an expansionary phase until the end of the year as a leading indicator with a 12-week time projection.
This parameter is often underestimated, but it plays a decisive role in risky asset cycles. As long as net money creation remains positive, Bitcoin corrections tend to be absorbed quickly. The market remains buoyed by excess liquidity, and structural demand continues to grow, particularly through institutional flows.
In summary, we are probably at a turning point in the cycle. Technically, the major resistance level of $126,000 may mark a temporary or even cyclical peak, but as long as the $100,000/$102,000 level holds at the monthly close, the primary trend remains bullish. A clear break below this support level, on the other hand, would confirm the onset of a cyclical bear market.