
Although withdrawals have been available on Ethereum for several months, staking continues to grow in popularity with over 24 million ETH staked. Let’s take a look at some of the stats that show Ethereum is stronger than ever.
More than 24 million ETH are being staked on Ethereum
In a few weeks, it will be a year since Ethereum (ETH) moved away from Proof-of-Work (PoW) through The Merge, to a consensus based entirely on staking. While the quantities of ETH deposited in validators continue to grow, 20% is now used to secure the network.
While there are more than 120.21 million ETH in circulation, more than 24.2 million are staked on more than 756,600 validators:
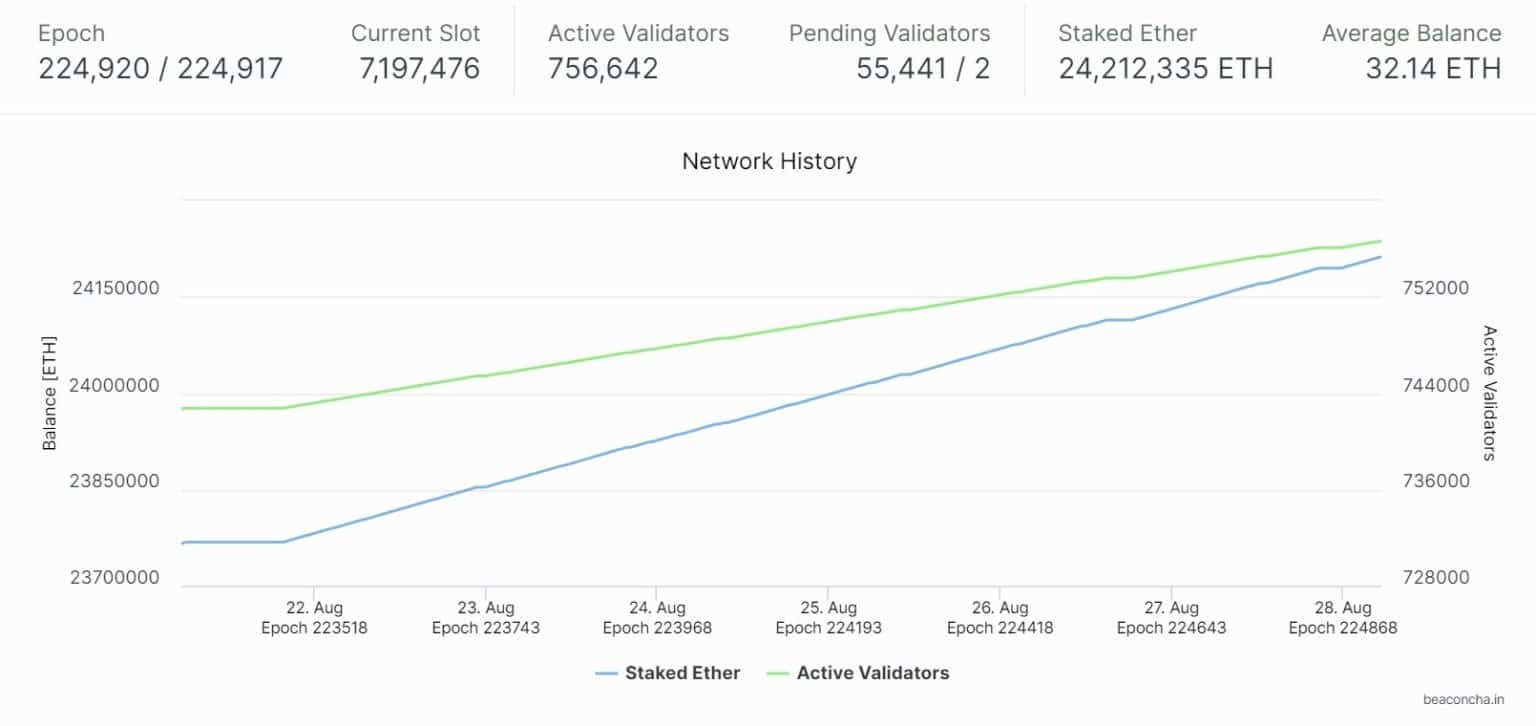
Figure 1: Ethereum staking statistics
At the same time, we can see that more than 55,000 validators are waiting to be validated, while almost none of them are looking to exit, despite the possibility of doing so since the Shapella update last spring.
By way of illustration, ETH staking yields 3.7% interest per annum via Lido. Despite a particularly quiet market in recent months, it is interesting to note the interest in the Proof-of-Stake (PoS) model. Indeed, since Shapella, we have seen a sharp acceleration of almost 35% in the number of validators:
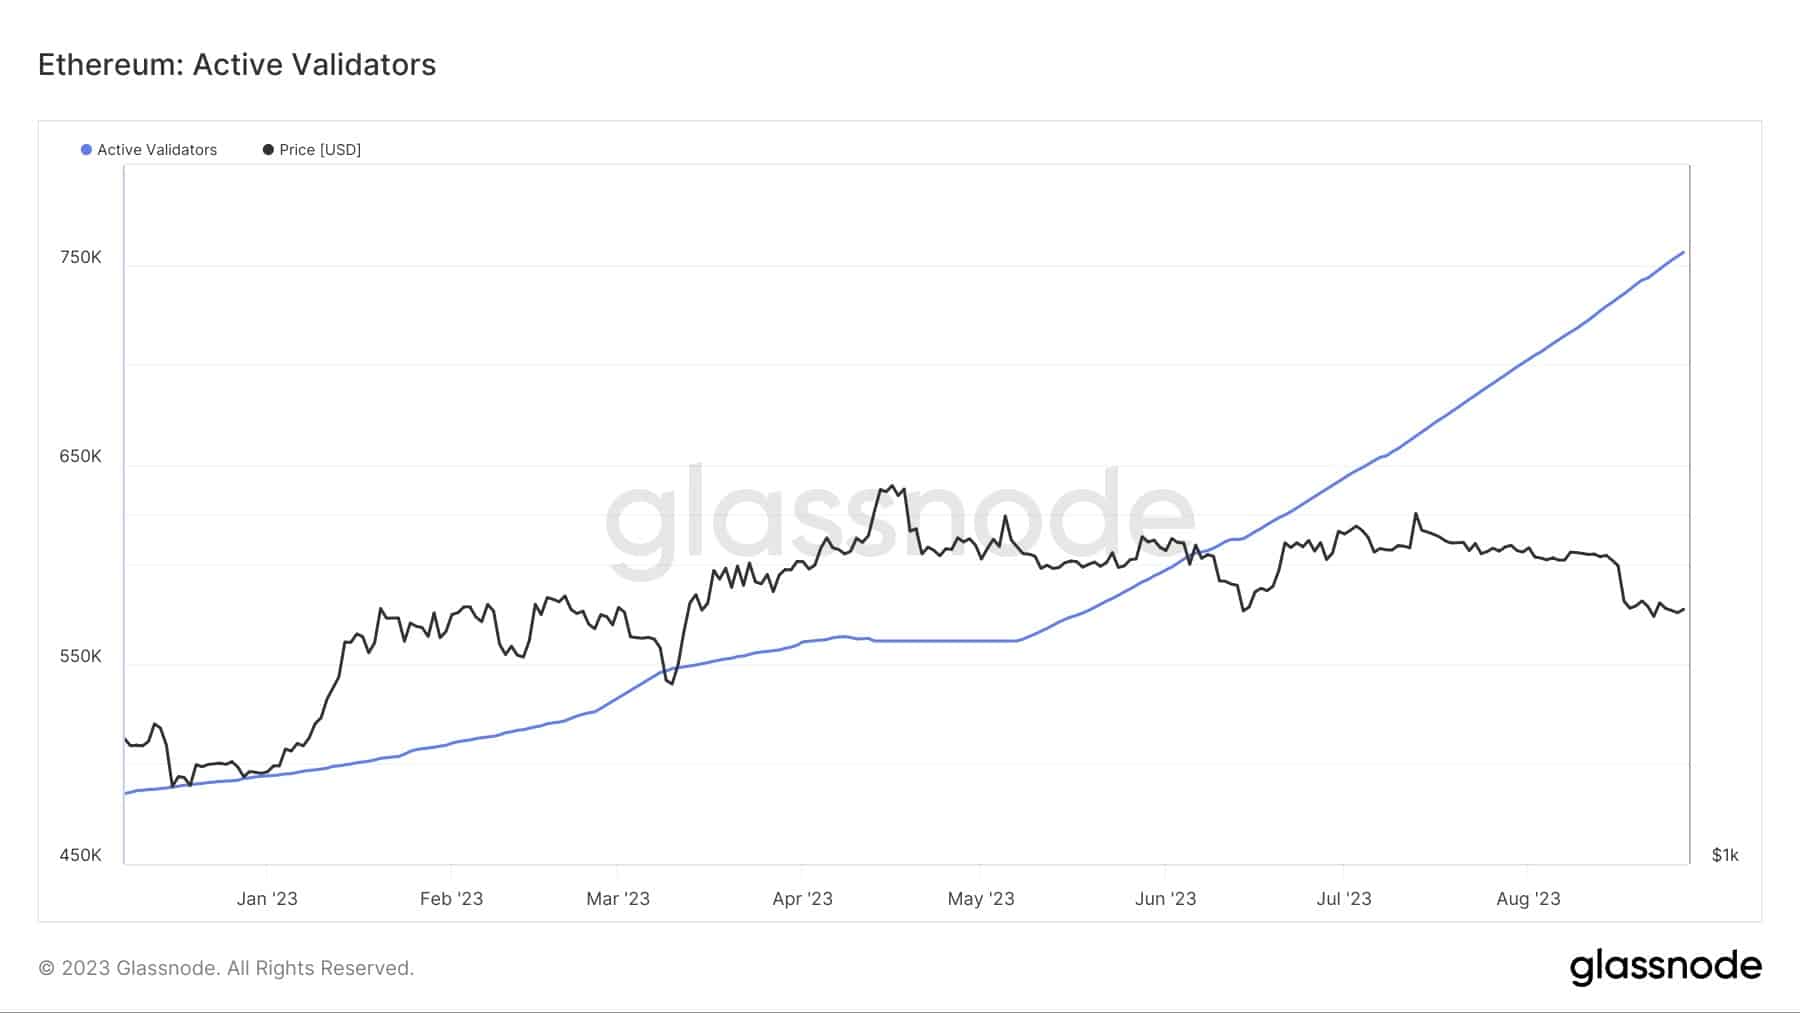
Figure 2 – Evolution of the number of validators on Ethereum over the last 12 months
Network activity contrasts with popularity of staking
While the popularity of staking is a particularly encouraging sign from a long-term perspective, a short-term view shows signs of a slowdown in on-chain activity on Ethereum. In reality, this calm is part of an overall trend in the cryptocurrency market.
Over the past 12 months, the number of daily transactions on Ethereum has remained relatively stable, with a mid-point of around one million per day. However, a fall in the average price of fees suggests that simple transactions have taken precedence over more gas-intensive transactions.
At $3.14, the average price of a transaction has returned to January levels, a far cry from the $27.62 of 5 May, caused by the euphoria surrounding the PEPE token :
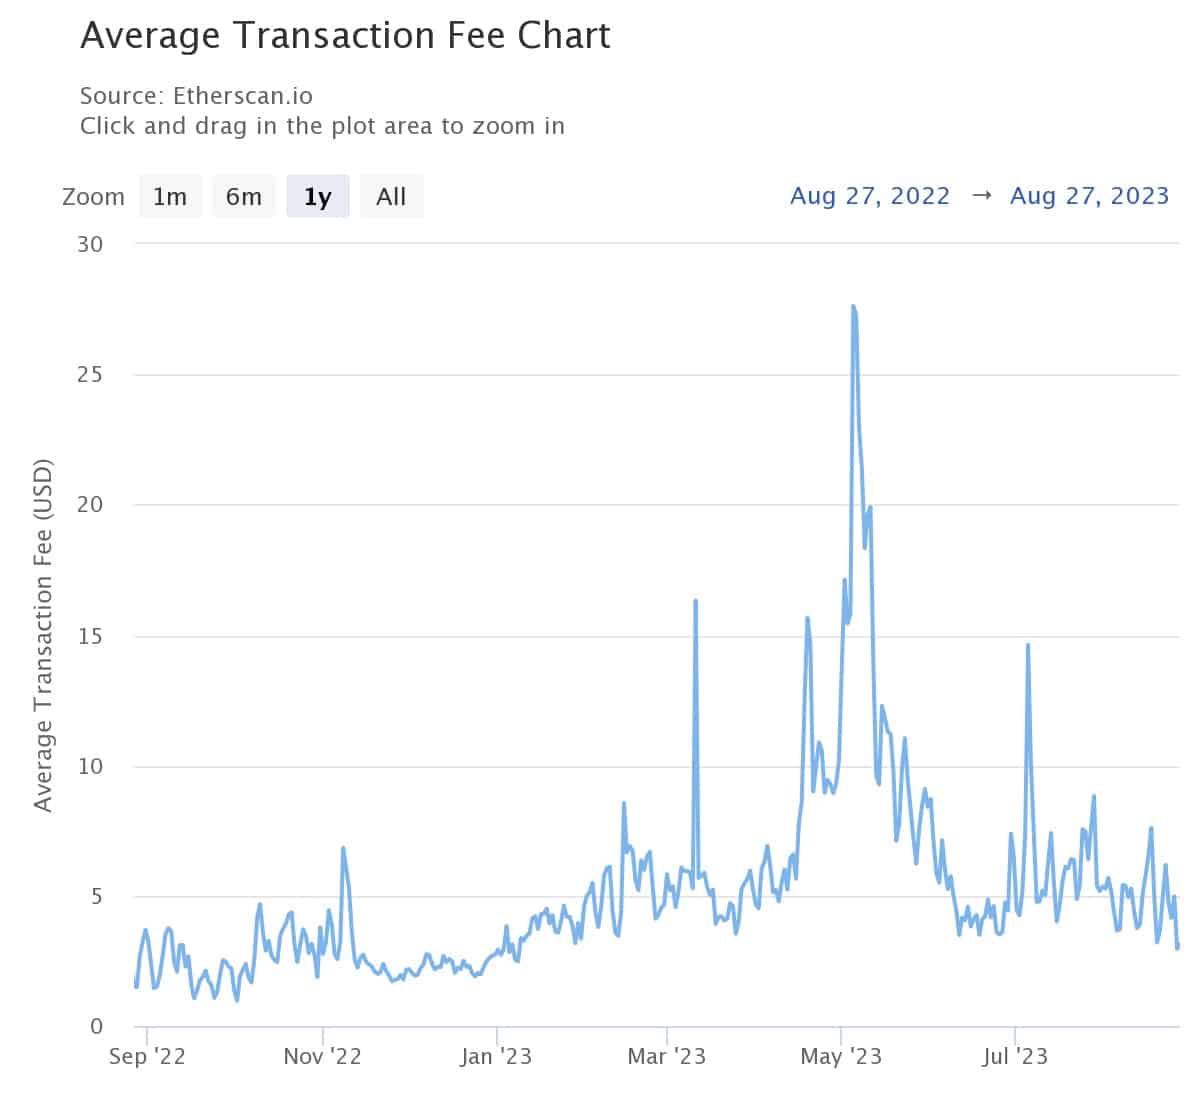
Figure 3 – Average price of an Ethereum transaction over the last 12 months
Moreover, this slowdown in activity has a direct impact on the amount of ETH burned each day. It is this activity that is likely to make ETH inflationary or deflationary. Over the last 30 days, capitalisation has therefore been at equilibrium, with a very slight deflationary trend of -0.04% per year, meaning that almost as many ETH are burnt as created.
In the almost one year since The Merge, Ethereum has been deflationary by 0.266%, corresponding to a net balance of almost 305,200 fewer ETH :
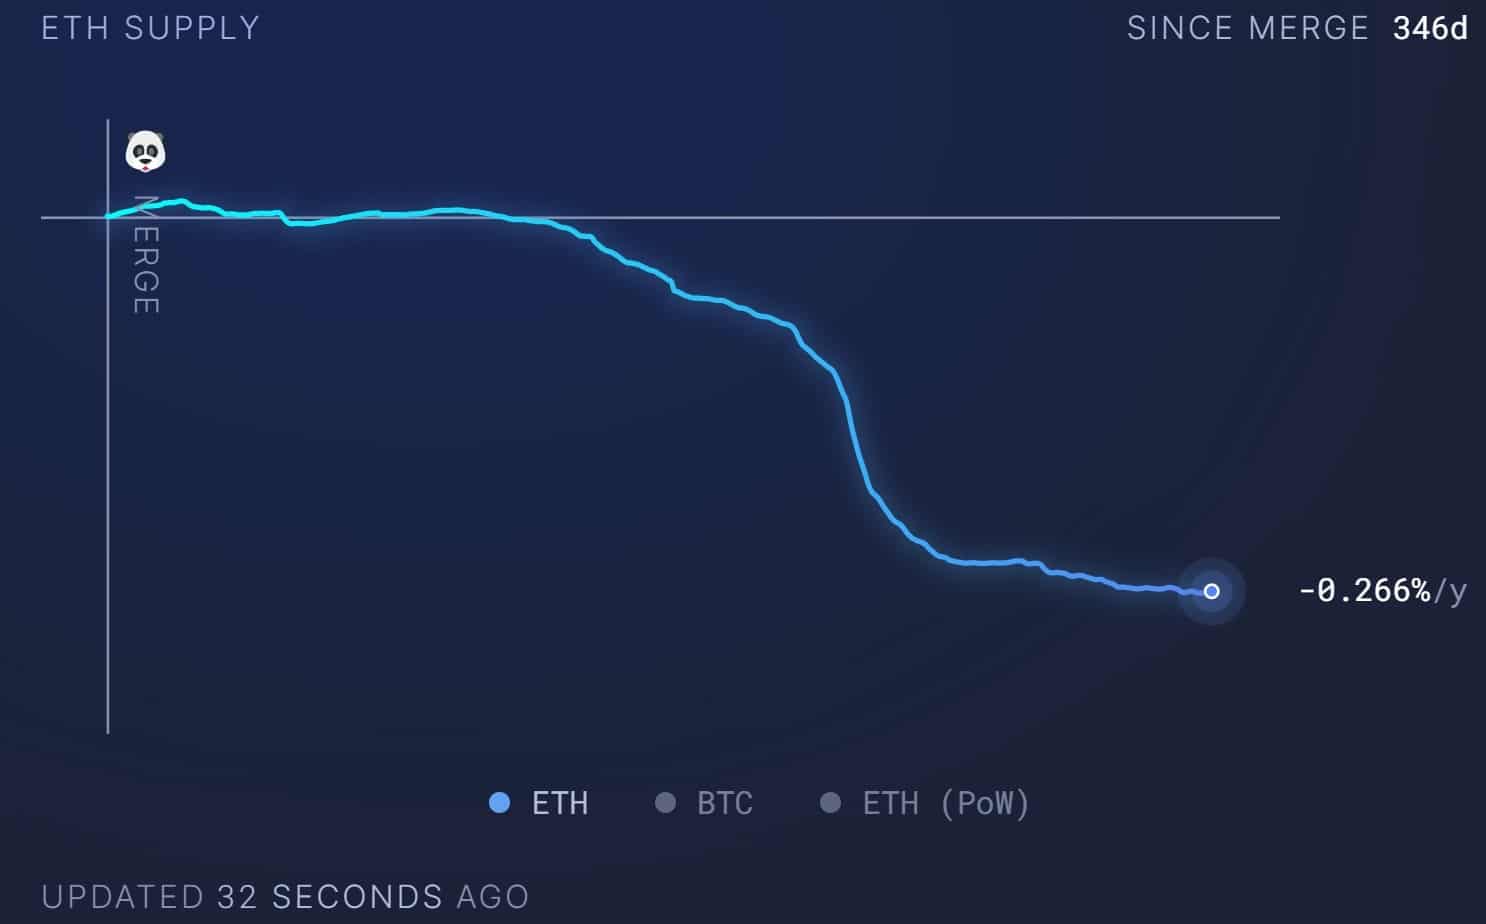
Figure 4 – Evolution of the quantity of ETH in circulation since The Merge
In addition, the blockchain now has more than 242 million addresses, an increase of 10% since the start of the year.
Despite an asset price of $1,650, down 65.5% since the last all-time high, these various data points, and particularly the staking data, nevertheless show that Ethereum is more solid than ever.