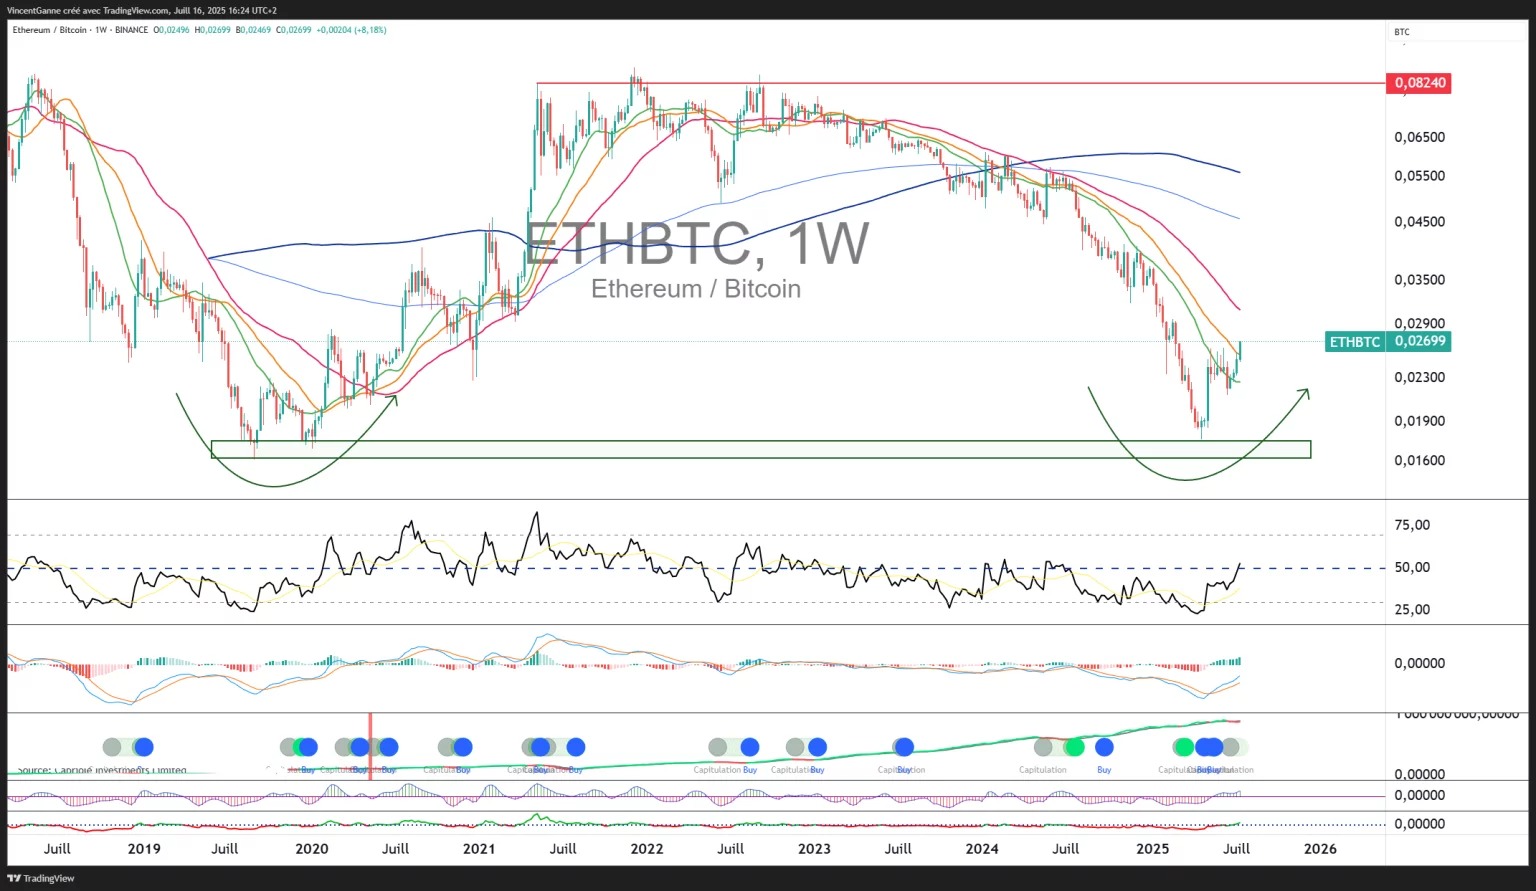
Technical analysis highlights the presence of extreme historical chart support, which has enabled a bullish reversal of the ETH/BTC rate in recent weeks. In conclusion, Ether will now outperform Bitcoin, and this should continue until the end of the current cycle, i.e. October/November.
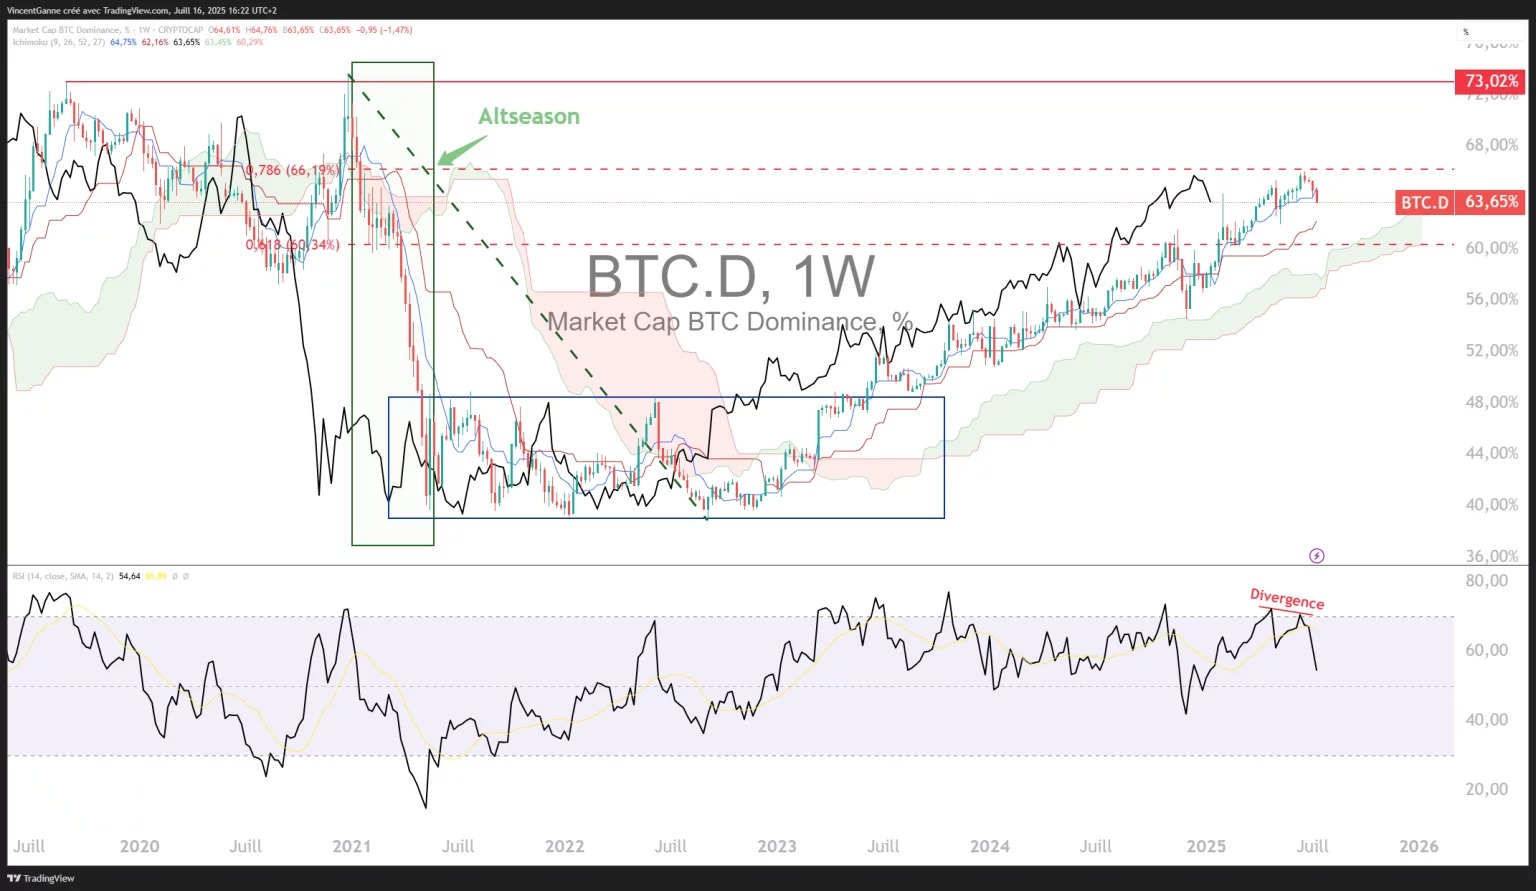
A bearish reversal in Bitcoin’s dominance
Since the start of the bullish cycle in the fall of 2022, the strategy focused exclusively on altcoins has often disappointed. While Bitcoin returned to record levels and saw its dominance grow steadily, the relative performance of altcoins remained disappointing.
However, since July, signs of fragility have appeared in this supremacy. Even though Bitcoin has reached a new all-time high, its share of the total crypto market cap is beginning to decline. Several technical factors point to a potential return of interest in altcoins as we approach the final phase of the bullish cycle linked to the halving in spring 2024.
The evolution of Bitcoin’s dominance is one of the most closely watched indicators. For several weeks now, a bearish divergence has been forming between the price trajectory and the momentum, measured here by the RSI indicator. If this configuration is confirmed, it would signal a weakening of BTC’s dominance, which could implicitly mean the start of the altcoin season.
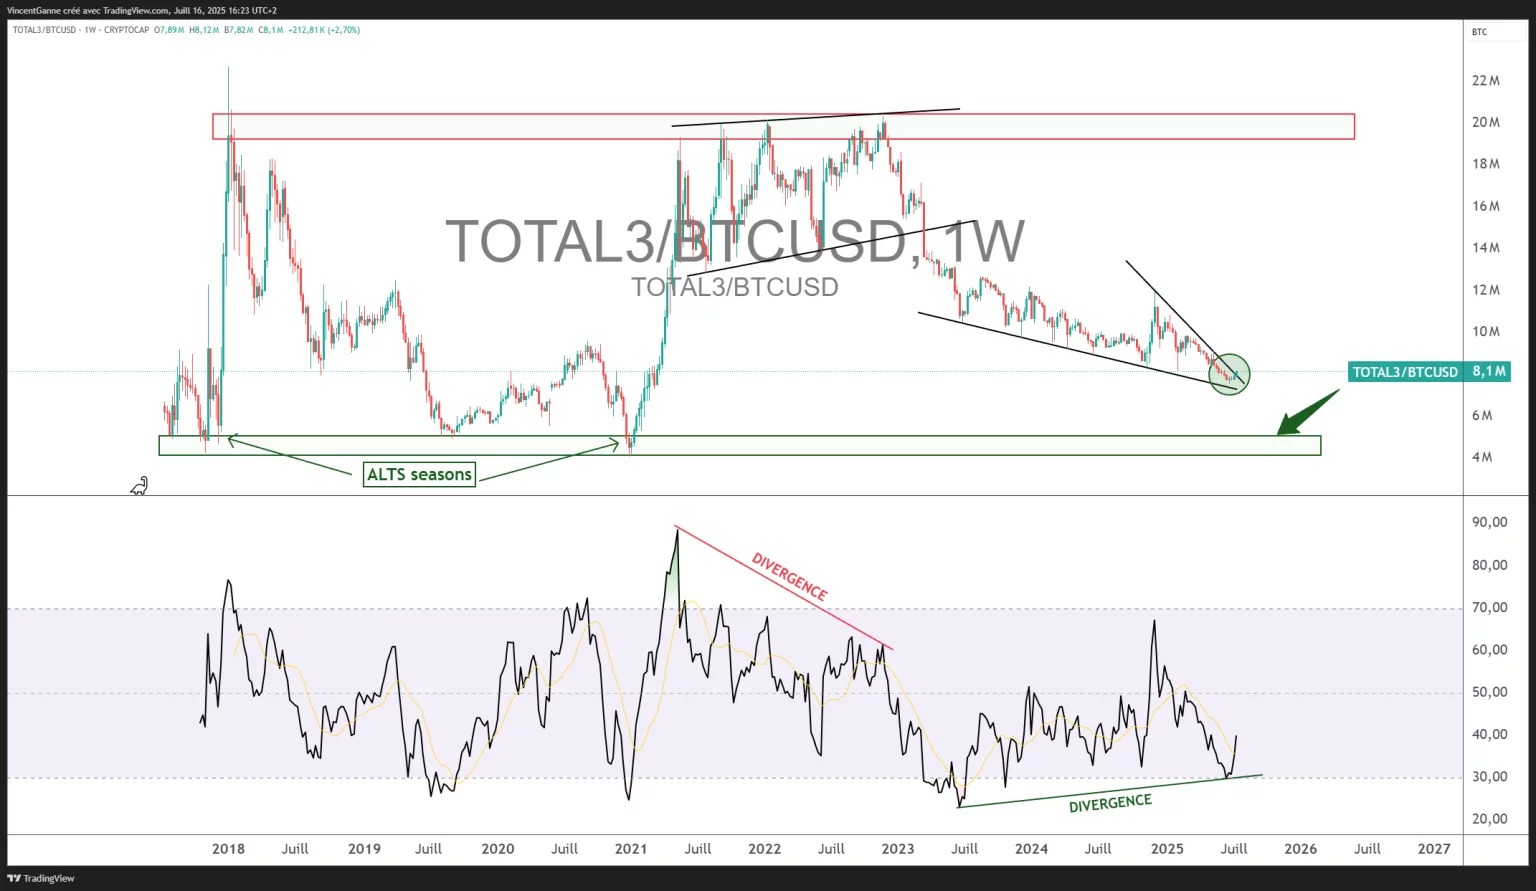
The TOTAL3/BTC ratio: the altcoin season barometer to watch closely
Another key factor is the ratio between the capitalization of altcoins (excluding Bitcoin, Ethereum, and stablecoins) and that of Bitcoin. This ratio, often considered an advanced barometer, is currently showing a bullish divergence. Breaking above a technical resistance level would reinforce the idea that a cycle of outperformance for altcoins could be starting.
The ETH/BTC ratio has confirmed a major bullish reversal, signaling that Ether will outperform BTC until the end of the current cycle.
The relative strength cycles between the price of Bitcoin and the price of Ether are cycles lasting several years, 5 to 6 years. Technical analysis highlights the presence of extreme historical chart support, which has enabled a bullish reversal of the ETH/BTC rate in recent weeks.
In conclusion, Ether will now outperform Bitcoin, and this should continue until the end of the current cycle, i.e., October/November.
The chart below shows the weekly Japanese candlesticks for the ETH/BTC rate.
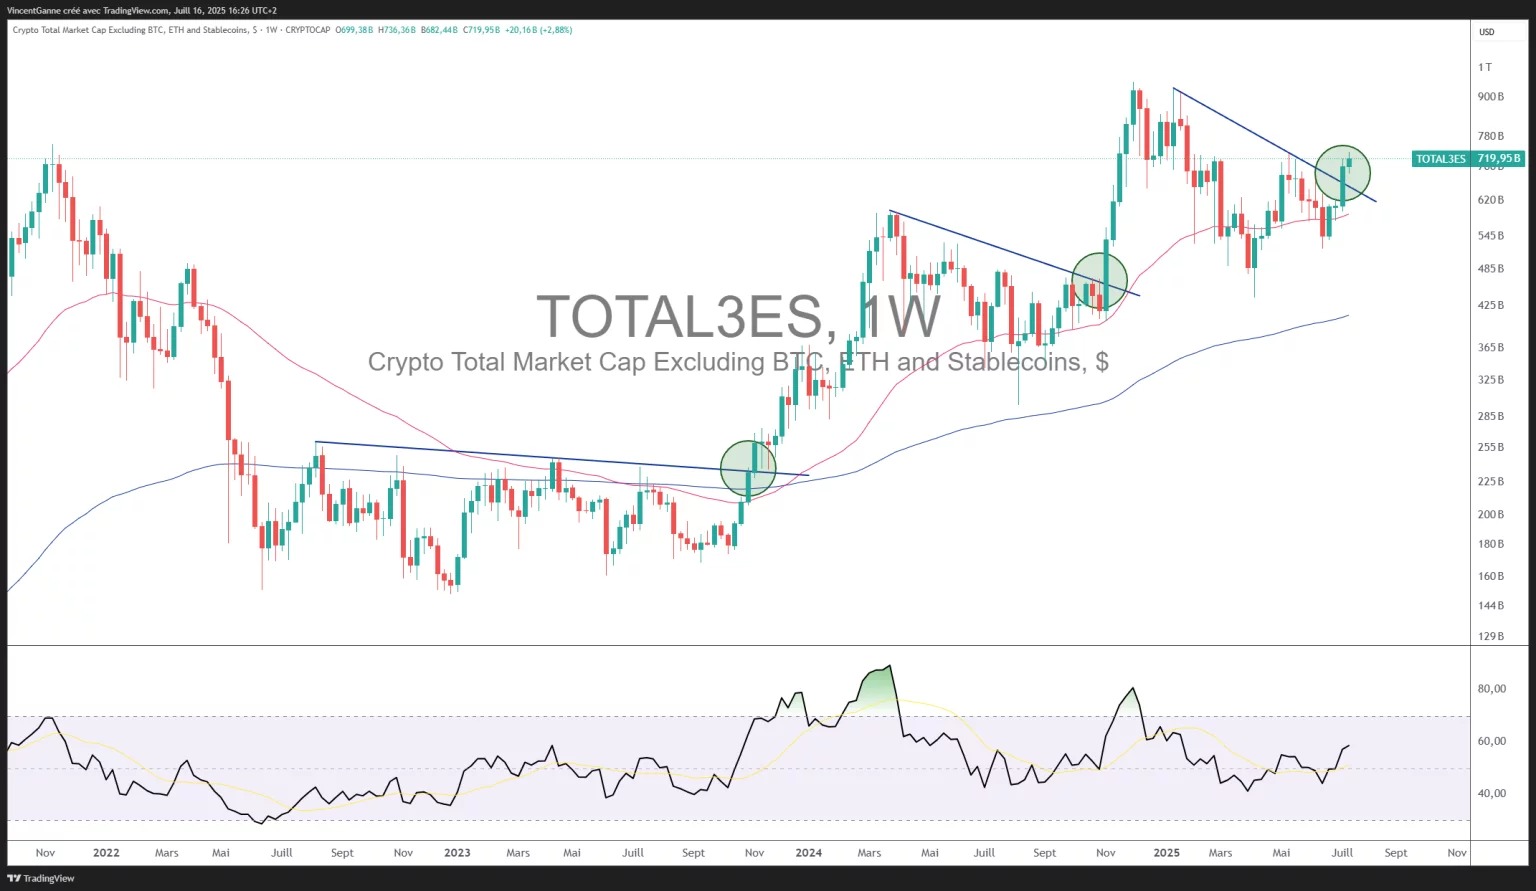
A technical breakout in favor of altcoins
Looking at the overall capitalization of cryptocurrencies after excluding the largest capitalizations, a positive chart signal has recently emerged. The breakout of a major resistance level in weekly data validates a bullish pattern which, if it continues, could support the appreciation of altcoins until the end of the cycle.
Conclusion: After several quarters of unchallenged dominance by Bitcoin, several indicators point to a different scenario. Between the bearish divergence in dominance, the bullish build-up in the altcoin index, and the recovery of Ether, the technical conditions for a new altcoin season appear to be coming together.
However, as always, only clear confirmation of the technical signals will validate this hypothesis. Finally, keep in mind that there are so many altcoins that a large number of them will not participate in the rally.