")
John Bollinger said, “It will soon be time to pay attention to Ethereum and Solana.” The last time he mentioned a similar configuration, Bitcoin jumped nearly 50%.
A tweet heralding the end of the correction?
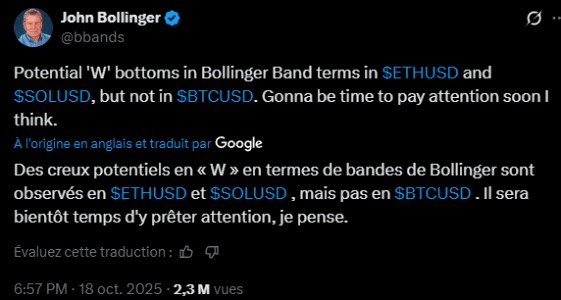
On October 18, the X @bbands account, run by John Bollinger, posted an enigmatic message referring to a Bollinger Bands configuration that suggests the possible formation of a bottom on Ethereum and Solana.
In a context of heightened fear, fueled by deep macroeconomic instability, the idea of a market low may seem surprising. However, it is often in this type of context, especially in the crypto market known for its contrarian nature, that lows often emerge.
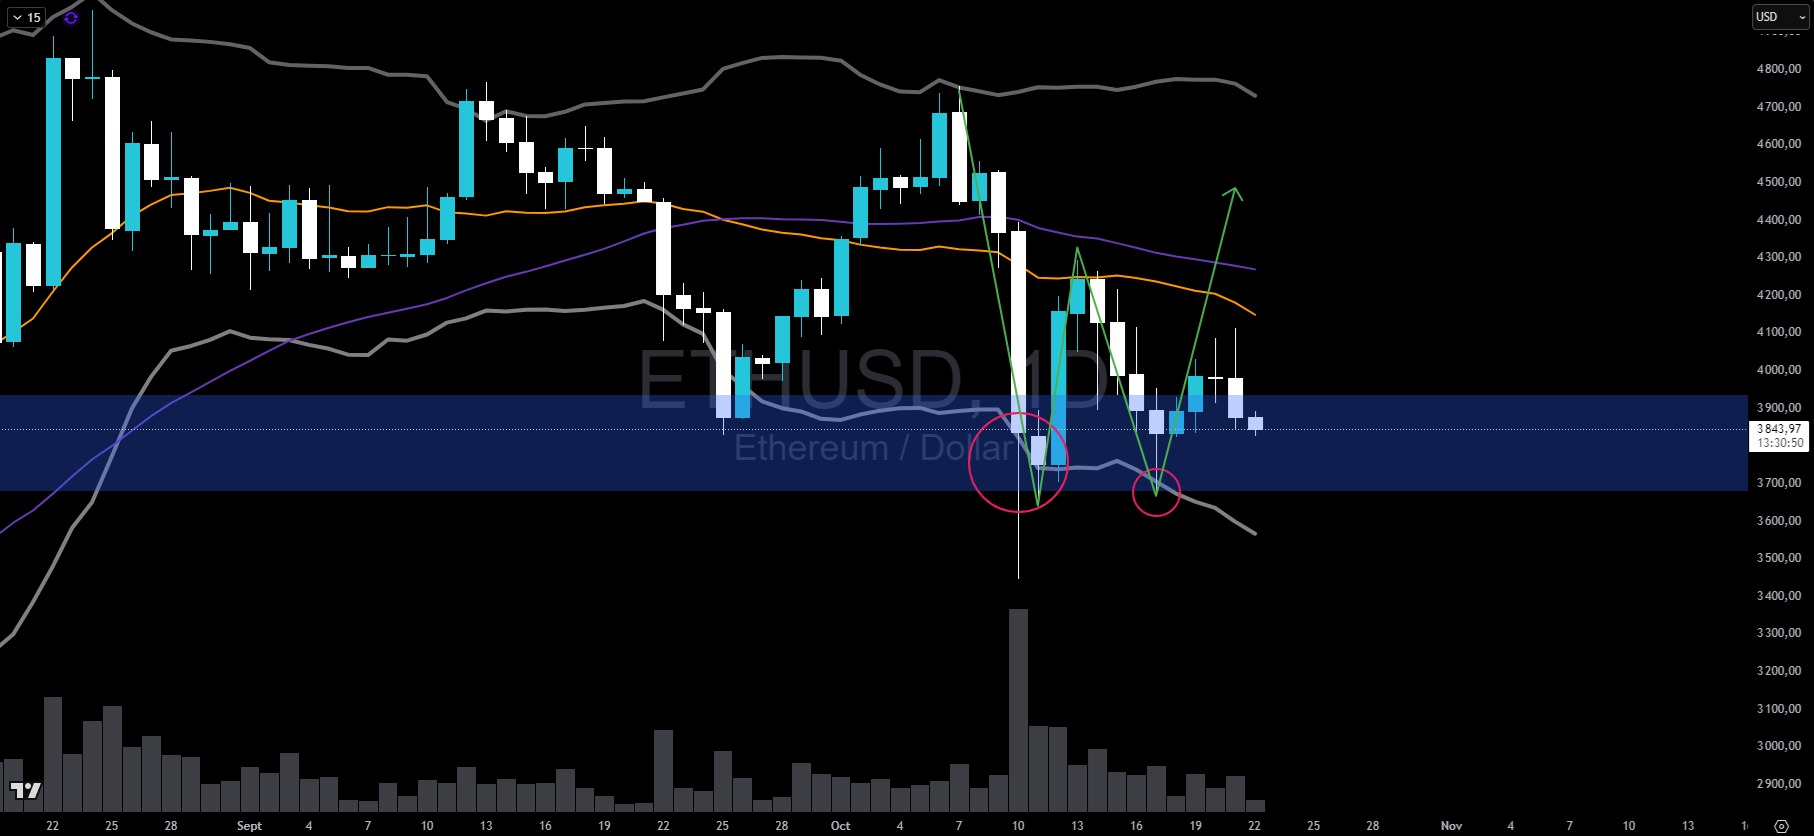
We have indeed detected a setup on the Solana and Ethereum charts that is regularly used with Bollinger Bands to identify both potential major market highs and lows.
This configuration seems most relevant on the daily chart, since a close very close to the lower band, achieved in a high-volume movement, is followed by a lighter touch generating both a sharp reaction and a slowdown in volumes.
All of this can be observed at a historically interesting level, reinforcing the favorable statistics for a market reversal.
To confirm this hypothesis, Ethereum will need to hold at $3,680 while breaking through $4,300 to restart the upward momentum.
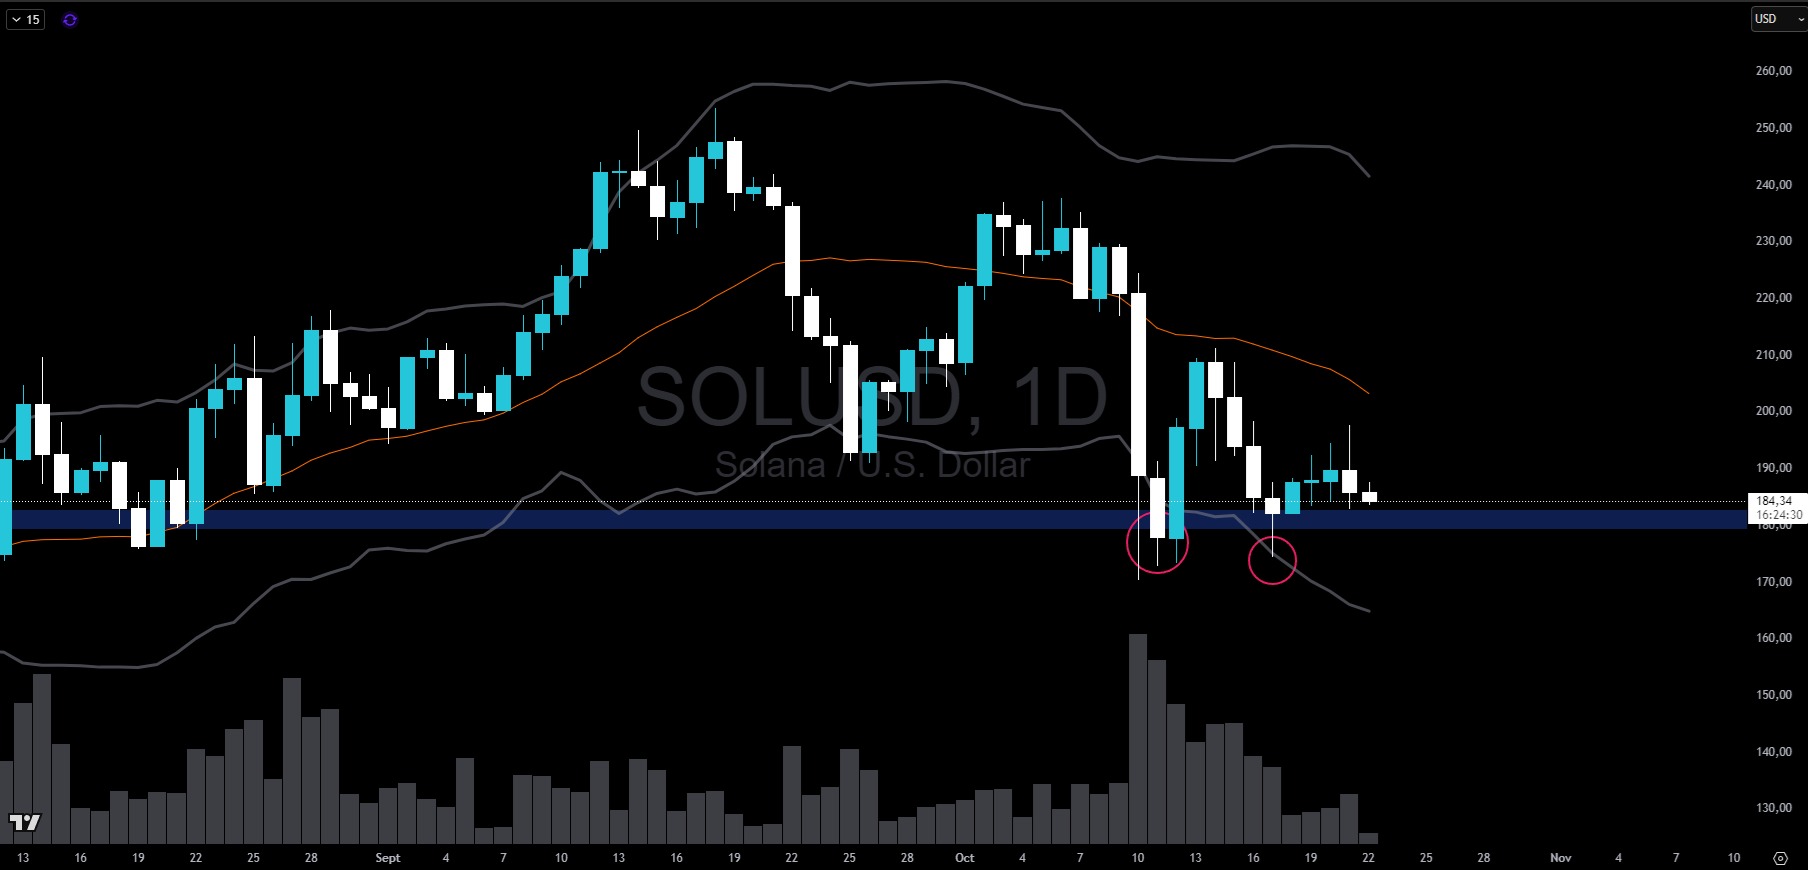
However, the pattern appears clearer on Solana, where the daily closes on Friday 10 and Saturday 11 were below the lower Bollinger band.
The session on Friday, October 17 then saw a return of buyers, allowing a close above the historic threshold of $180. This movement reflects a return to the key level, which is now crucial to defend. To validate this bullish reading, Solana will however need to recapture the $200 zone and then confirm its recovery by breaking through $210 with conviction.
Why is John Bollinger noteworthy?
John Bollinger is the inventor of one of the technical indicators most widely used today by analysts, traders, and investors: Bollinger Bands.
This price analysis tool is based on a 20-period moving average, around which two bands are drawn—one above and one below—calculated from the standard deviation of the reference period.
It allows you to visualize periods of high or low market volatility and identify potential resistance or support levels. When the price reaches one of these limits, the asset can be considered to be in a zone of tension.
This mechanism is often illustrated by the metaphor of an elastic band connecting the 20-period moving average and the price: the further the price moves towards one of the bands, the more the elastic band stretches, until it reaches its limit when it touches the upper or lower band.
Although not very active on X despite his 269,000 followers, John Bollinger is nevertheless one of the big names in technical analysis, alongside Jesse Livermore, Charles Dow, and Richard Wyckoff.
His comments are rare, which attracts even more attention from observers when he does post a message.
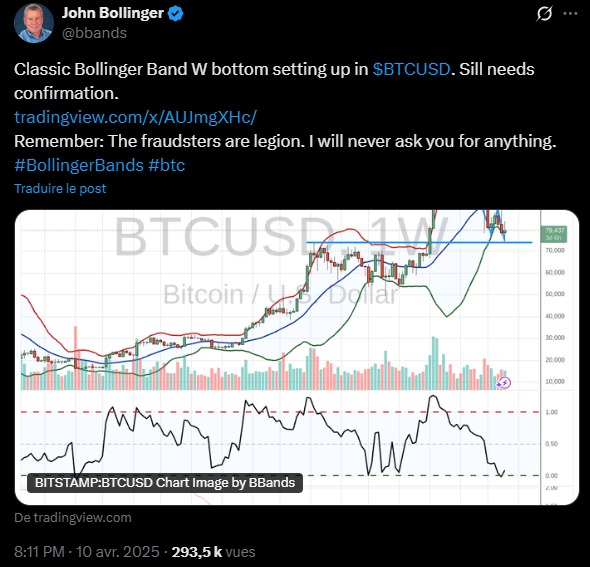
Last April, before Bitcoin’s significant bullish momentum propelled the price from $74,000 to $112,000, Bollinger was already talking about a similar configuration: a double touch of the Bollinger Bands at a key historical level, accompanied by a decrease in volume between the first and second contacts.
In summary, John Bollinger highlights a daily technical configuration that could, at key historical levels, allow the price to rebound while printing a major low point.
So, do you think the crypto market, and Solana and Ethereum in particular, can finally rebound? Feel free to give us your opinion in the comments.
Have a great day, and we’ll see you very soon for a new technical analysis.