Home » BORG: is a return to the ATH possible? Technical analysis for October 9, 2025

BORG: is a return to the ATH possible? Technical analysis for October 9, 2025

by Christian

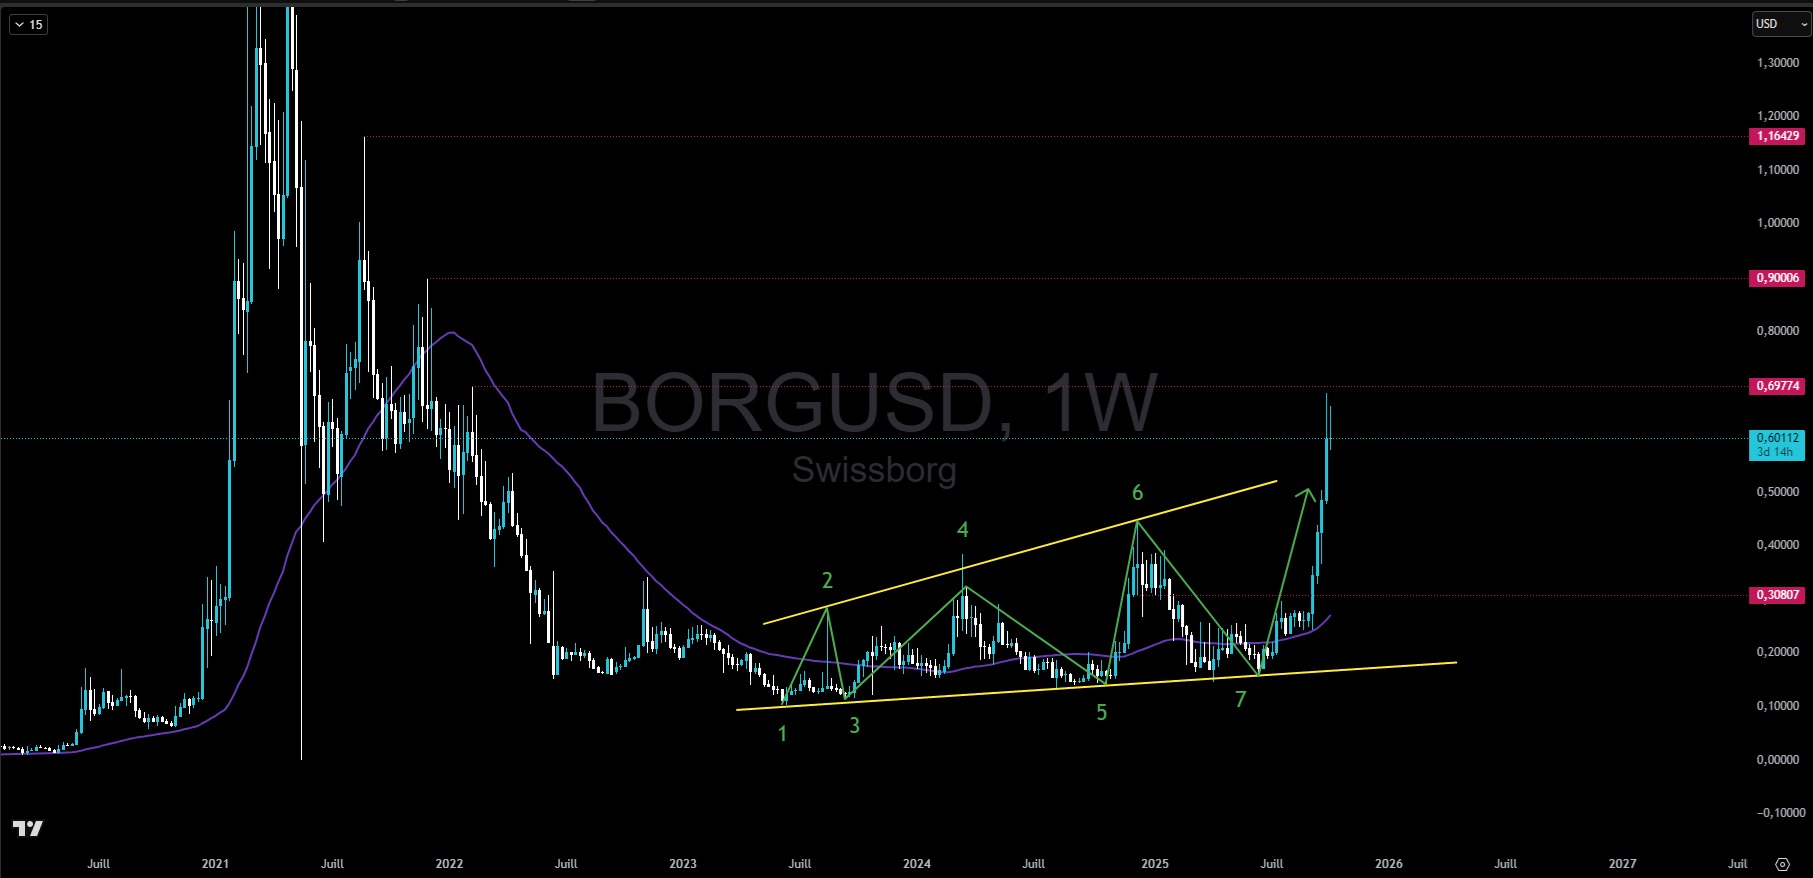
Could the BORG repeat its remarkably positive performance in the last quarter of 2025, as it did during the previous bull cycle? The technical configuration it established before the start of its rally suggests potential for growth beyond the symbolic threshold of $1.

Markets perched at historic highs

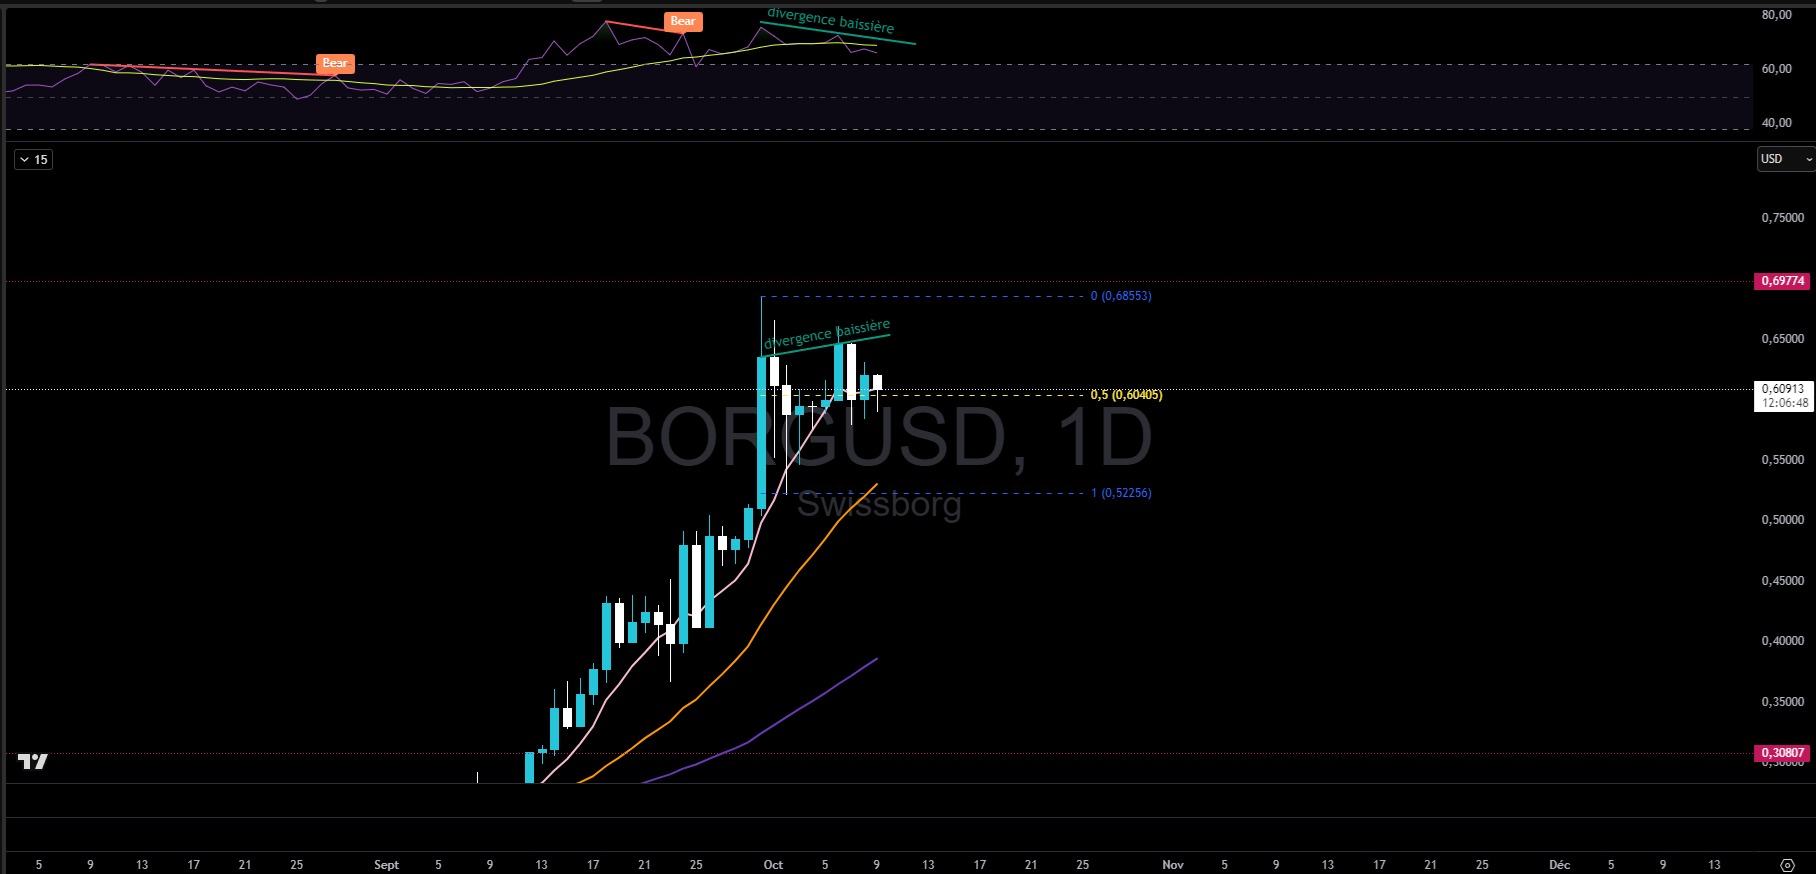
On October 9, 2025, at 12:46 p.m., Swissborg’s BORG was trading at $0.60. For several weeks now, this cryptocurrency has been experiencing sustained upward momentum, even as global markets remain perched at historic highs.

Many players are questioning the excessive valuation of US stocks, which, according to traditional analysis ratios, could be considered overvalued.

Such a configuration could logically lead to a marked retracement in the coming months. However, this situation has persisted for a long time, mainly affecting the large caps of the S&P 500. Small caps, on the other hand, are in better health, although the RUSSELL 2000—the benchmark index for US small caps—is also trading near its all-time highs.

Speculators remain alert to a possible rotation of capital which, in the event of a renewed appetite for risk, could benefit small caps as well as the most volatile crypto-assets: altcoins.

For this scenario to materialize, a favorable environment would be needed, marked by a more accommodative monetary policy and a combination of circumstances in which the United States manages to avoid recession while maintaining inflation close to 2%.

BORG is the native cryptocurrency of the Swissborg exchange platform, an altcoin that currently shows very strong technical signals.

Listed on Coingecko since 2018, the asset stood out during the 2020-2021 bull run with its remarkable performance. However, it remains underrepresented on CEXs outside its home exchange and, to date, has no known derivative contracts. With a market capitalization of around $589 million, BORG currently ranks 176th in the world. Its recent indicators show exceptional growth, not only against the dollar, but also against Bitcoin and Ethereum.

+125.80%

A highly explosive accumulation pattern for BORG

BORG exhibits a particularly interesting accumulation pattern, identified by Jesse Livermore and named after him: the Livermore accumulation cylinder.

This configuration, which is often highly explosive, generally gives rise to marked and impulsive expansion phases, culminating in a “blow-off top” — or peak of excessive bullishness —, the summit of a bubble that most often leads to a retracement of comparable magnitude.

Diagram of the Livermore cylinder

Since exiting the cylinder, BORG seems to be stalling around $0.70. This consolidation phase appears entirely legitimate given the strength of the previous movement, which quickly propelled momentum indicators into excess territory, even on the highest time frames.

The real question now is whether the current momentum can continue, with targets at $0.90 and then $1.16.

The Livermore cylinder, as we have presented it, generally implies a very explosive expansion phase, characterized by small retracements before a possible almost total reversal of the movement. However, the evolution of BORG will have to be considered in light of the general state of the market. The latter remains favorable to a bullish continuation for the time being, but the strong correlation with the crypto market as a whole limits the likelihood of BORG continuing its rise alone in a generally deteriorating environment.

Weekly chart of BORG token performance

The daily chart highlights a divergence between the RSI and the price curve, which shows a slowdown in buying strength. This divergence should not be considered a sell signal, but rather a signal of caution: the asset needs to take a breather.

To give us some reference points, we can draw a zone between the first daily high and the first daily low formed in the area. These define a potential range within which the BORG can work before deciding how to proceed.

We can set the polarity at the median of this range at $0.60, a threshold that allows us to envisage a return to $0.68 as long as we remain above it and which, on the contrary, if we are unable to maintain the price above it, could put pressure on $0.52 with a view to a deeper correction.

An interesting point: the equilibrium of the range we have just mentioned converges with the 0.236 Fibonacci retracement (located at $0.58) of the last weekly bullish movement, reinforcing the idea of a bullish rebound from this level if consolidation manages to hold there.

Another interesting point of convergence: the 0.382 retracement of the last weekly leg coincides with the lower bound of the range we have traced around $0.52. This once again reinforces the relevance of this level as a potential area for a bullish rebound.

Daily chart of the BORG token's performance

In summary, Swissborg’s BORG is showing promising bullish momentum, which could lead it towards the $1 zone. Currently in a consolidation phase, the asset will, however, need to hold above the $0.60 threshold at closing in order to keep the possibility of a rapid resumption of the upward movement intact.

So, do you think BORG can return to $2? Feel free to give us your opinion in the comments.

Pairs vs BORG 24 hours 7 days 1 month
BORG/USDT +1.30% +0.20%    +125.80%
BORG/ Bitcoin +1.70%    -2.70% +108.70%
BORG/Ethereum    +4.40% +0.90%

Related Posts

Leave a Comment