If we accept the working hypothesis that Bitcoin’s bull run ended on Monday, October 6, with a peak of around $126,000, then it makes sense to consider that date as the start of a new bear market—the so-called “cyclical bear market.”
A 12-month cyclical bear market
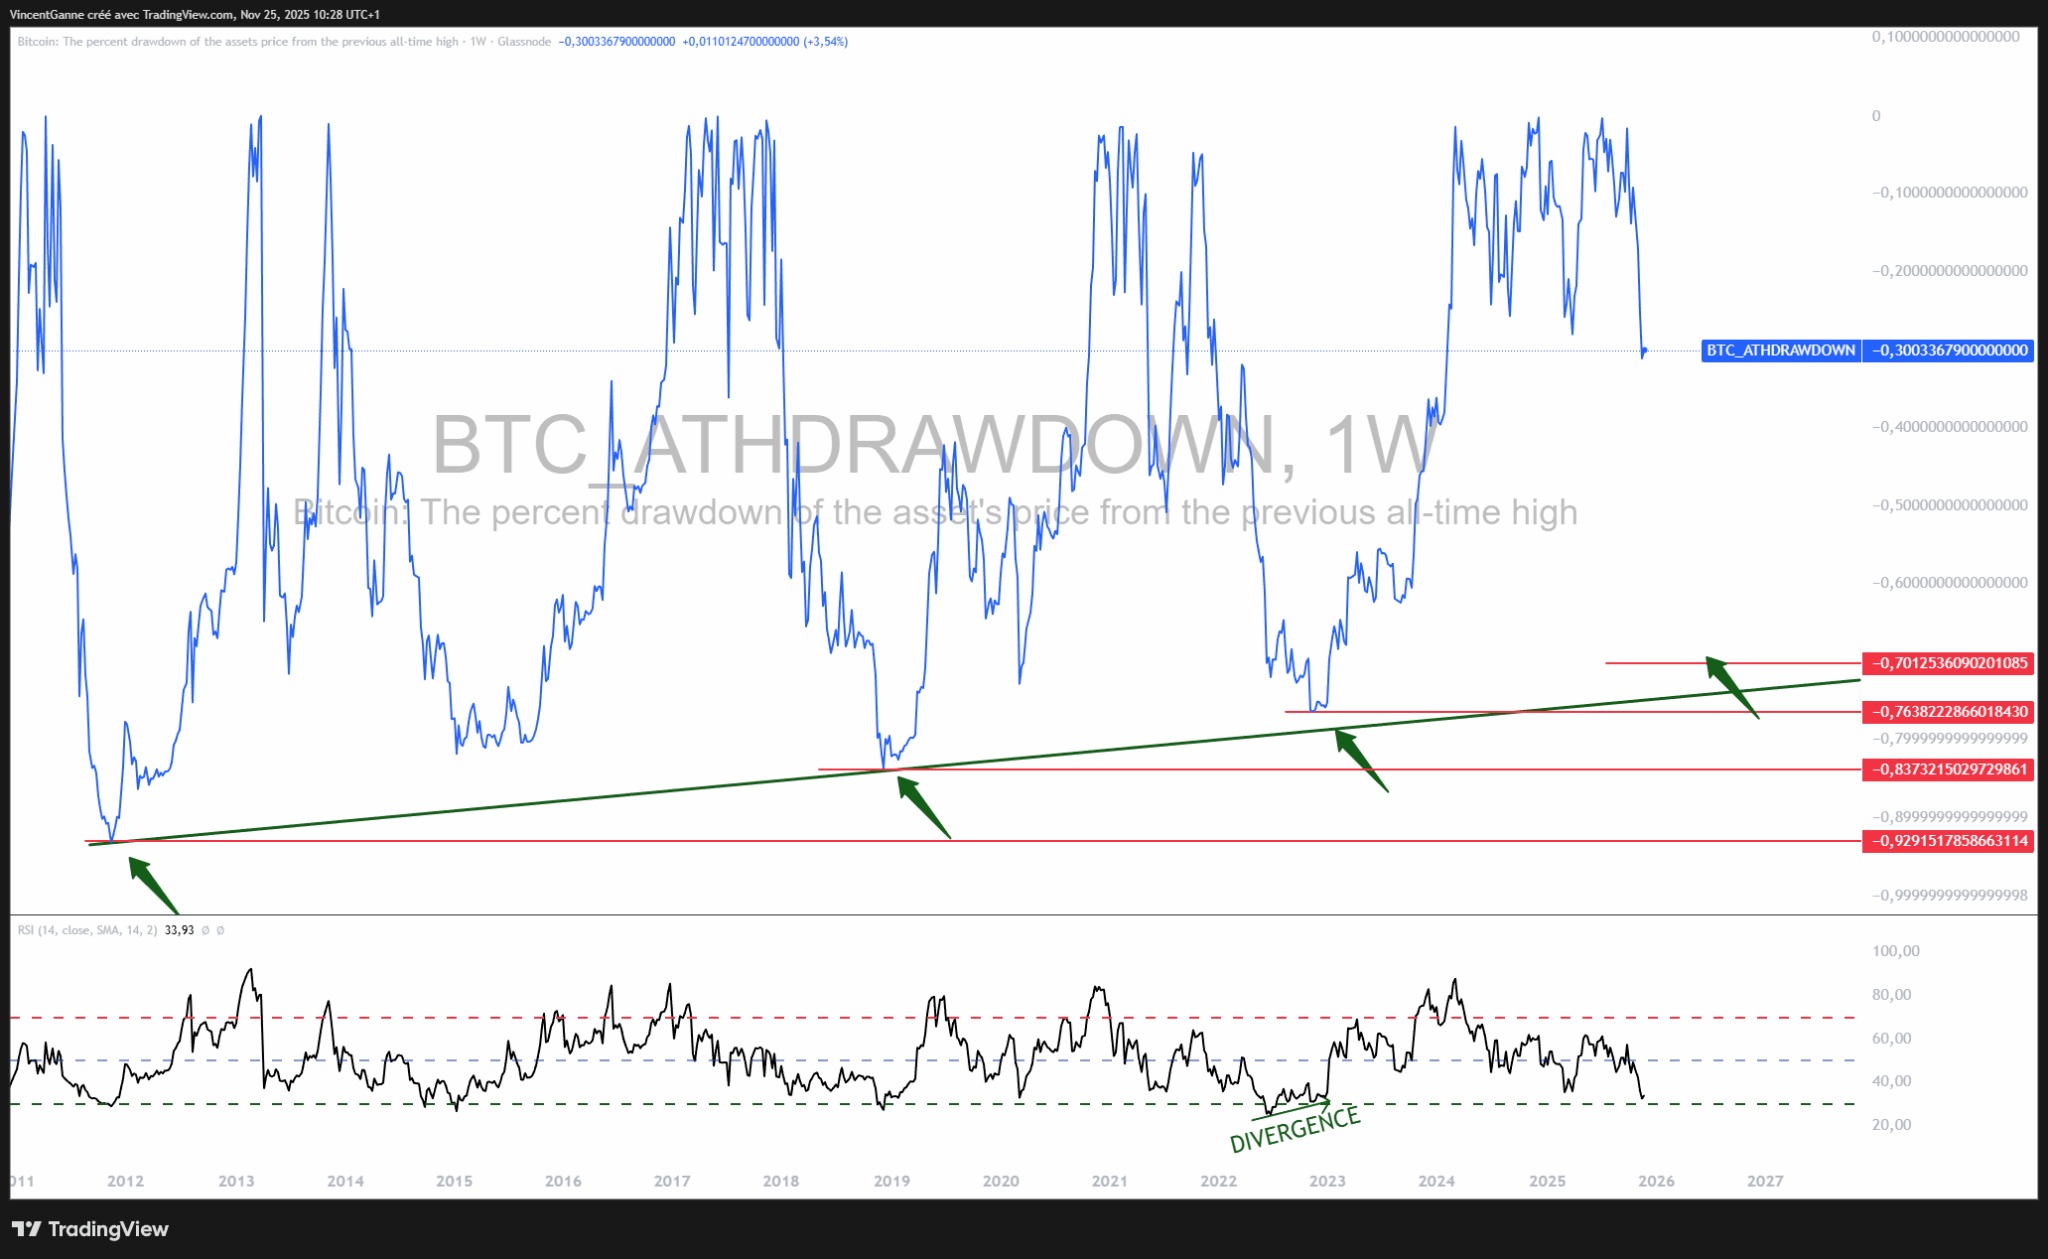
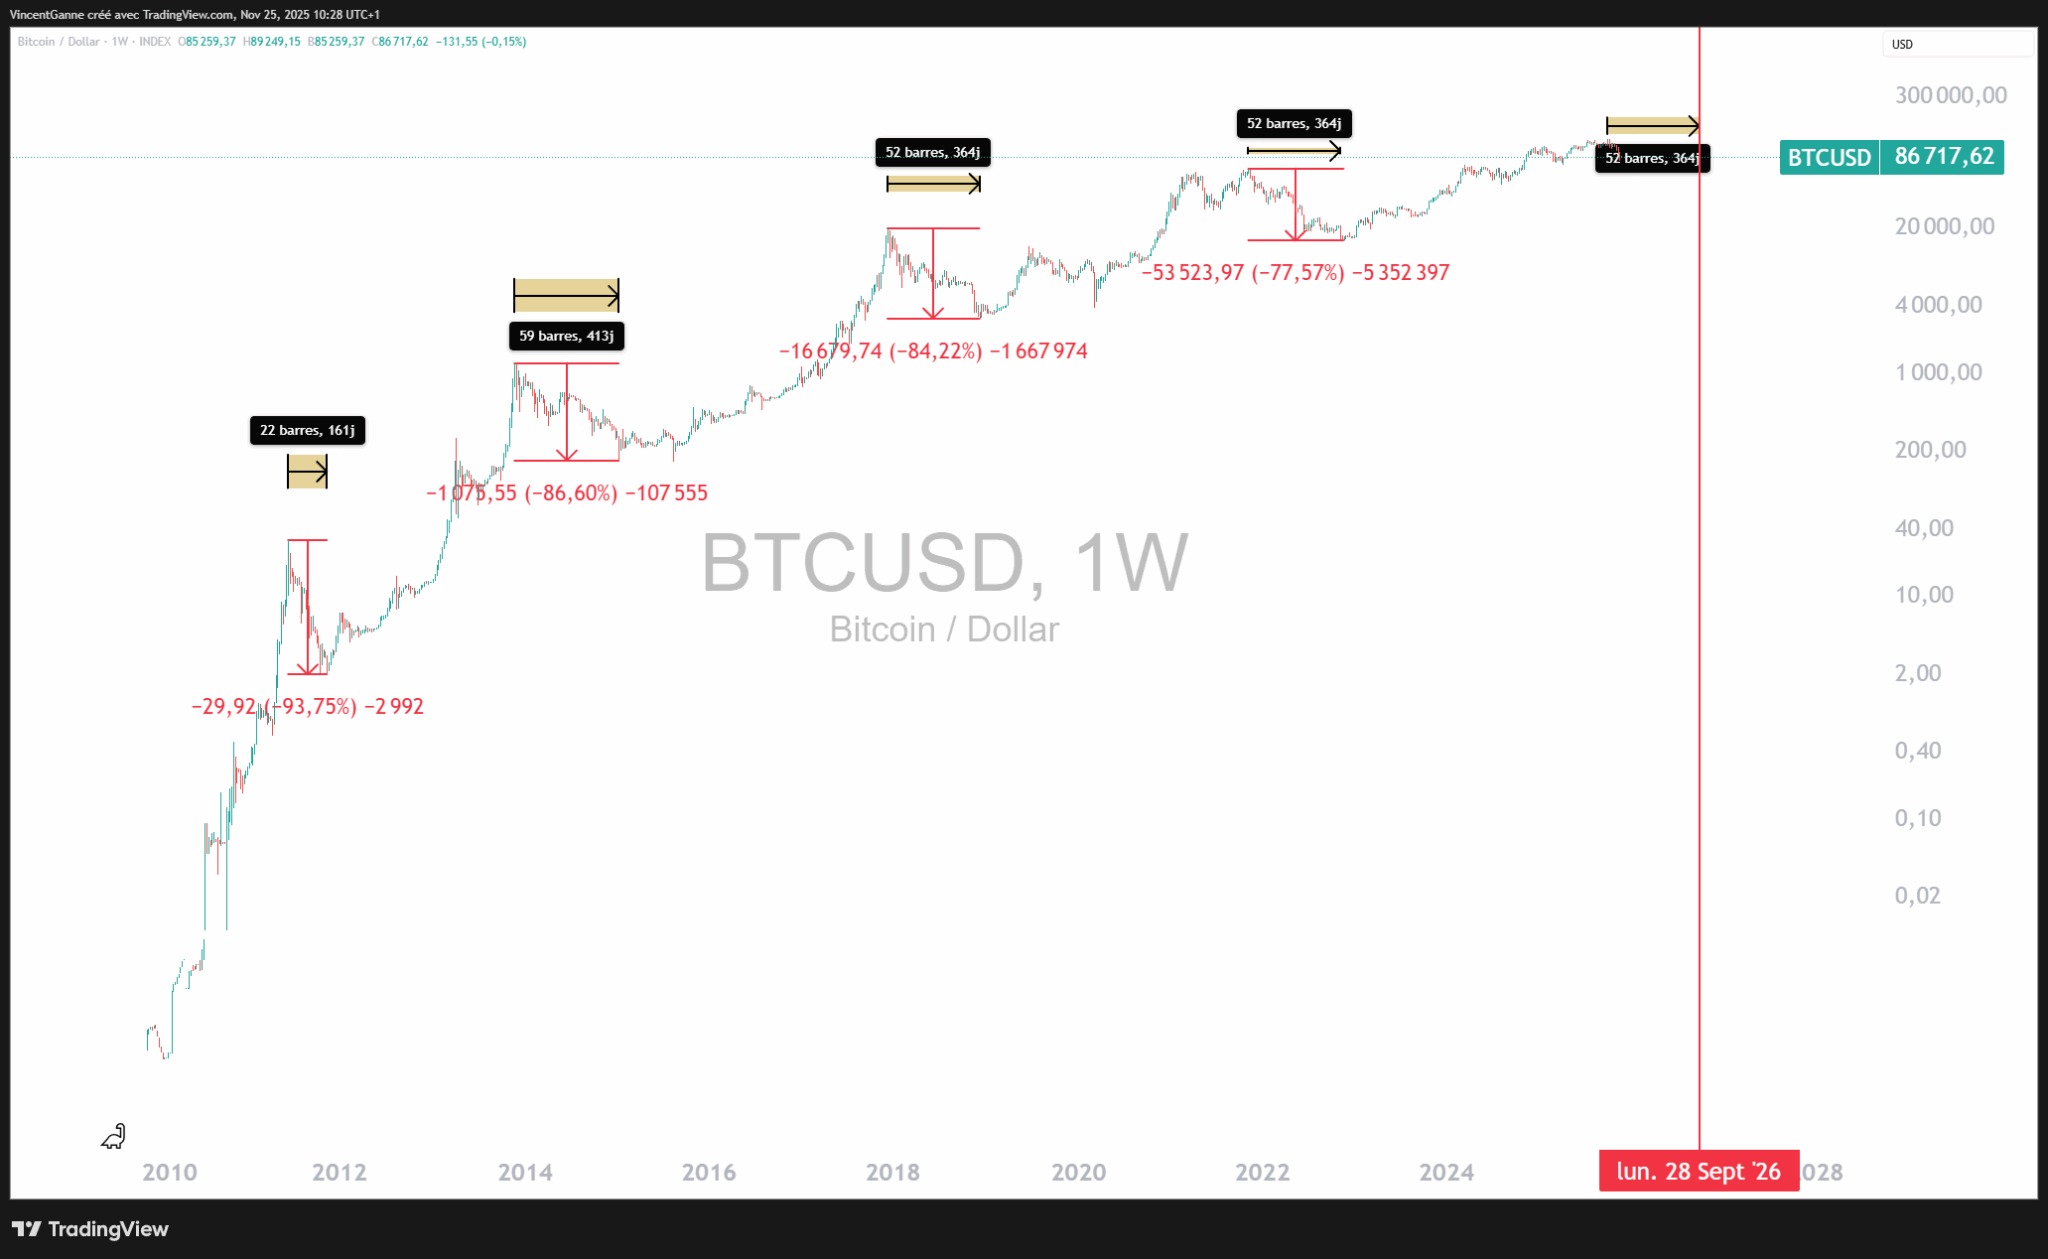
As with every cycle, this downturn fits within the structural logic of the four-year cycle, centered around the halving: a halving of the mining reward every four years. Historically, BTC’s cyclical bear market begins when the market exceeds 500–550 days after the halving in terms of time.
The fact that Bitcoin reached a cycle peak in early October (534 days after the last halving) once again confirms the almost metronomic precision of this four-year model. There is now sufficient historical data to observe patterns not only in the bull market phase but also in the bear market that follows it.
Here are the most common technical characteristics of a cyclical bear market:
- Average duration
- Bitcoin bear markets tend to last about a year. This rule of thumb has held true, particularly in the two previous cycles.
- Structure of the movement:
- The classic scenario revolves around three phases:
- an initial sharp downward move, the one we entered on October 6
- an intermediate technical rebound, often referred to as a dead cat bounce
- a final bearish leg leading to the true bottom of the bear market
- The classic scenario revolves around three phases:
- Magnitude of the correction.
- Even though the intensity of the declines tends to diminish over the years, the drawdown remains historically significant. It should be treated as a major correction, not merely a market pause, and could reach 50% in this new bear market.
A drawdown that should be smaller than in previous bear markets
Assuming that the new bearish phase did indeed begin on October 6, its theoretical timeframe would extend through September or October 2026. The market should then follow the three technical sequences described above, with a final decline potentially ranging between 40% and 60% from the peak of $126,000.
Of course, all of this hinges on the validity of the four-year cycle. If it were ultimately just a statistical fluke (the number of occurrences is very limited) or a phenomenon that is now obsolete (in which case, the current decline is a massive buying opportunity), this analytical framework would immediately lose its relevance. But as long as the data continues to align, this model remains a serious working hypothesis for explaining the decline in the price of Bitcoin since October 6.