
March is coming to an end and with it the episode of banking stress that saw the market making arbitrages between different asset classes. Bitcoin is among the winners and is now up over 70% year-to-date. The market faces major resistance at $29,000 as another monthly technical close looms.
Bitcoin price appreciates over 70% year-to-date
The month of March stock market is coming to an end and it might as well be said that it will remain in the financial annals with an episode of banking difficulties that is probably not over. The failures of regional banks in the United States at the beginning of the month led the major Central Banks (the FED, in fact) to bring out the heavy artillery with its balance sheet and pour billions of dollars to avoid a partial collapse of the financial system.
In this sequence of “banking stress”, Bitcoin (BTC) played its historical role as an alternative to the traditional banking system to the fullest, at least in the narrative that was put forward by the community.
In hindsight, it should be kept in mind that BTC’s bullish performance originated in January, when the market was able to re-enter the $20,000, ex-ATH of January 2018 and key level for the bitcoin blockchain.
Then, the new monetary policy expectations of the FED, the decline in inflation and therefore the banking shock combined to build an annual bullish performance of more than 70% that put the bearish theory followers who were aiming for the long-standing $10,000 in great difficulty.
The bitcoin price is now testing the $29,000 technical resistance, a threshold that can be considered the last argument of the bearish camp, their last chance to win in short. If this resistance is breached, then the bearish scenario will be invalidated for good.
As for the bullish camp, they still lack two elements to claim victory and call for a bull run. The first is the launch of the altcoins season and the second is the return of institutional trading volume still too light (for my taste).
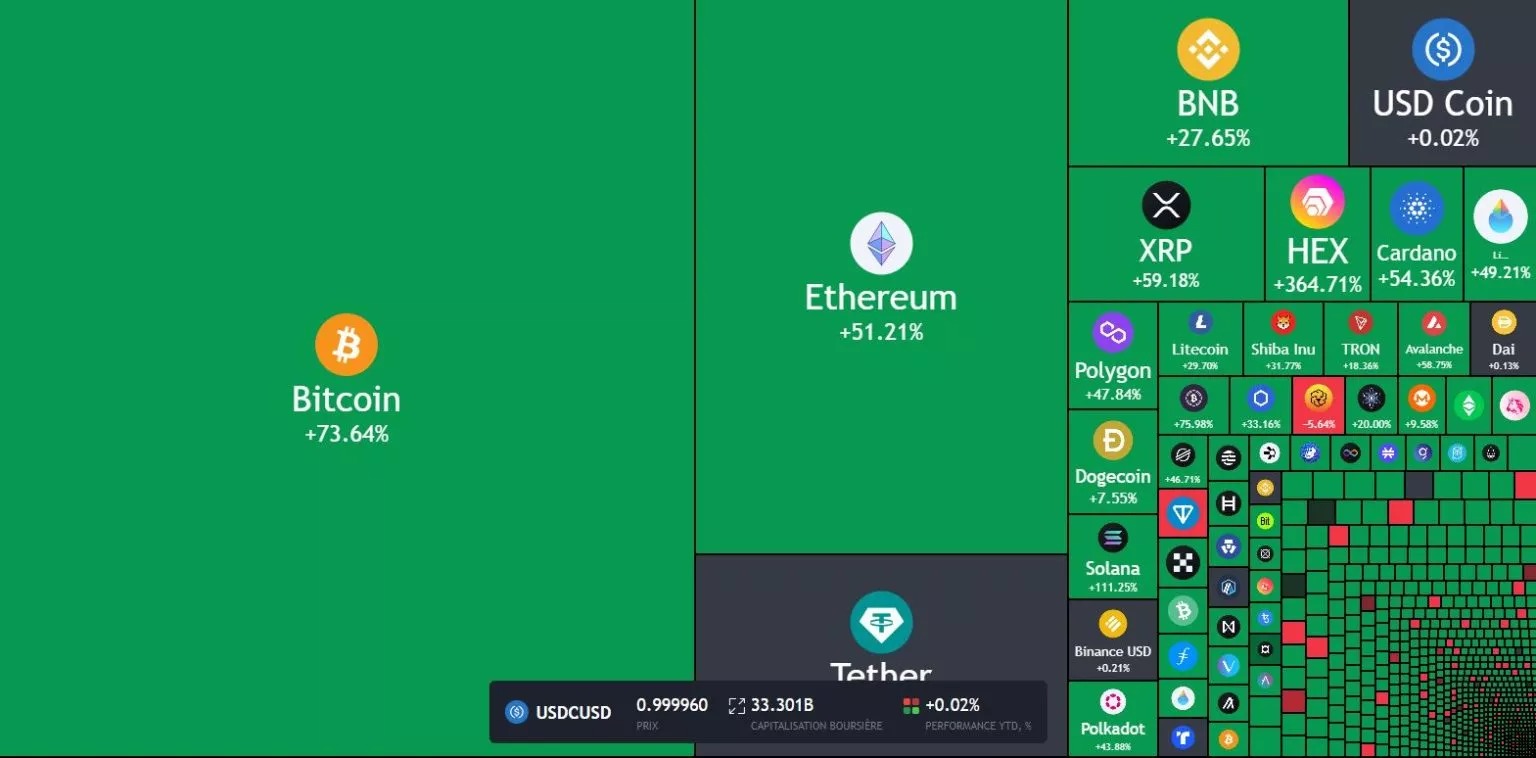
Chart that comes from TradingView and offers the heatmap of the crypto market since January 1st 2023
New chart close in monthly data could be favorable
So March is over and like every end of the month chartist analysts can take note of a new monthly chart close, which is long term in scope.
I already had the opportunity a month ago to comment favorably on February’s monthly close; March’s close looks just as favorable with confirmation of the upward trend reversal above $20,000. The die is not yet cast when these lines are written, but the monthly RSI technical indicator should be watched, which could, if the crypto God wills it, exceed the 50 level. If such a signal is given, then the rise will continue towards $35,000.
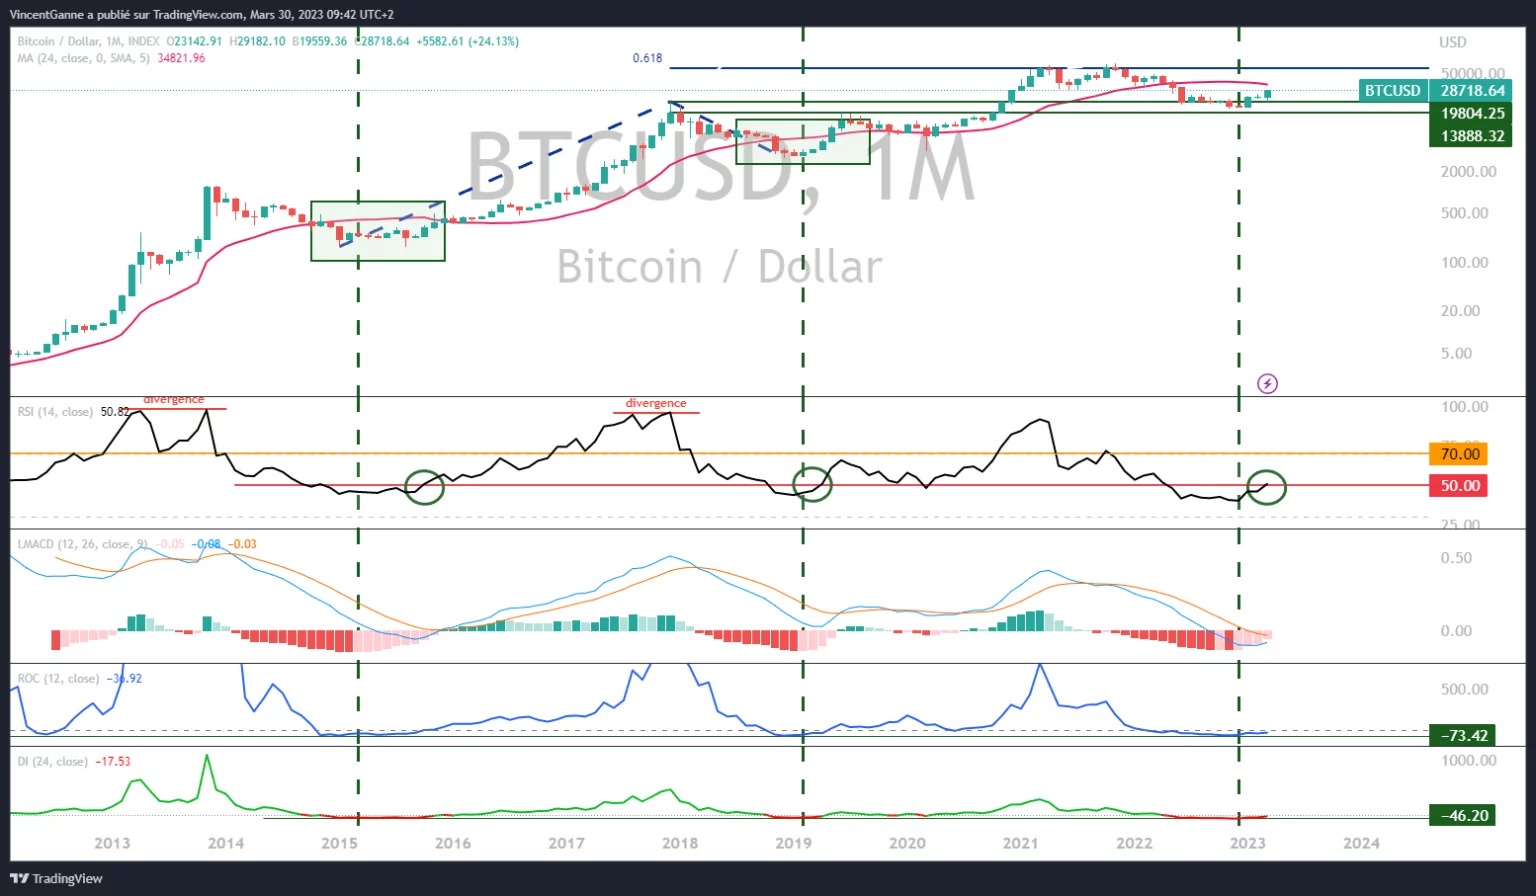
Chart that exposes the Japanese candlesticks in monthly bitcoin price data