: the final bear market purge is underway")
The FTX affair has sent the cryptocurrency market into the final phase of the bear market, the one that began in the spring of 2021, when interest rates started to rise and the US dollar made a long-term low. The Bitcoin (BTC) price is now developing its final wave of decline, the 5th wave, the one that is (in my humble opinion), a long-term opportunity.
The FTX case and systemic risk
Bitcoin (BTC) had been clinging to $19,000 support for over 6 months and was beginning to benefit from a more favourable cross-asset environment (interest rates and the US dollar on Forex are no longer rising).
But the crypto market had to look for a reason to fall of its own, the risk of a major global crypto exchange going bust.
Our team has published and continues to publish many informative articles on the Bitcoin price, crypto currencies news, I invite you to follow the FTX case, the fall of the world’s 2nd largest exchange.
My specialty is charts. But it is important to bear in mind that the FTX affair, if not quickly resolved, would represent a systemic risk for the ecosystem, thus making the technical view irrelevant.
In my two previous analyses, I highlighted that BTC’s volatility was reaching an all-time low, an event that could create a flight to safety. Here we are and the market has decided on a bearish trajectory.
On the fractal front, in particular the Elliott wave approach, I believe that bitcoin is now building wave 5 of the bear market, the last leg down, the one that is a long term technical opportunity (barring systemic risk).
The chart below shows BTC’s weekly Japanese candlesticks, with a logarithmic scale and the countdown in 5 steps. The “theoretical” target for this wave 5 is between $9,800 and $13,800.
This is the price range that must be defended or the long term uptrend will be jeopardized.
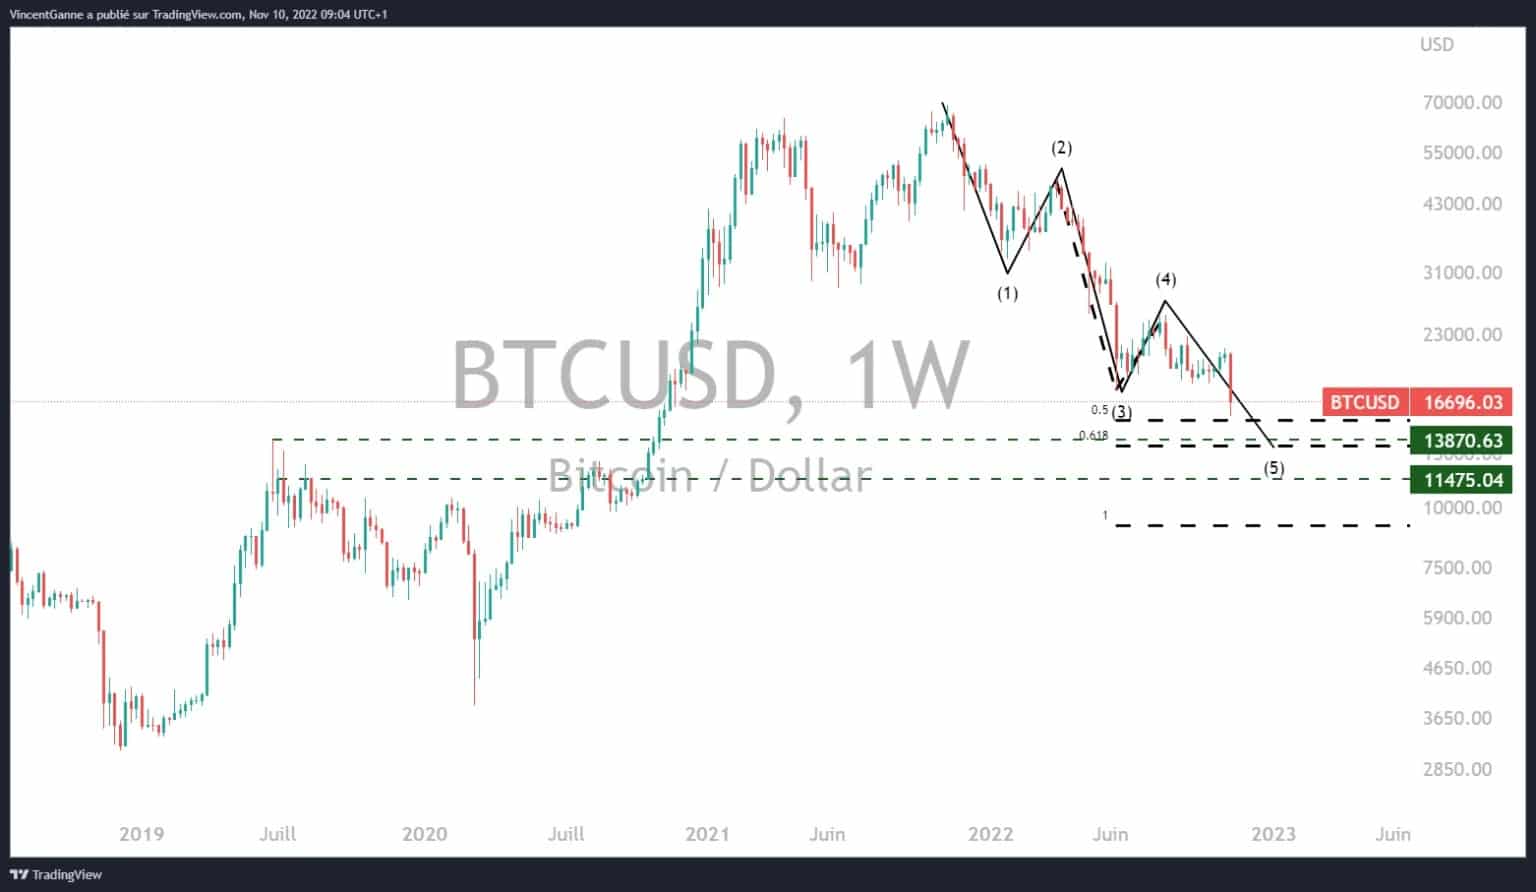
Chart showing the weekly Japanese candlesticks of the bitcoin price in logarithmic
Two charts that point to the long term interest zone of this latest purge
I have selected two charts that each in their own way represent the deviation from the mean of the Bitcoin price.
The common message is that in a market environment that rules out fundamental systemic risk, then the Bitcoin price is very close to a very long-term buy zone.
It is therefore imperative that a financially reliable solution is found for FTX, as otherwise the market would enter a technical no-man’s land, which would signal the end of the bullish momentum started more than 13 years ago.
This first chart shows that a support line is in sight on Bitcoin’s drawdown percentage from its former all-time high.
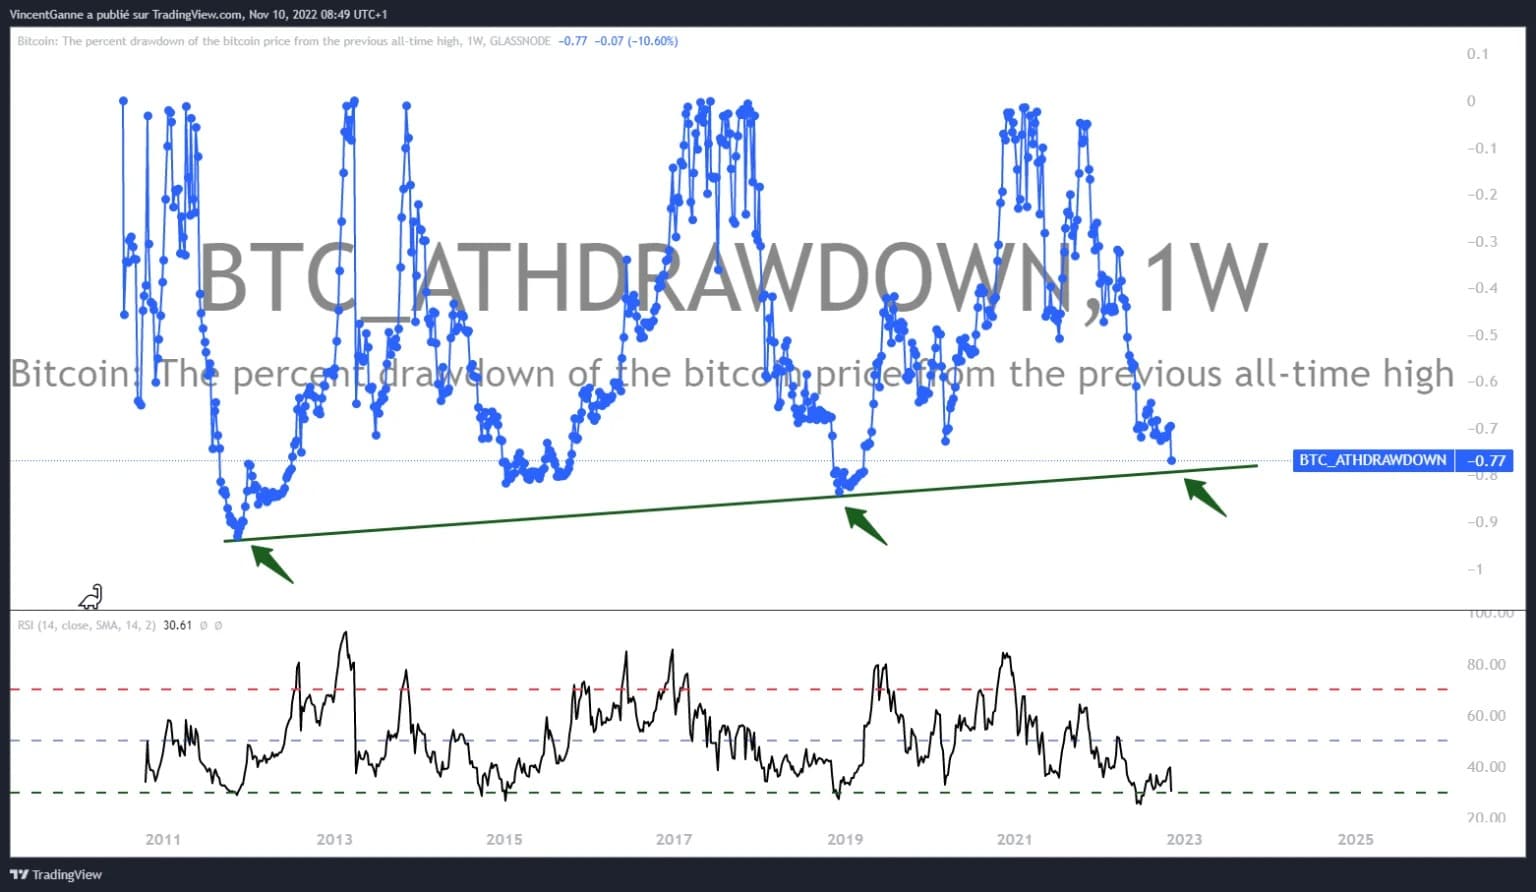
Chart that exposes the % drawdown curve of BTC since its former historical return (ex-ATH)
This second chart should remind you of the Stock To Flow model, but it’s a little different.
It is primarily a standard deviation representation that shows that if the market does not make a major bottom in the $10,000/$14,000 price area, then it will enter a technical phase yet unknown in its young history.
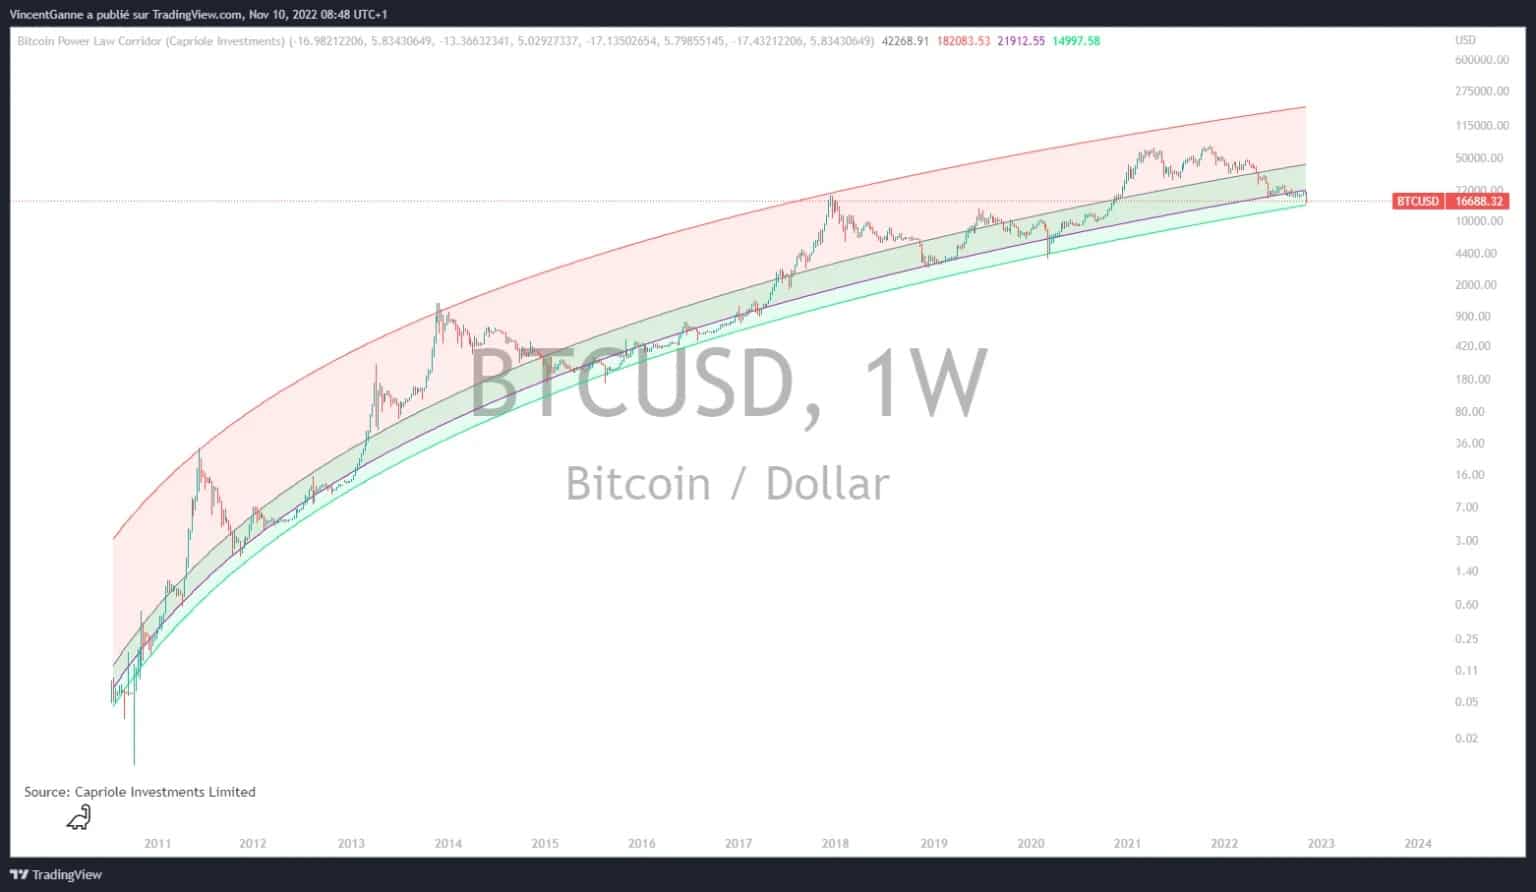
Chart exposing the Bitcoin Power Low Corridor indicator from Capriole Investments Limited