
While stabilizing throughout the week, Bitcoin (BTC) and Ether (ETH) remain stuck below major resistance. Calm before a new fall? Let’s take stock in our weekly analysis.
Bitcoin (BTC) struggles to break back above $17,000
This week, the price of Bitcoin (BTC) entered a range, with the price stabilizing between $15,000 and $17,000, after hitting a new low around $15,400. Investors are now waiting for a resolution of this range, in order to know the next move to come. As we can see on the daily chart, the BTC price is currently blocked by the Tenkan (in turquoise) which is acting as resistance. As it stands, the market bias remains clearly bearish, with a target break of the Bear Flag in yellow still at $14,300.
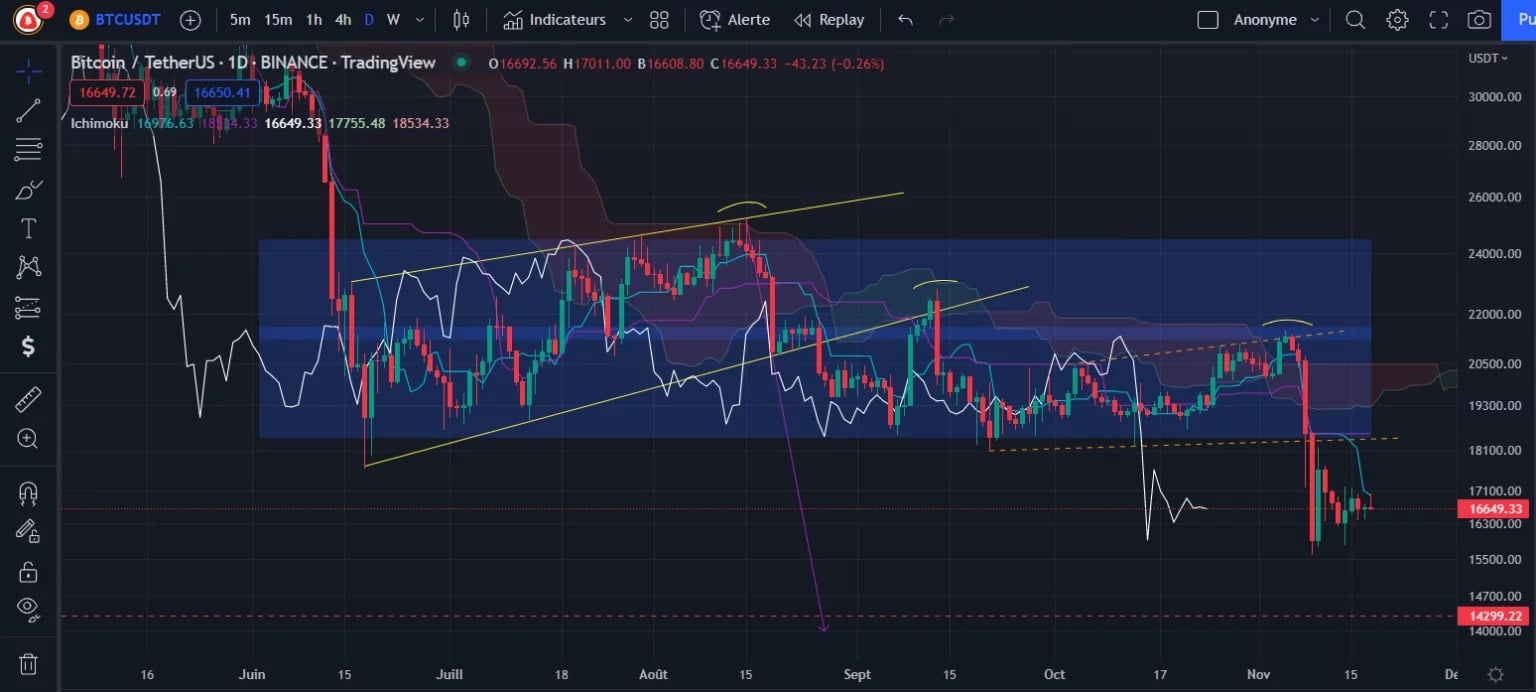
Figure 1 – Bitcoin Daily Price Chart
Our bearish scenario will remain valid as long as the price moves below the previous range at $18,500. For the time being, BTC therefore retains a high probability of falling and the target is all the more relevant as it also corresponds to an important weekly support at the 1.618 Fibonacci, also equivalent to the bottom of a Descending Bevel. To conclude, the Ichimoku system remains clearly bearish with price rejection on the Tenkan, then the cloud and Kijun standing in the way.
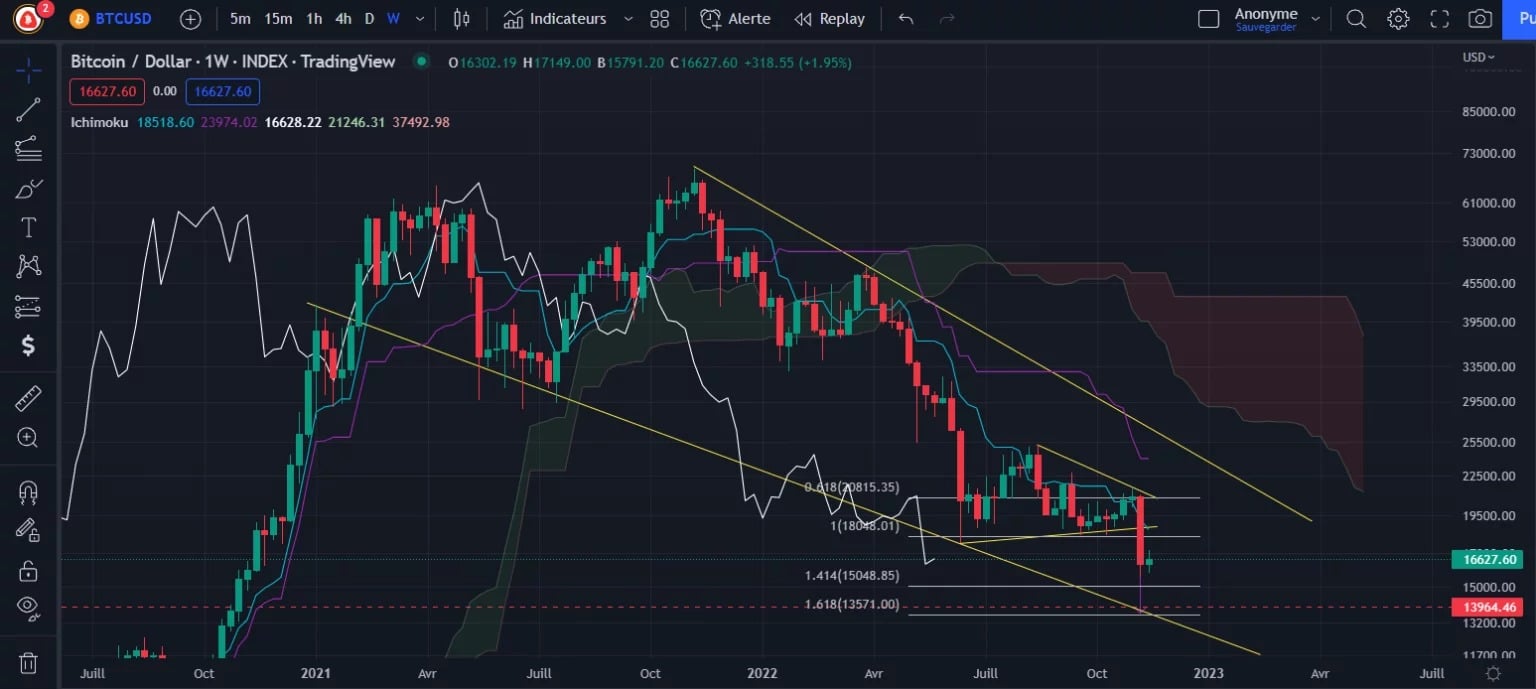
Figure 2 – Bitcoin Weekly price chart
So while $14,000 seems like a realistic target, investors looking for bullish signals will have to wait at least until the price re-crosses the weekly Kijun which forms a flat around $24,000.
Ether (ETH) under resistance, the plunge is coming
Like Bitcoin, Ether (ETH) is stuck at its Tenkan resistance at $1,220 and is under numerous other daily obstacles. Since our previous analysis, our bearish scenario remains largely valid and points to a very likely return of the price to around $762. This level corresponds to the height of the Ascending Bevel that was broken from below, carried over to its breakout.
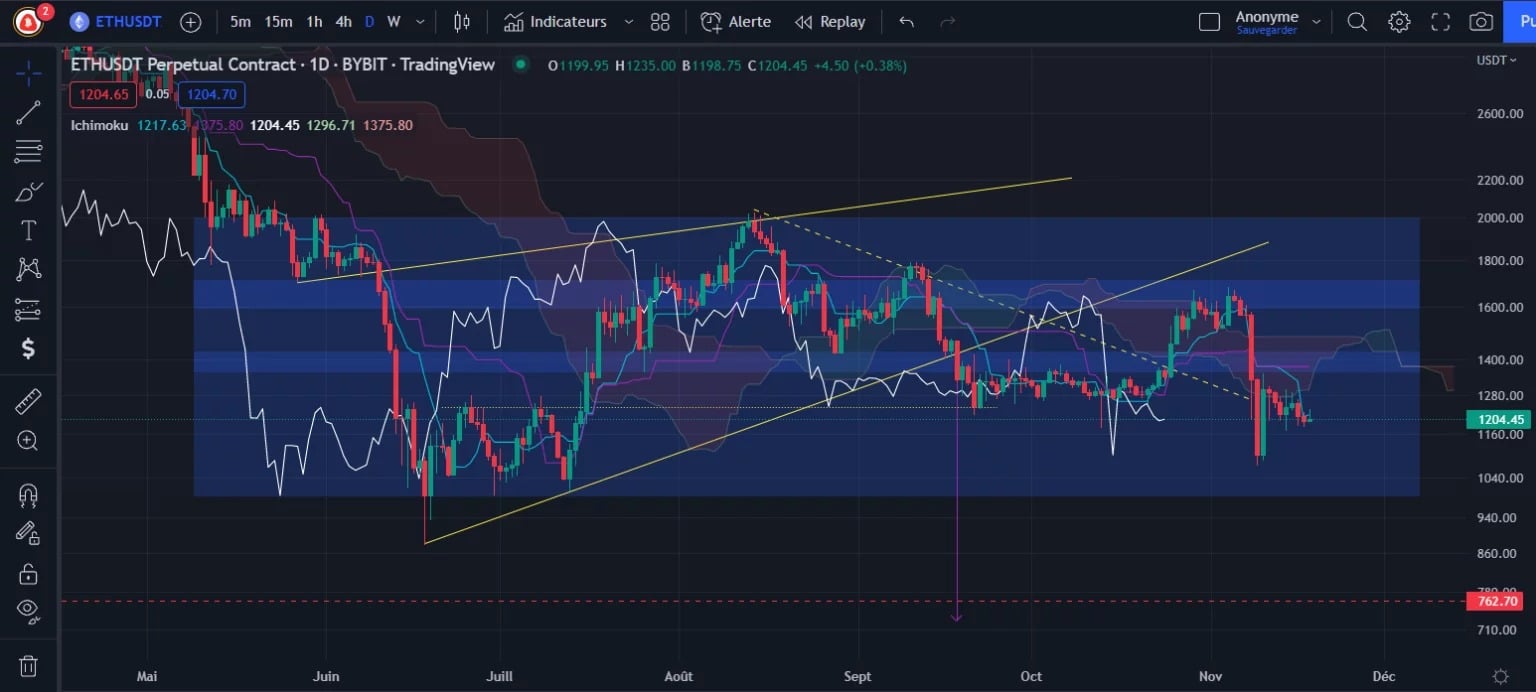
Figure 3 – Ether Price Chart (Daily)
So will the price manage to rebound? In any case, it will be necessary to break back above $2,000 to break the large daily range and finally aim for an exit from this long bearish dynamic. Unfortunately, many resistances remain on the way and a rebound in the current context seems very difficult.
Conclusion of this technical analysis
Bitcoin and Ether remain bearish with clear targets. As long as weekly resistances are not regained as support, then the fall should continue.