
This week, Bitcoin (BTC) and Ether (ETH) are trying to maintain their short-term bullish momentum. However, the crypto-currencies remain below major resistances that could yet block further bullish potential. What are the different scenarios to look forward to in the coming days
Bitcoin (BTC) is testing resistance
Once again, the price of Bitcoin (BTC) finds itself under significant resistance that prevents it from soaring. Although the price has resumed a short-term bullish momentum, the movement will remain fragile as long as it continues in the lower part of the range we have been monitoring for several months (blue rectangle).
To become truly bullish again in the medium term, we will have to wait for the price to regain the upper part of the range around $21,600 because until then, the upper trendline of the orange pattern and the middle of the range could well send the price back down to the bottom of the range at $18,500. Indeed, the middle of the range is acting as a strong resistance
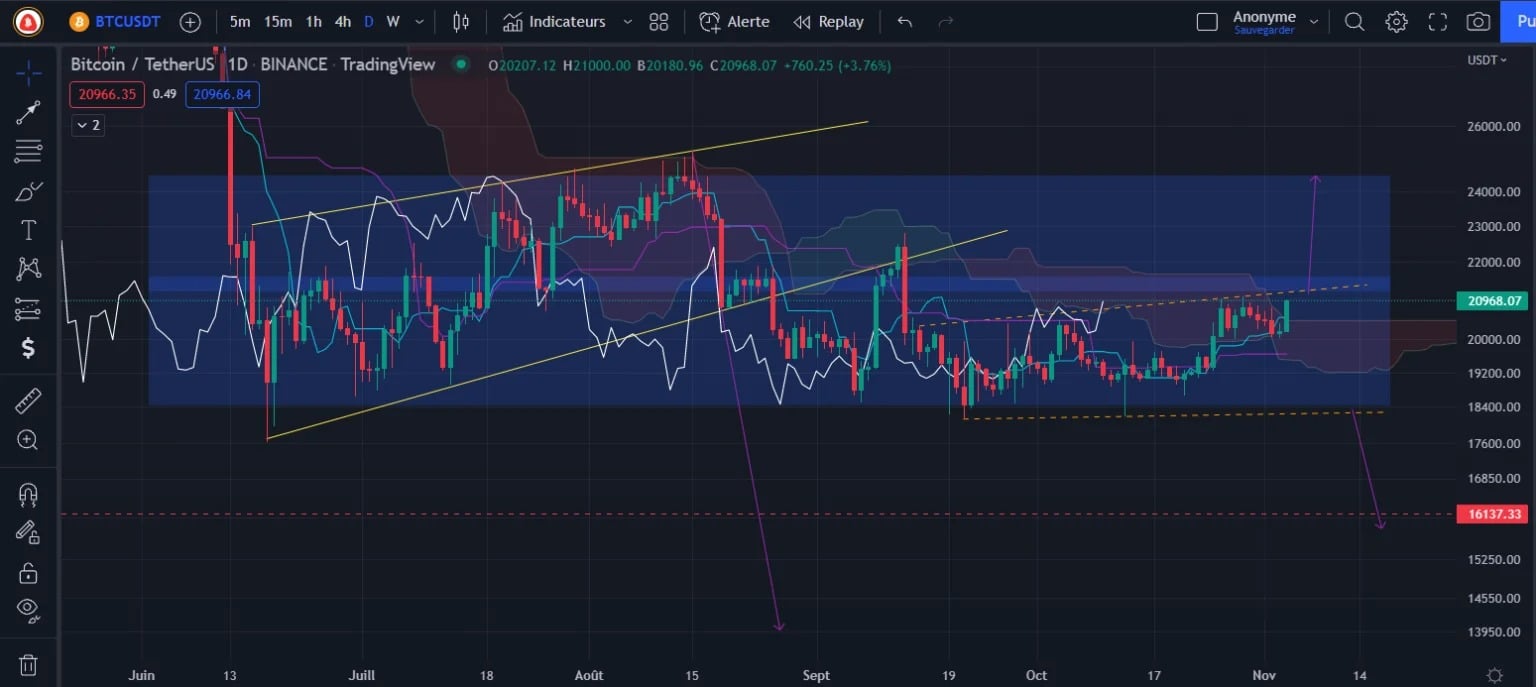
Figure 1 – Bitcoin Daily Price Chart
Since the orange pattern is an Ascending Widening, the odds are that it will be rejected either by the high trendline around $21,500 or by the Tenkan Daily on the current level.
In any case, we will have to watch the breakout which will give us the direction of the next move. We prefer the downside as the market structure also remains bearish with lower and lower highs. If the price breaks through the upward resistance, then we could see the price again looking for the top of the range around $24,500.
On the other hand, if the pattern breaks from below, then BTC should retest its support at $18,500 with a risk this time of breaking the range from below towards $16,100 (target break of the Ascending Beam in yellow).
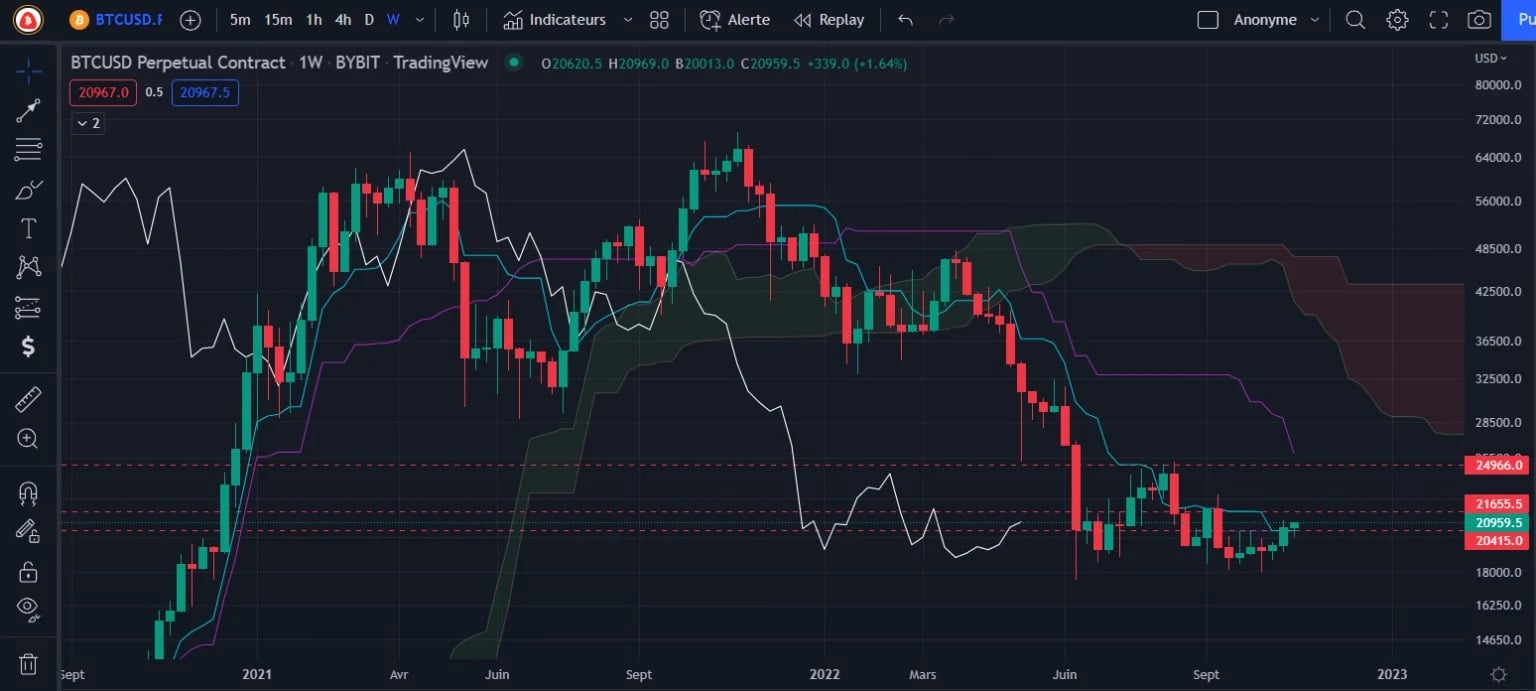
Figure 2 – Bitcoin Weekly Price Chart
To finish this analysis of Bitcoin, the Weekly Ichimoku gives us many resistances that need to be regained.
As a reminder, a first reversal signal would be to regain the Kijun Weekly at the close. But all flat Tenkan and Kijun being difficult levels to retest, we will first have to be vigilant below $21,655, then $24,966 which could well send the price to new lows.
Ether (ETH) still stuck
The price of Ether (ETH) remains stuck between two Tenkan Weekly flats at $1,624 and $1,478 and will need to break one of the two to give us the direction of the next move.
If ETH regains these two resistances as supports then the price should finally move back towards the top of the range at $2,000. But as long as the price remains below Weekly resistance, then we should focus on the bearish break towards the bottom of the $1,000 range.
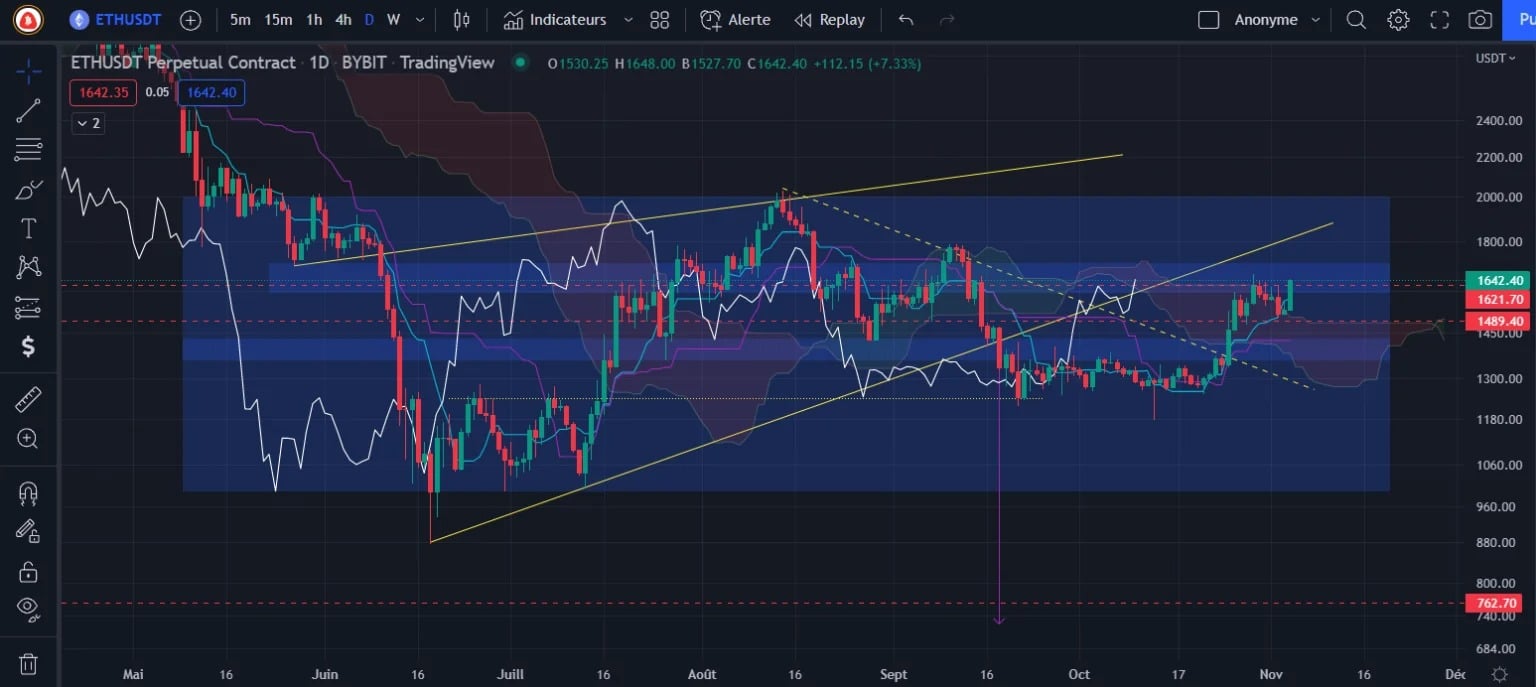
Figure 3 – Ether Price Chart (Daily)
Despite the bullish rebound of the last few days, this rise looks more like a correction before a new fall as Ether is still in its bearish range, with lower and lower highs. As a reminder, the break of the Ascending Beam in yellow had triggered a bearish target at $762, a target that still remains valid.
Conclusion of this technical analysis
Bitcoin and Ether remain below important Weekly resistances and could well be rejected in the coming days to go after the targets already triggered. We will have to wait for confirmations of bullish breaks to invalidate the targets which remain bearish for now.