
This week, the price of Bitcoin (BTC) and Ether (ETH) is still stable but starting to show interesting signals for a return of volatility. Is it time for another fall? Check out the different scenarios to watch for
Bitcoin (BTC) still bearish towards $14,000
While it has stabilized all week around $16,500, the price of Bitcoin (BTC) remains bearish with its chartist target at $14,300 which it had triggered by breaking a daily Bear Flag from below. The chart clearly shows us that the price is continuing its downtrend with highs always lower than the previous ones, and lows always lower as well.
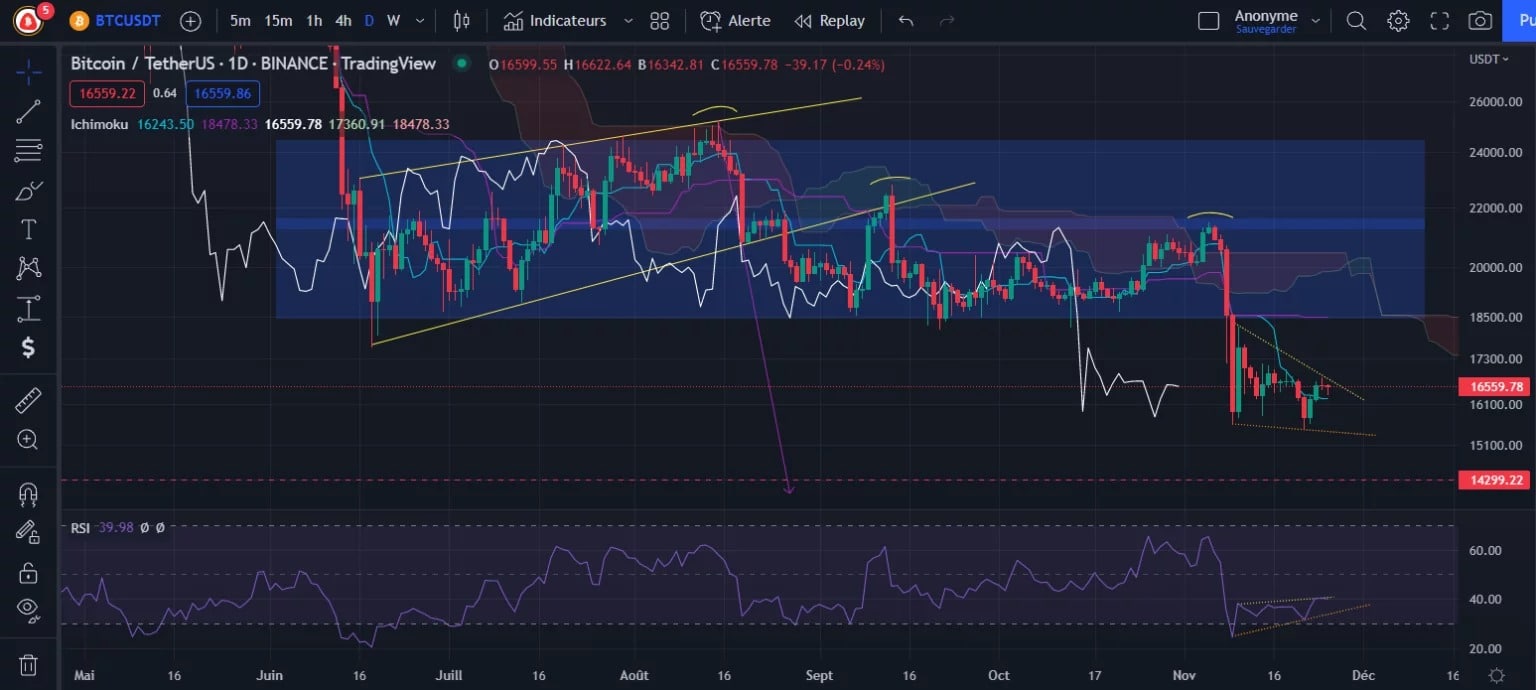
Figure 1 – Bitcoin Daily Price Chart
In the Ichimoku reading, the price remains under important resistances characterized by the Kijun (in purple) at $18,500 (bottom of the previously broken blue range which should reject the price on retest), and then the cloud which remains above the price. We can see that the Chikou Span (in white) is free of any obstacles and therefore does not prevent the price from continuing its fall.
The RSI then shows us two divergences. The first one is bullish and confirmed, while the second one (marked in yellow) shows us a downside possibility. In a bearish market with a target here determined at $14,300, it is preferable to favour bearish signals and therefore the bearish divergence.
Especially since this type of signal does not necessarily mean that a move is coming, it can simply be a price that stabilizes before resuming its initial direction, and this is what the price of BTC has done since the bullish divergence took shape.
Add to this the descending triangle that is forming (dotted lines) and whose breakout direction is very often from the bottom. Under these circumstances, it seems more likely that the decline will continue. However, if the price breaks its resistance at $17,300 and thus takes the bullish reversal path, then it could take off towards the Kijun at $18,500 before finally moving back towards the $14,300 target.
Ether (ETH) back to $1,000 range bottom soon
Despite its ongoing rebound attempt, the price of Ether (ETH) remains below significant resistance at $1,250 which has pushed the price back many times in the past. As it stands, the price is also moving below the Kijun and below the cloud, showing that the trend remains clearly bearish. Again, the Chikou Span is below all resistances and could block the price in case of any attempt to recover upwards.
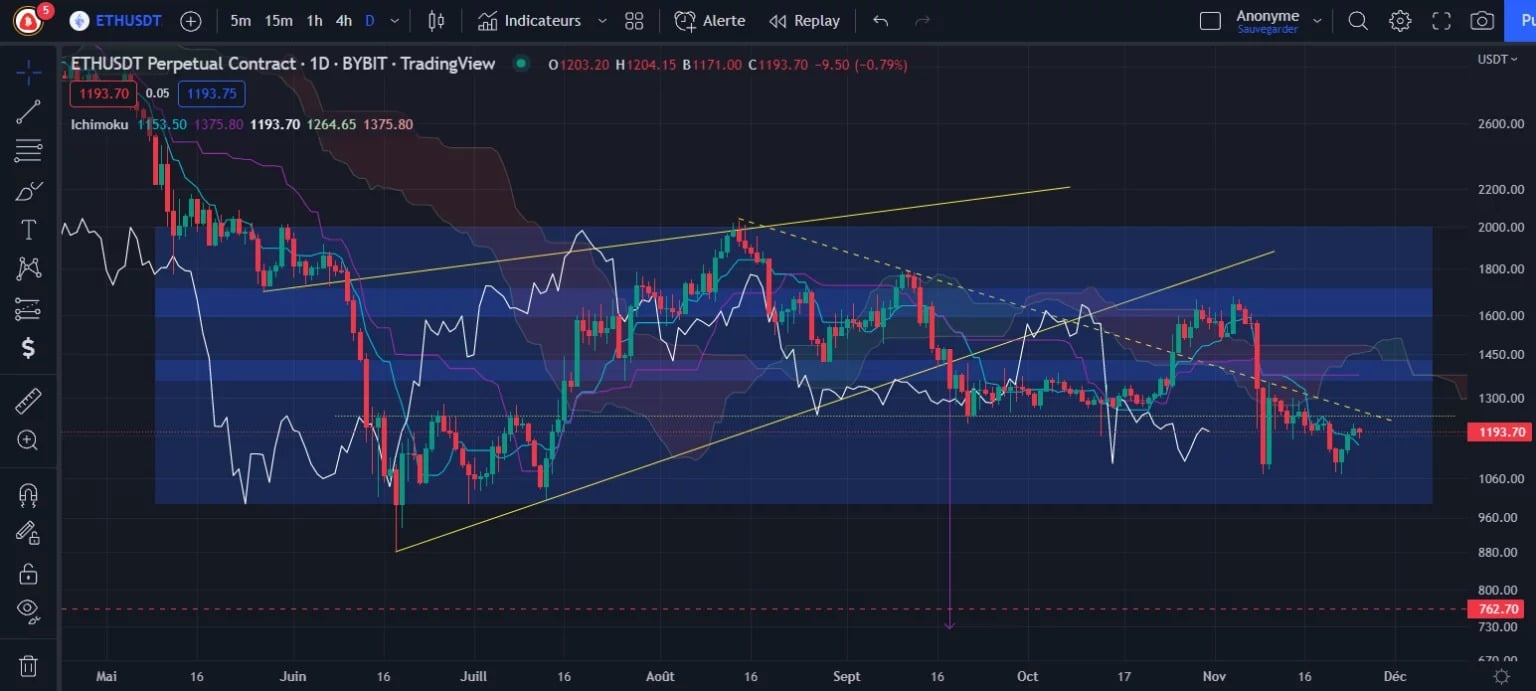
Figure 2 – Ether Price Chart (Daily)
As long as the price does not regain the $1700 level at the close, then we will not have a change in structure and the fall should therefore continue towards the bottom of the range (blue rectangle) at $1000, and then the objective of breaking the Ascending Beam (yellow triangle) towards $762.
Conclusion of this technical analysis
Bitcoin and Ether are stabilizing and setting up the next move. With the current signals delivered by the price and the various indicators, the fall does not seem to be over yet.