
As BTC attempts to launch a new bullish rally, short-term momentum remains positive but fragile. The zone between $101,000 and $120,000 contains significant supply that could halt the price’s ascent.
Attempt at a Bullish Rally
As the BTC price actively attempts to break through the $95,000 resistance level, it appears to be encountering some difficulties. Indeed, several rejections are slowing the price’s rise, although the overall trend remains bullish in the short term.
At the same time, notable selling activity is emerging, suggesting that some investors are choosing to exit the market without waiting any longer.
Will this selling pressure be enough to hinder BTC’s recovery?
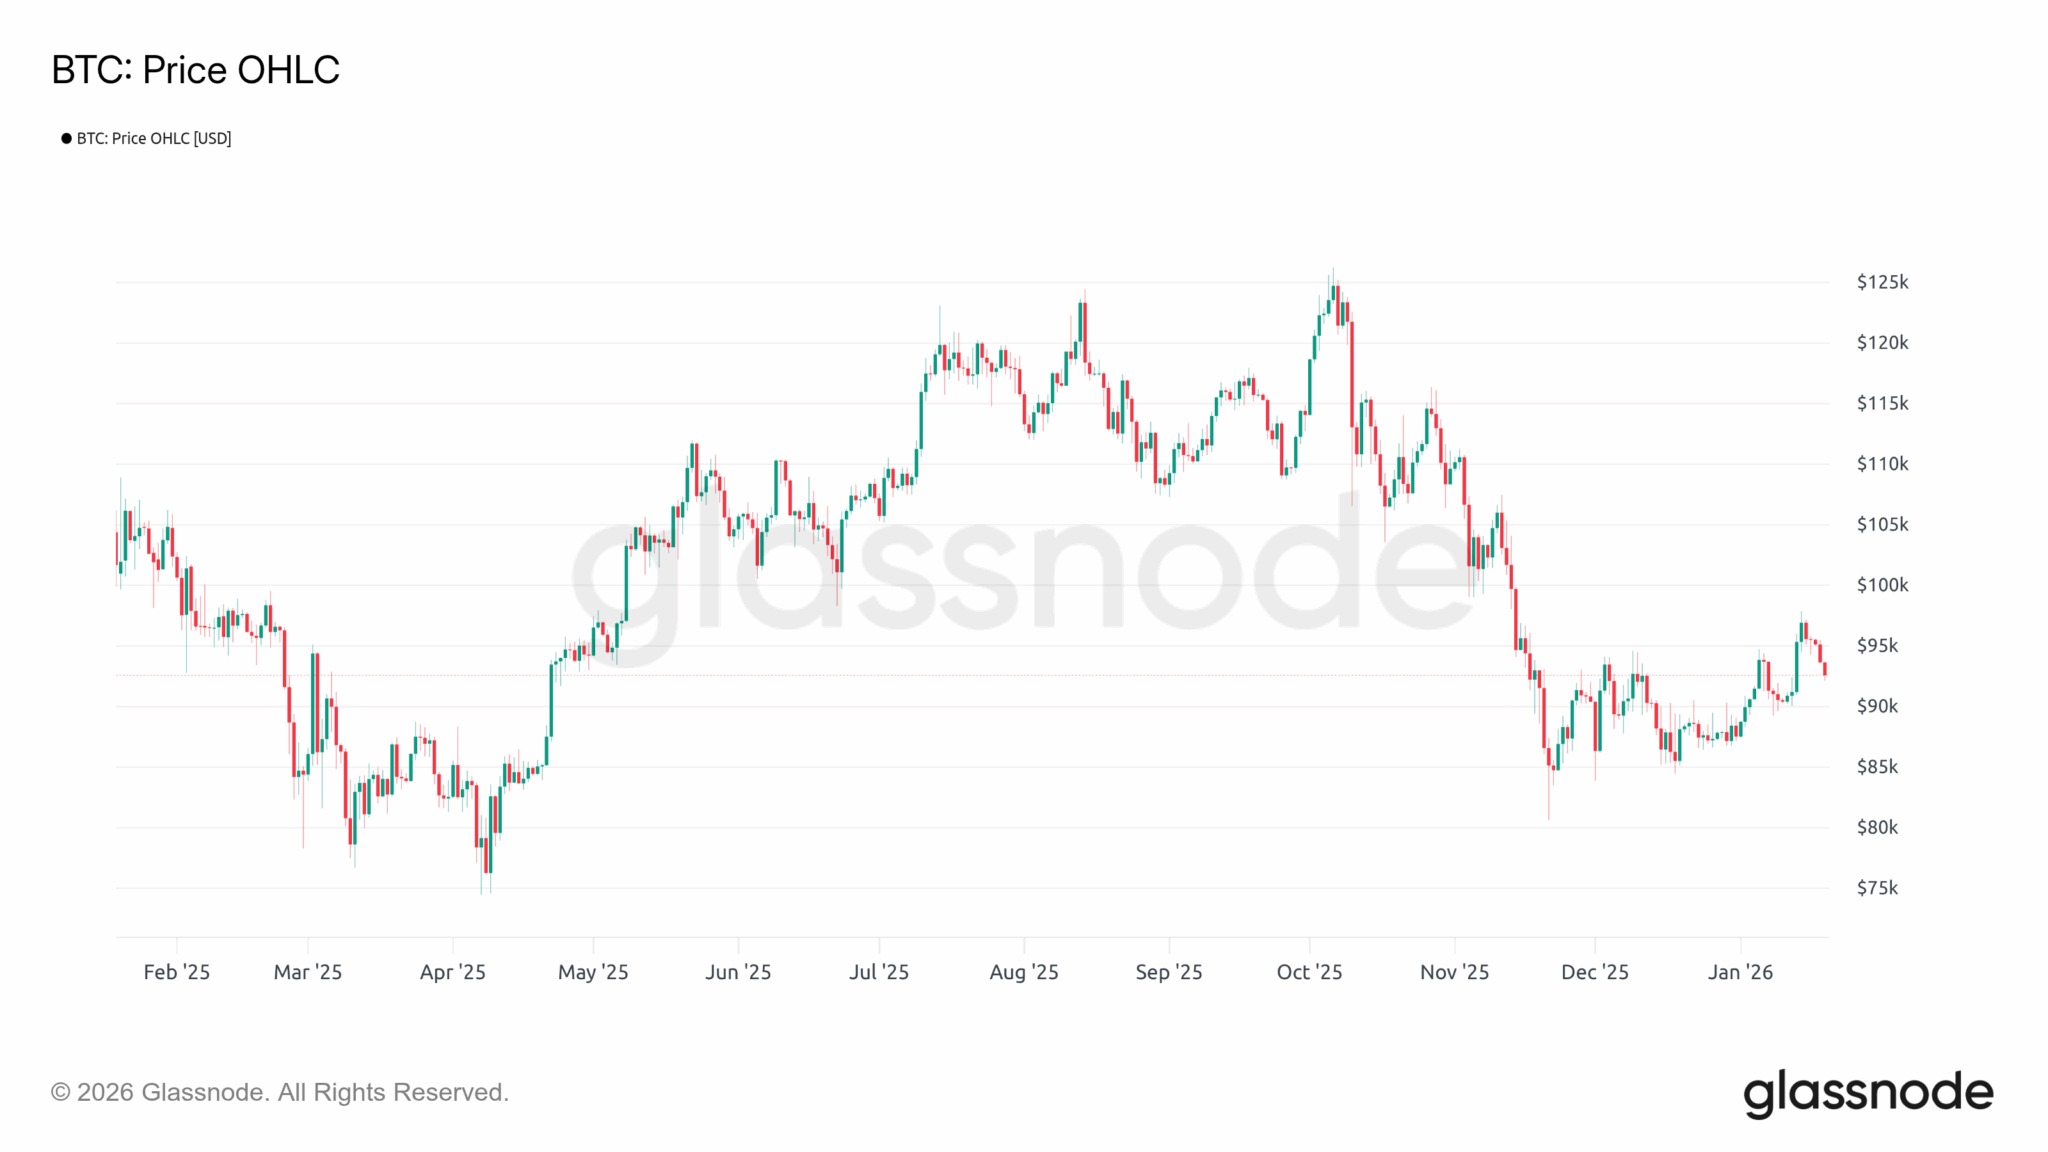
Figure 1: Daily BTC Price
Price Targets
For the first time in the 2023–2025 bull market cycle, the BTC price is trading below two key price levels:
- the “Fair Price,” which reflects the average purchase price of non-dormant BTC;
- the short-term average purchase price, corresponding to the average cost of recently accumulated BTC.
By falling below these thresholds in November 2025, BTC entered bear market territory before consolidating above $80,000.
The current challenge is to determine whether the market will manage to break above these two levels to reestablish a healthy uptrend, or whether they will act as resistance levels capable of halting BTC’s recovery.
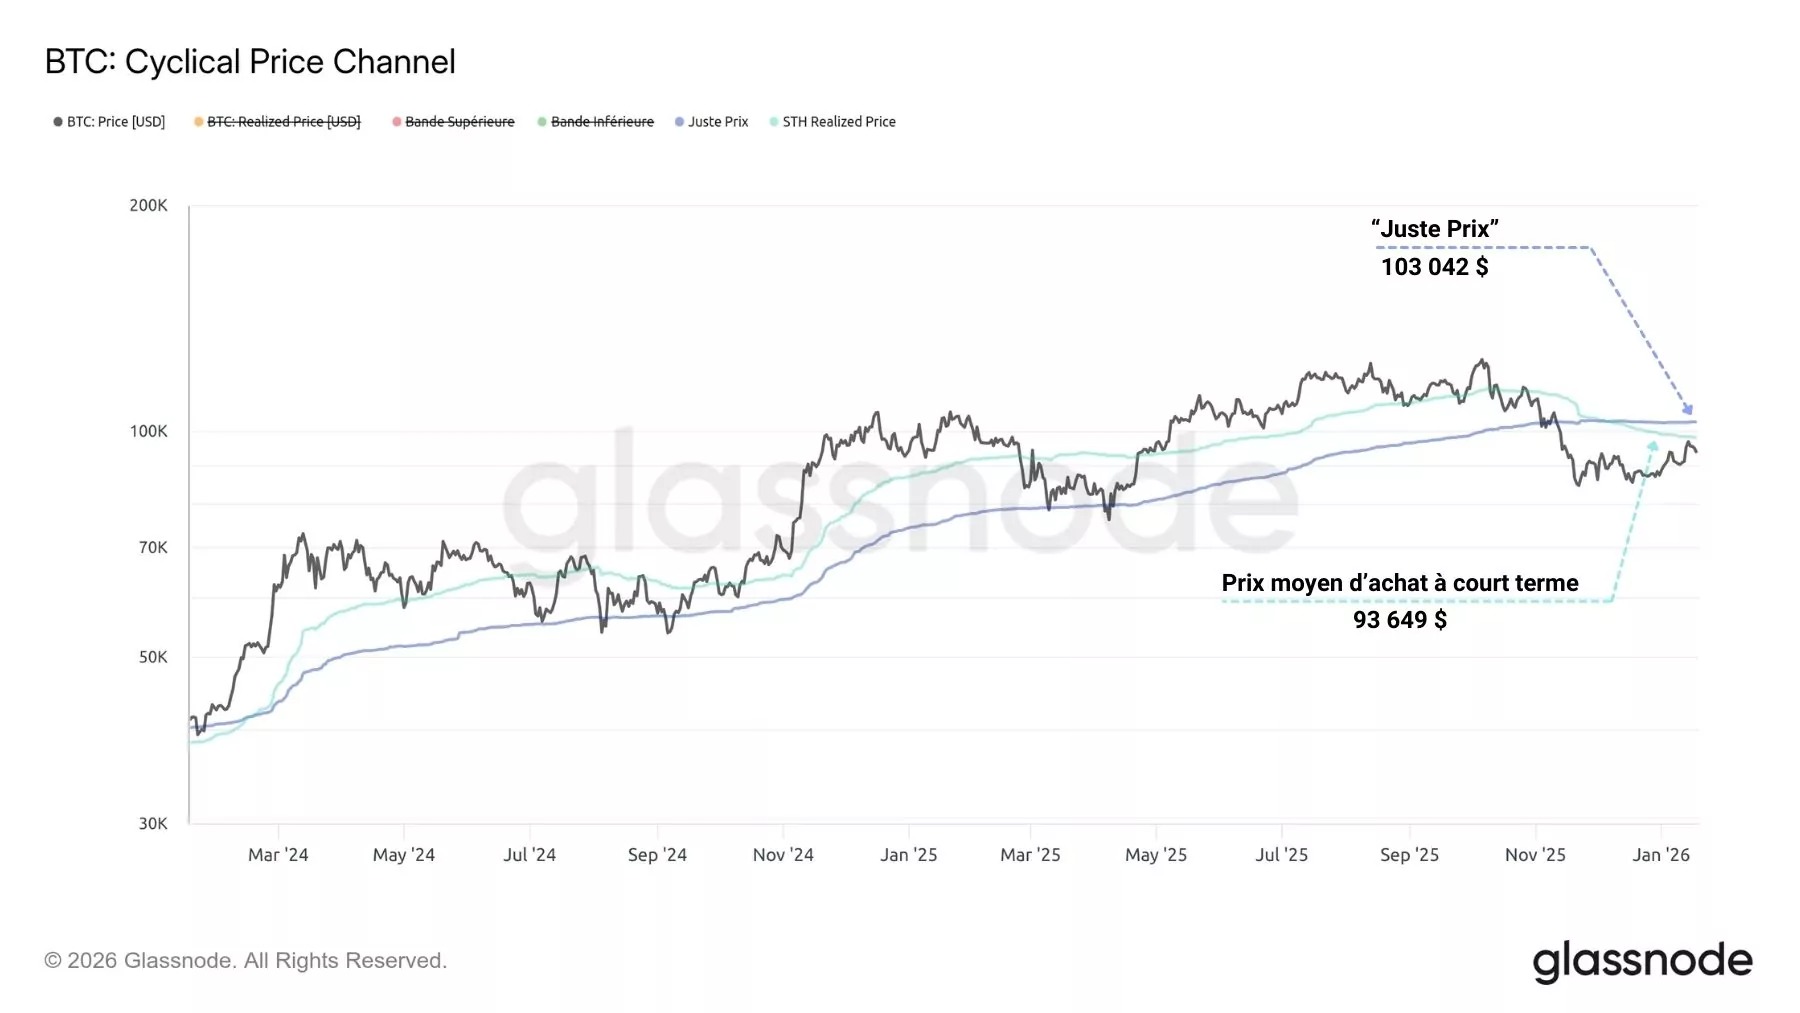
Figure 2: Fair Price and Short-Term Average Purchase Price
Thanks to the URPD, which tracks all BTC purchase prices during their most recent price movement, it is possible to map out a precise topography of the circulating supply.
This metric helps highlight areas where large amounts of BTC have been accumulated or distributed.
Currently, two major accumulation clusters can be identified:
- between $82,000 and $99,000, corresponding to the low accumulation zone, formed after the April–May 2025 correction;
- between $101,000 and $120,000, corresponding to the high accumulation zone, formed at the end of 2025, trapping late entrants in a state of unrealized losses and prompting them to cut their losses.
It should be noted that the short-term average purchase price and the “Fair Price” lie precisely at the boundary between these two supply blocks.
The BTC price will need to break through these levels and re-enter the cluster between $101,000 and $120,000 in order to maintain bullish momentum in the coming weeks.
However, it is highly likely that BTC’s rise through this accumulation cluster will take time, as this zone represents a potential supply area where some investors will seek to offload their holdings, anticipating a dead cat bounce scenario.
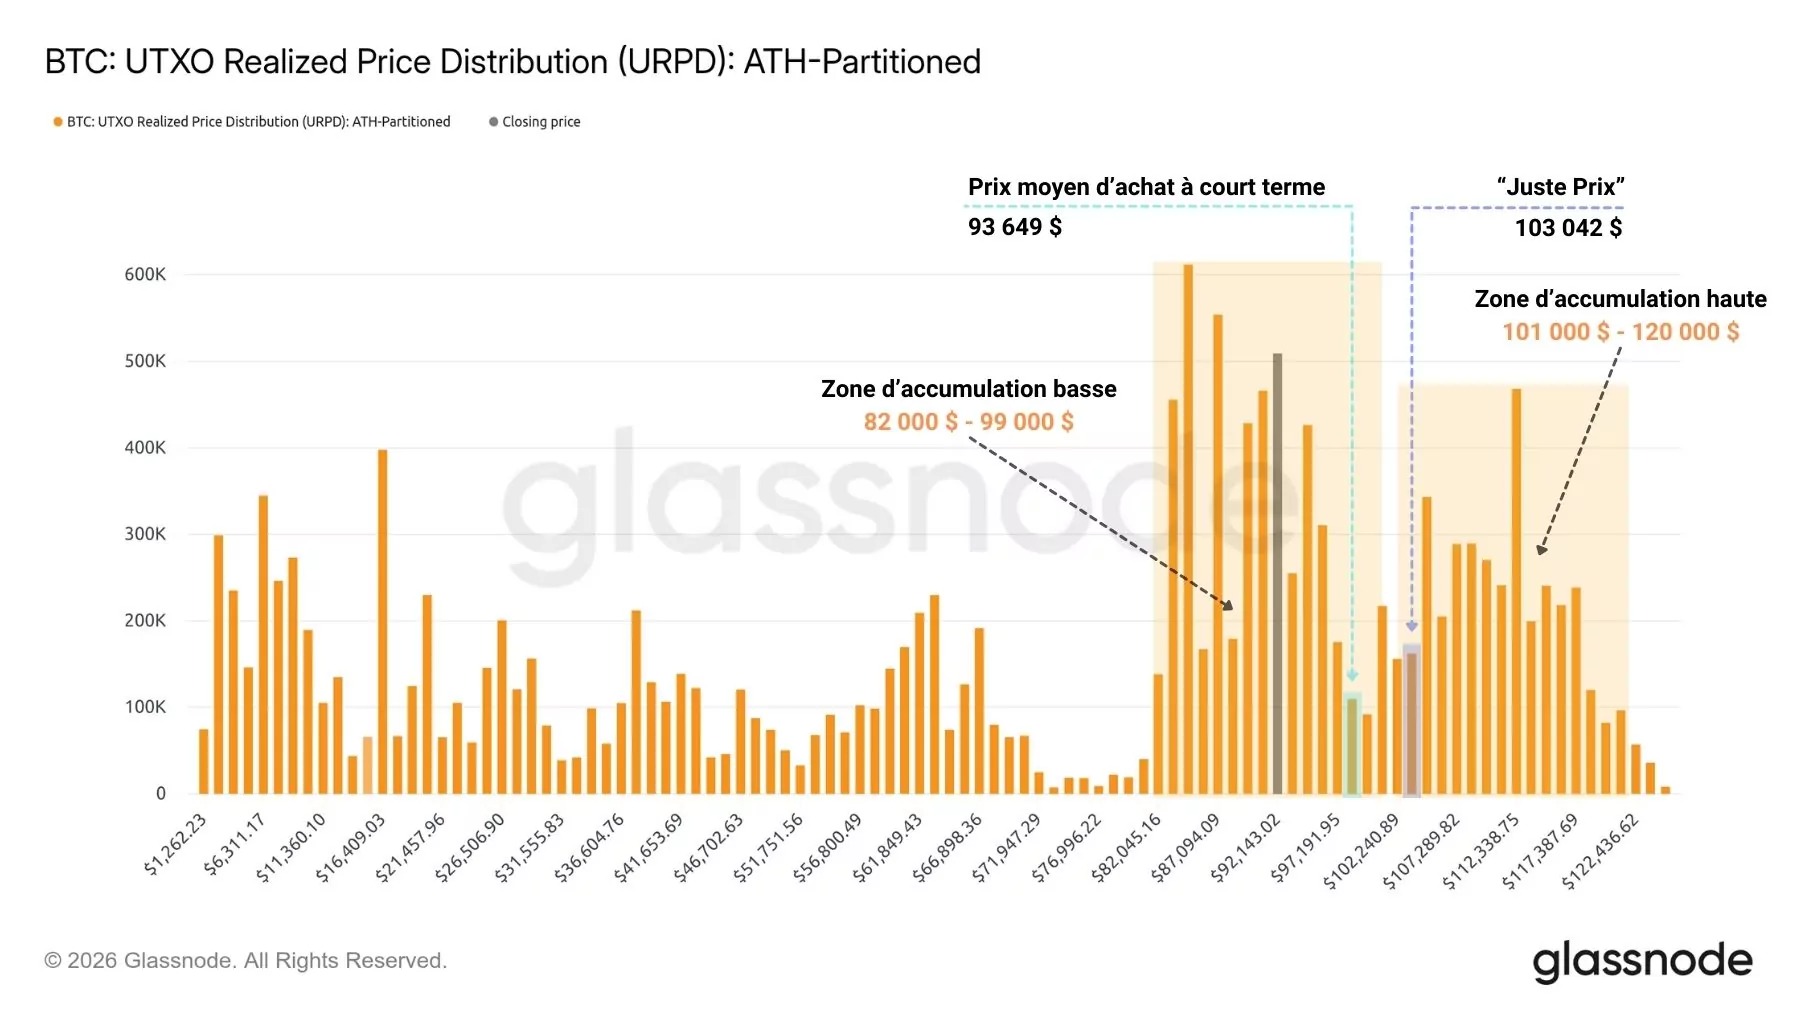
Figure 3: BTC Realized Price Distribution
Selling Patterns
It is essential to note that these potential selling patterns have already been emerging since BTC began attempting to break above $95,000, indicating that some investors are currently liquidating their positions.
In fact, the STH-SOPR—an indicator of the profitability of short-term investors’ spending—has recorded two new profit-taking peaks, coinciding with the two attempts by BTC to push higher observed during the month of January.
While this indicator’s return above 1 is a very positive sign regarding the psychological and financial conditions of short-term investors, it also indicates that each recent rally has been used to lock in quick profits.
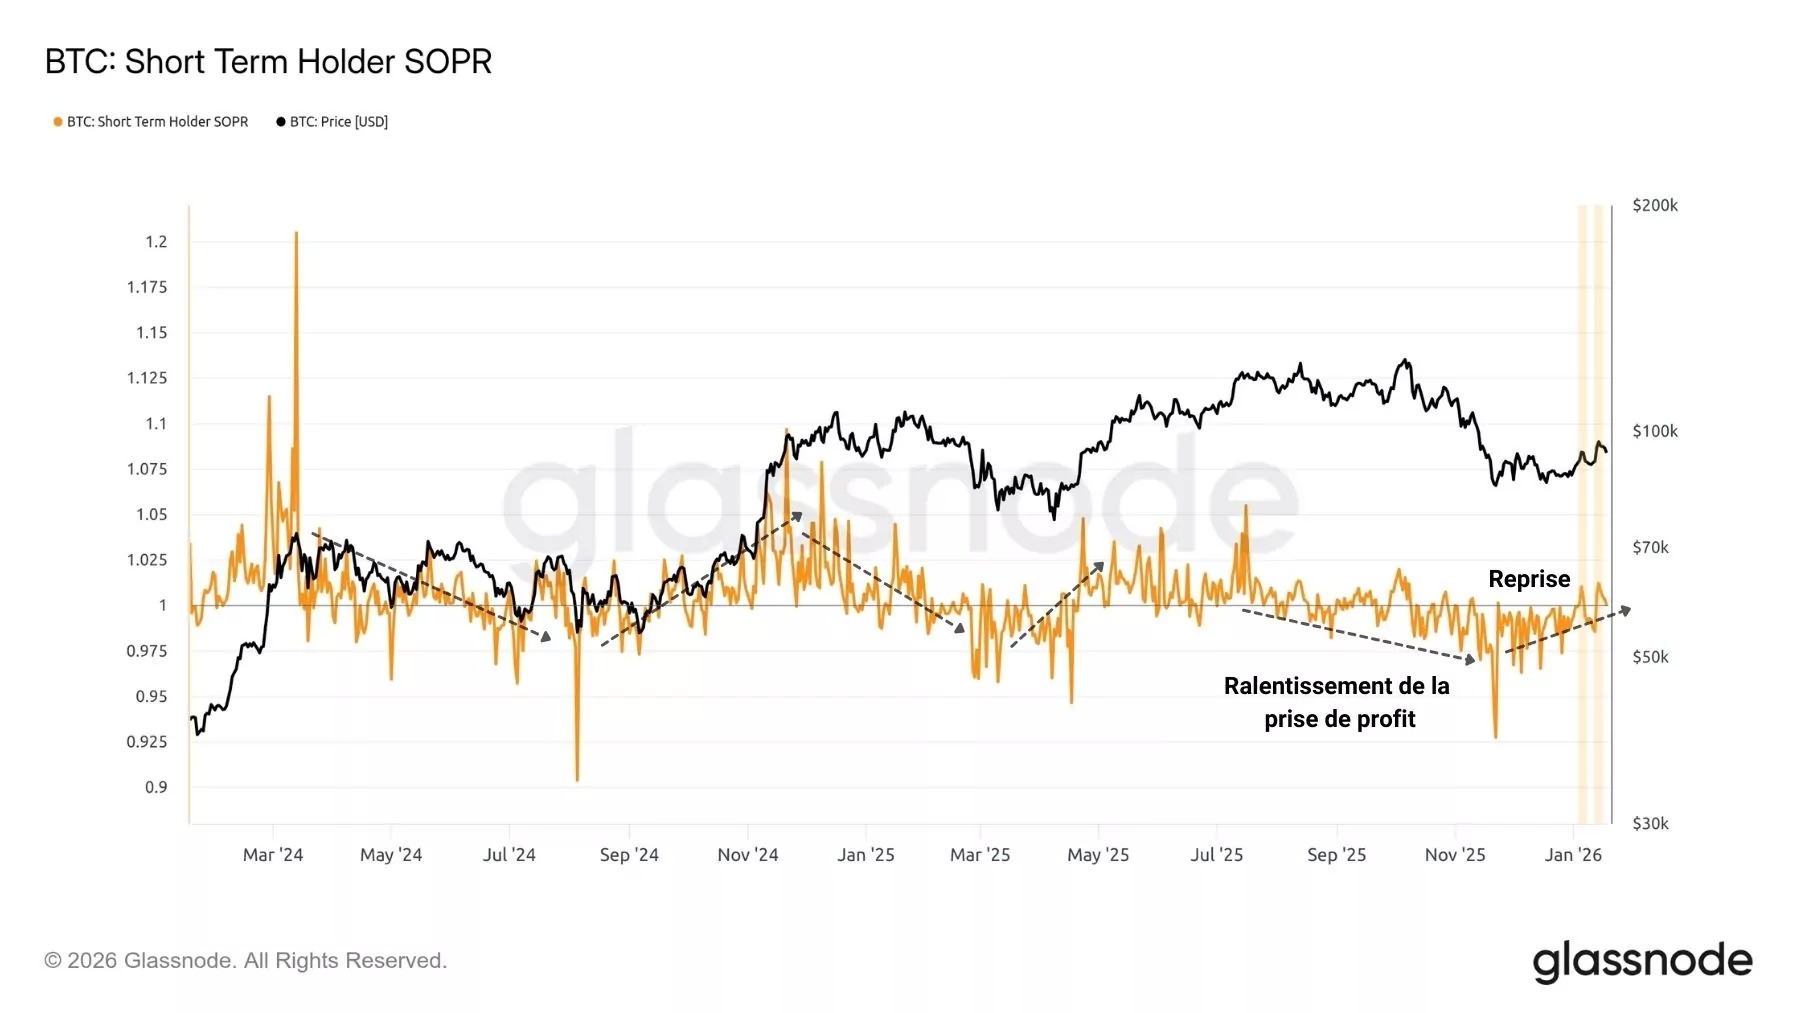
Figure 4: SOPR ratio for short-term investors
A similar observation can be made regarding long-term investors, whose return on investment also rose again in January.
Once again, profit-taking behavior appears to have coincided with the two recent upward surges in BTC.
This means that long-term investors have also taken advantage of the current momentum to lighten their positions—a sign that does not reflect optimal confidence.
A real battle thus appears to be brewing in the order books, pitting buying pressure against profit-taking, to determine the direction of the short-term trend.
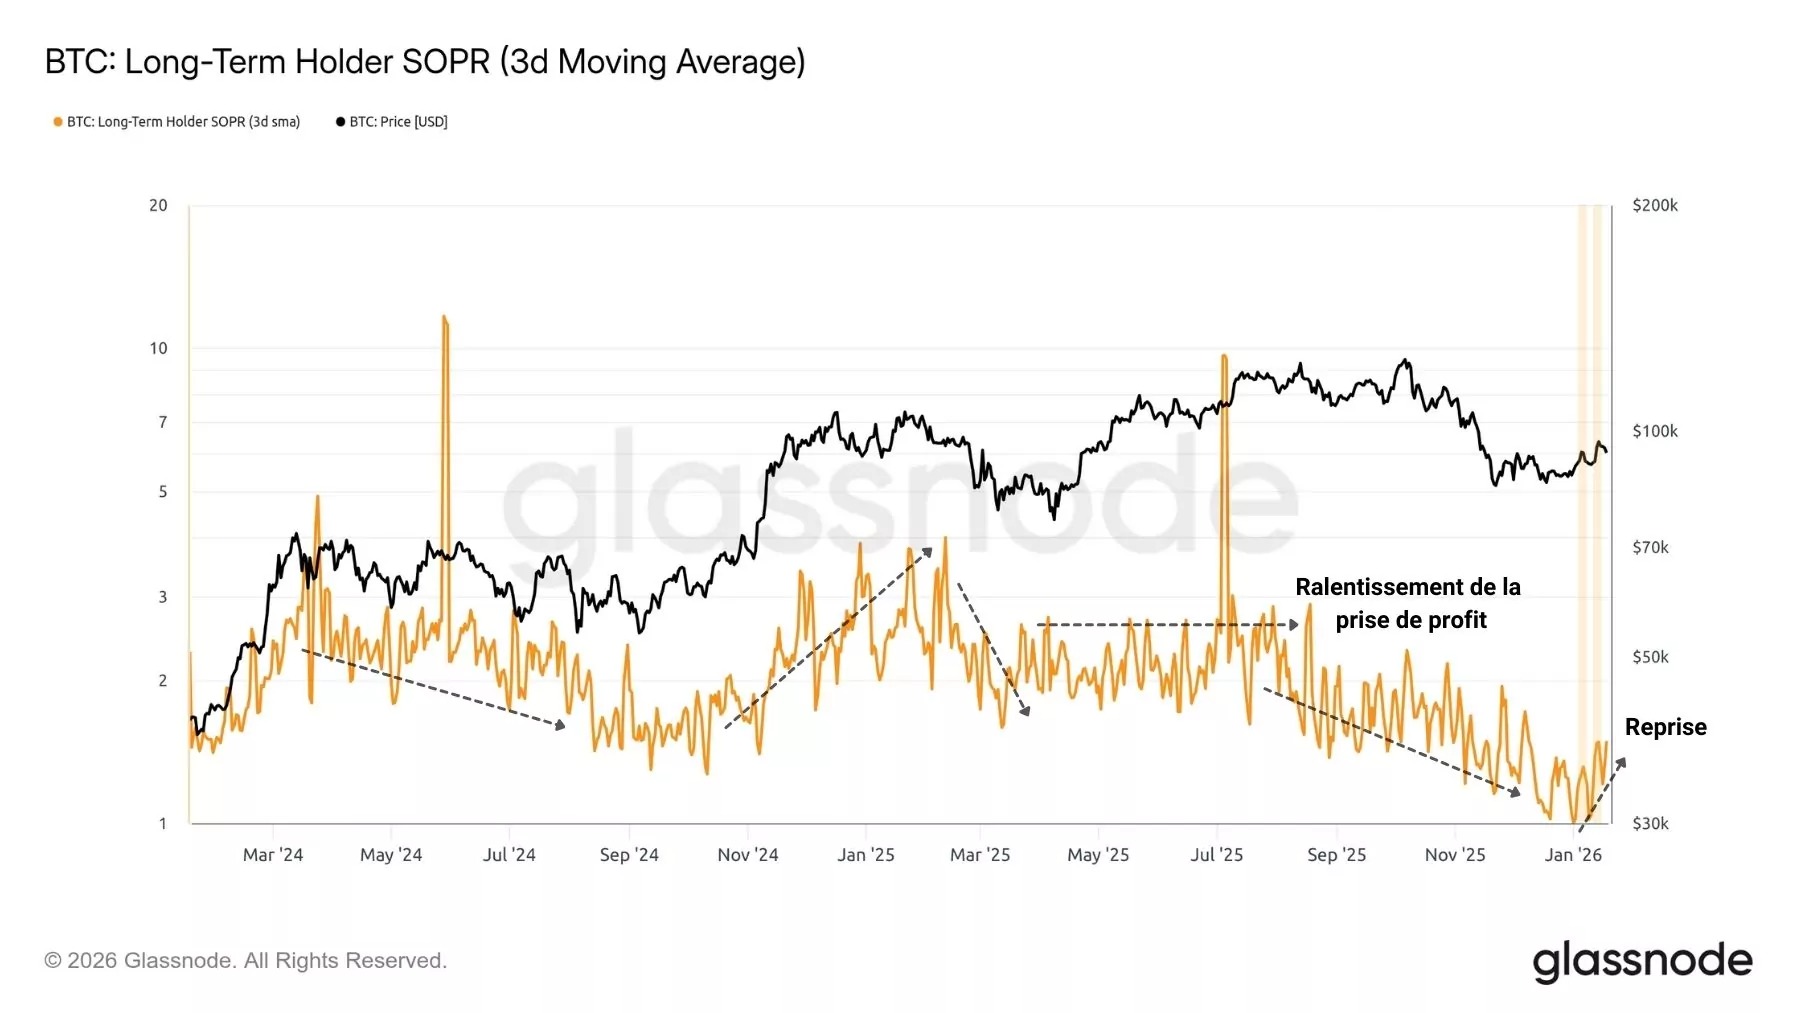
Figure 5: SOPR Ratio for Long-Term Investors
To illustrate this point, the on-chain model presented below aggregates various data points related to investor profitability and spending behavior to identify periods when selling pressure intensifies (shown in red).
Two distinct signals of significant selling pressure can be clearly observed: when BTC hit resistance around $95,000, and then when it attempted to break through that level.
This data confirms that substantial selling volumes were recorded at these levels, contributing to a slowdown in the local trend and a price correction.
Such behavior has been observed numerous times in the past and frequently precedes consolidation phases or even deeper corrections.
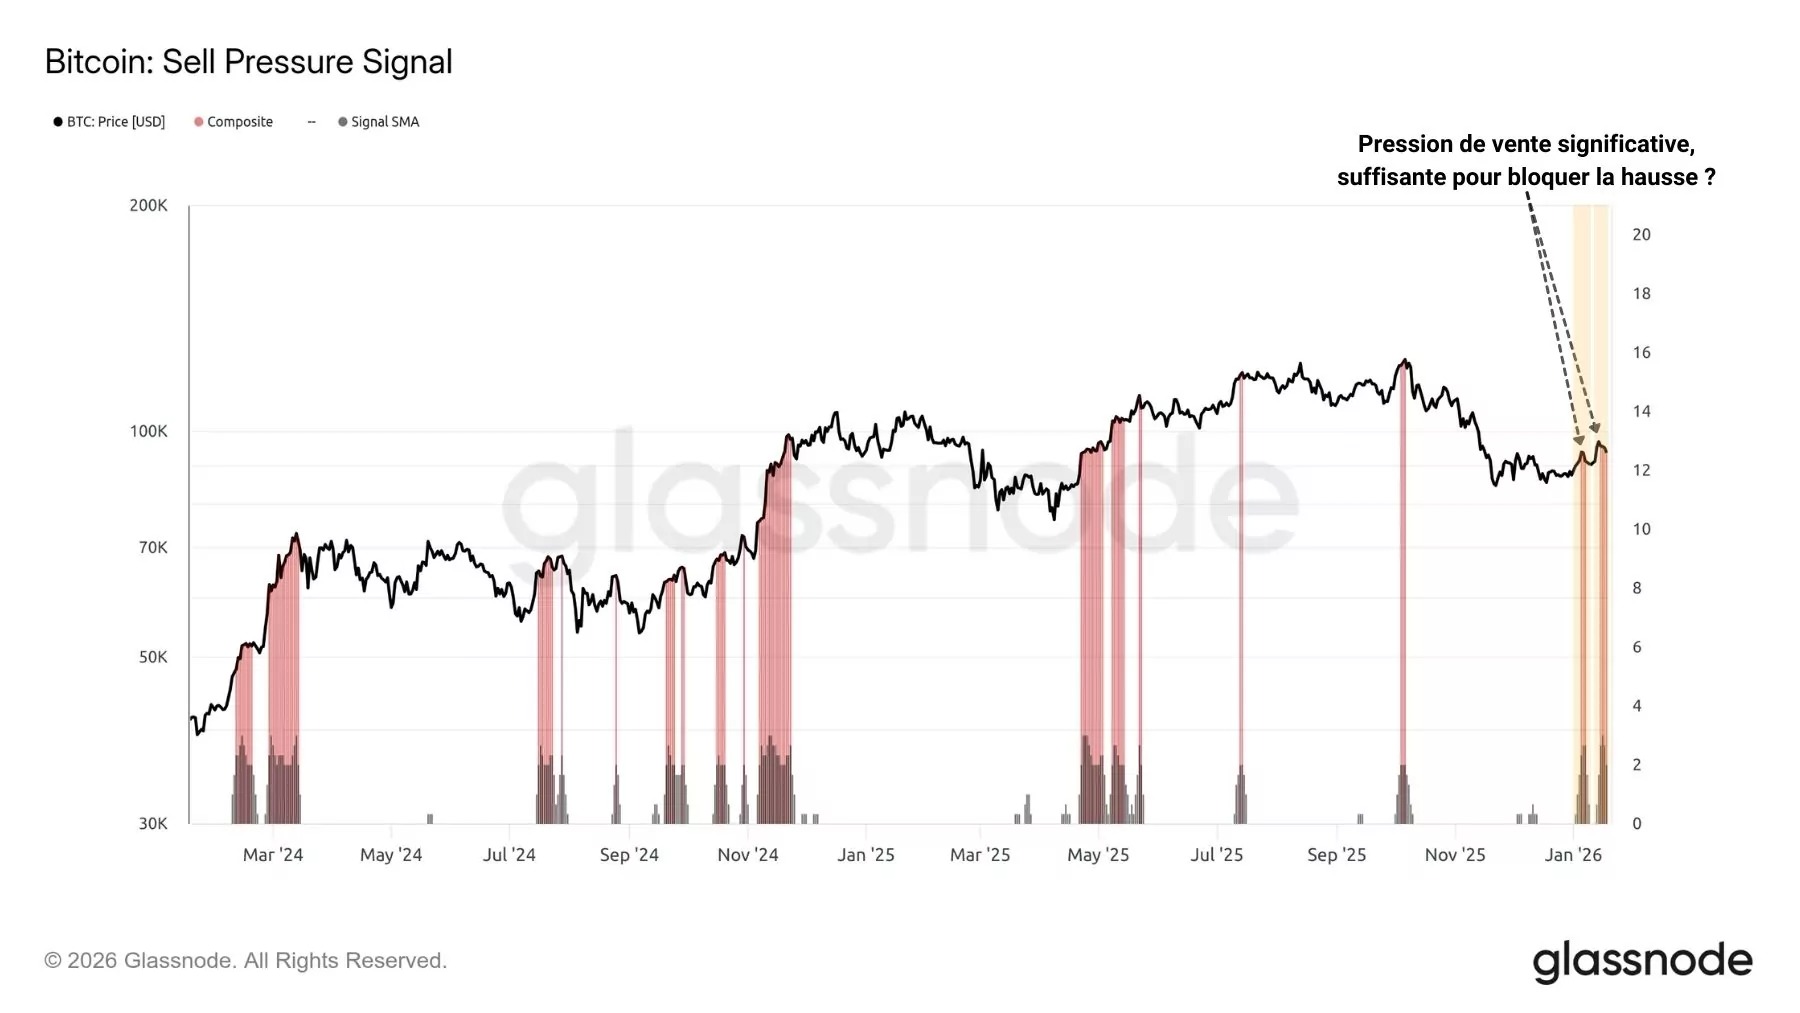
Figure 6: Model for detecting selling pressure
Finally, it is worth noting the recent liquidations of long positions in the derivatives markets, which also contributed to the BTC correction observed in recent hours.
With a significant amount of long liquidity having accumulated below the price since mid-January, this has created an excess of speculative risk that the uptrend could have easily done without.
The market currently appears to be seeking out this liquidity around the $90,000 level, below which lies a significant pool of liquidity that—to preserve sustainable upward momentum—it would be best to avoid revisiting.
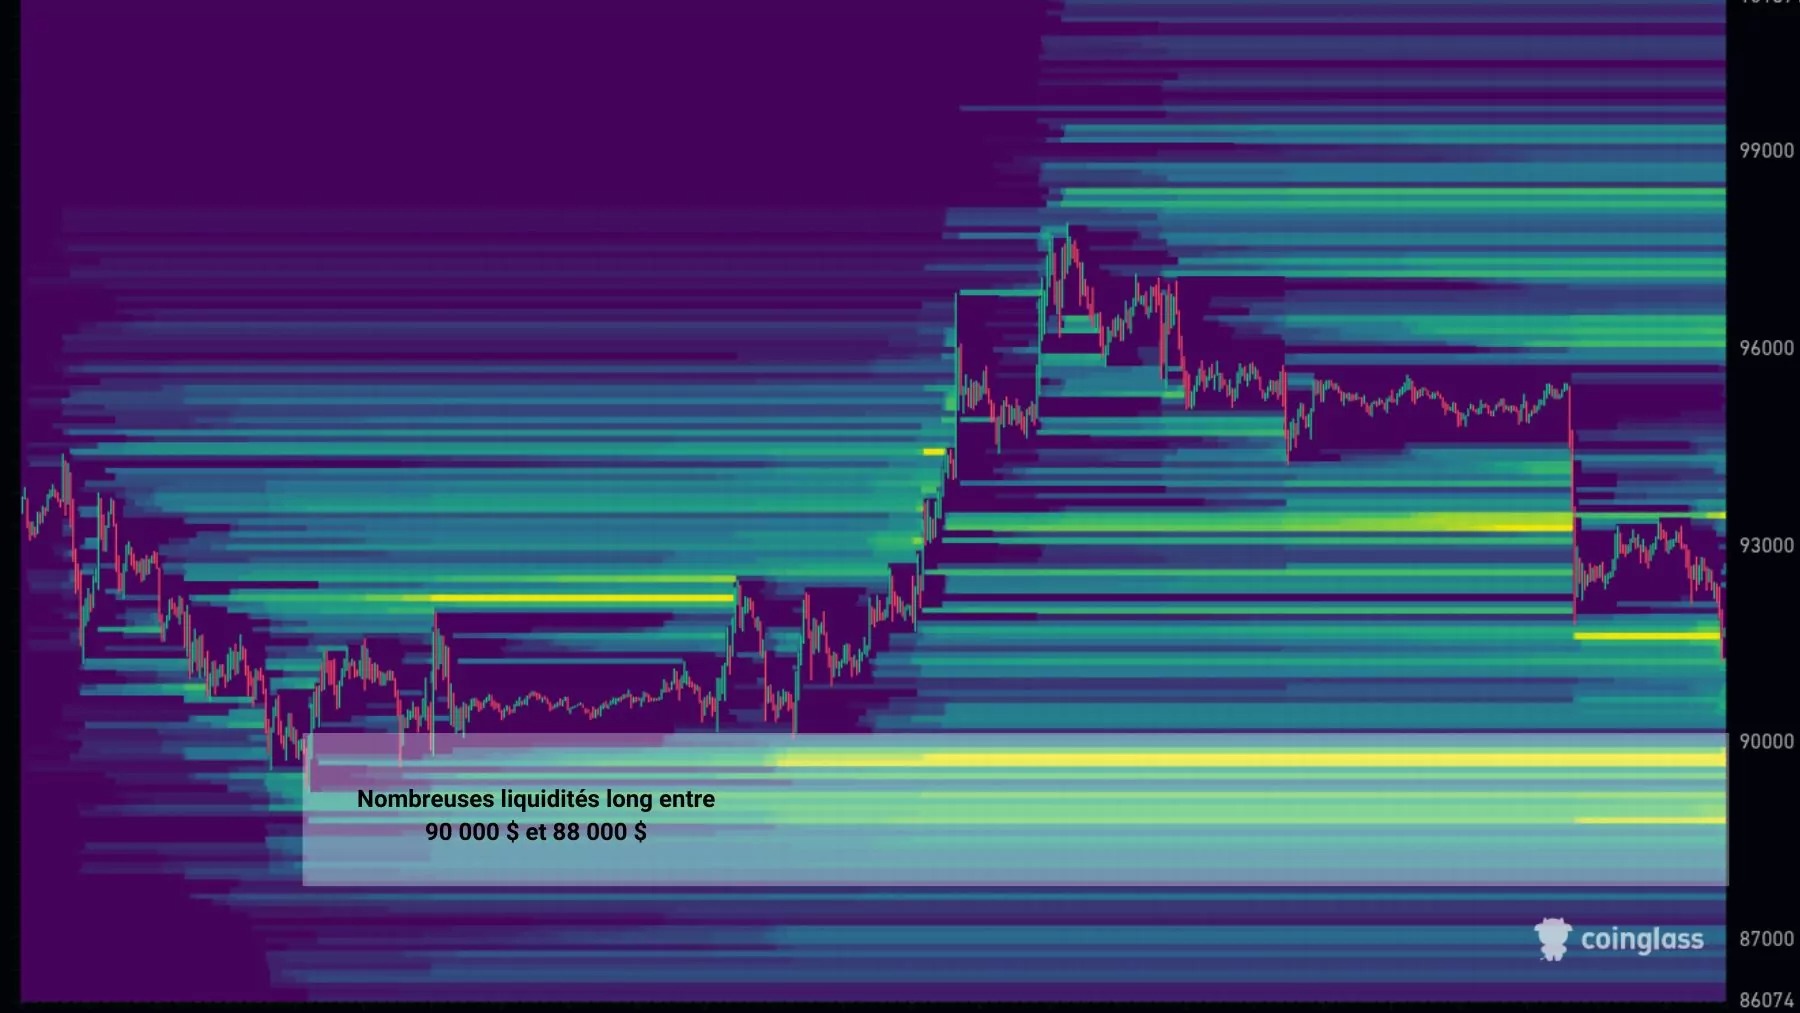
Figure 7: Liquidation thresholds in BTC futures markets
Summary of this on-chain analysis of Bitcoin (BTC)
As BTC attempts to break above the key $95,000 resistance level, short-term momentum remains positive but fragile.
While the on-chain structure suggests potential for a rally, the data shows that every bullish attempt is accompanied by significant profit-taking, both among short-term investors and long-term holders.
The zone between $101,000 and $120,000 now constitutes a major hurdle, concentrating a significant amount of supply that could halt the price’s rise.
In the short term, the balance between buying pressure and selling behavior will be decisive: either the market manages to absorb this supply and reignite sustainable upward momentum, or a consolidation phase—or even a deeper correction—could take hold.