
Caught between a weekly downtrend and a still bullish monthly dynamic, Bitcoin is evolving on a daily structure that could, under certain technical conditions, suggest the formation of a local low point.
End of the yen carry trade: episode 2
On Tuesday, December 2, 2025, at 11:03 a.m., Bitcoin is trading around $86,700, building sideways since the mid-November drop.
After selling pressure linked to the possible reclassification of Treasury Company within the main indices, the crypto market is suffering a double impact: on the one hand, news specific to its ecosystem, and on the other, macroeconomic tensions weighing on all risky assets.
Recently shaken by arbitrage linked to expectations of a fall in US interest rates, the market now faces a new threat: the imminent end of the yen carry trade, which looms with the announcement of a probable rate hike by the Bank of Japan, expected on December 19.
Back in August 2024, the market had already suffered a serious warning shot when this hypothesis first emerged.
Some analysts believe that the last 15 months have not been enough for institutions to prepare their exit, suggesting a new phase of decline for risky assets, particularly US technology stocks.
As a result, the market remains dominated by fear, as evidenced by Bitcoin’s Fear & Greed Index plunging into extreme fear territory.
In the Bitcoin derivatives markets, financing costs have settled into negative territory for the long term, a sign that fear is driving speculators to open more short positions.
While a final phase of decline remains possible, several technical signals suggest that there are levers in favor of a marked rebound. Among them, the short liquidity accumulated in the north could be a catalyst for an upward movement.
Bitcoin’s performance indicators essentially reflect the current sideways trend, with 7-day data showing slightly positive results. Against Ethereum, Bitcoin remains strong, posting positive performance across the three time frames analyzed.
Beware of the bull trap!
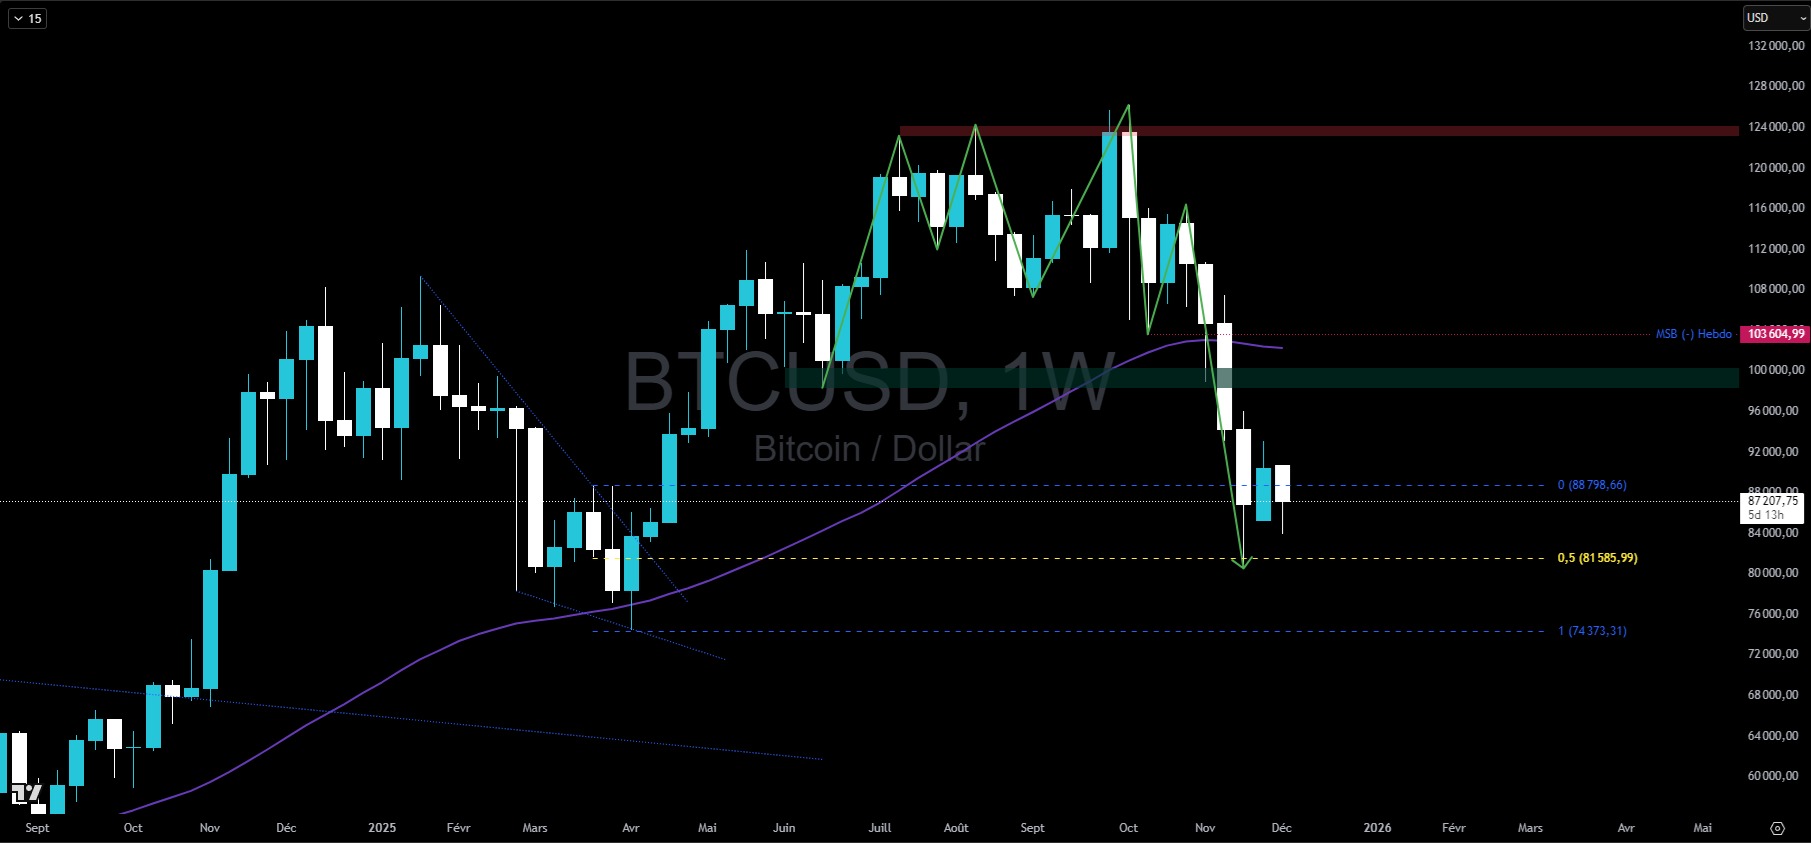
The weekly chart has changed very little since last week, but prices are firmly below the 50-week moving average and in the trading range for March and April 2025.
Technically, the break below the weekly SMA50 suggests that the rally is coming to an end. Until then, this dynamic support had managed to maintain the upward price momentum since March 2023. In 2021, as in 2018, the bear market began with a break of this indicator, retested upwards for confirmation a few weeks later, before several months of decline.
The current situation is therefore balanced between a still bullish monthly trend with a low of $74,000 and a bearish weekly trend since the $103,000 mark was crossed in early November.
As a result, the medium- to long-term evolution of Bitcoin is now playing out at $74,000.
The question that arises is whether the weekly trend will extend the decline to the monthly trend or, on the contrary, stem it and send prices back up by crossing the SMA50 again (shown in purple on the chart below).
However, it should be noted that in 2022, BTC restructured upwards, then developed a bull trap with a reintegration of the SMA50W, followed by a new break the following week, thus definitively confirming the 2022 bear market.
On the daily chart, the downward trend seems to have paused, but the 7- and 20-day moving averages are still aligned downward. Monday’s downward movement has initiated what could be a non-crossing.
If this is confirmed, then the flow could restart, sending prices back to the last low around $80,000 before potentially breaking through towards $74,000.
However, holding yesterday’s low, close to the 0.786 Fibonacci retracement of the last daily bullish movement, could allow us to materialize a higher low than the previous one.
These two bullish lows are not enough to validate a local low on Bitcoin, but if this pattern were to be confirmed, all that would be left to do would be to break through $93,300 to reverse the daily downtrend towards a movement that could initially take BTC to the $98,000 to $100,000 range.
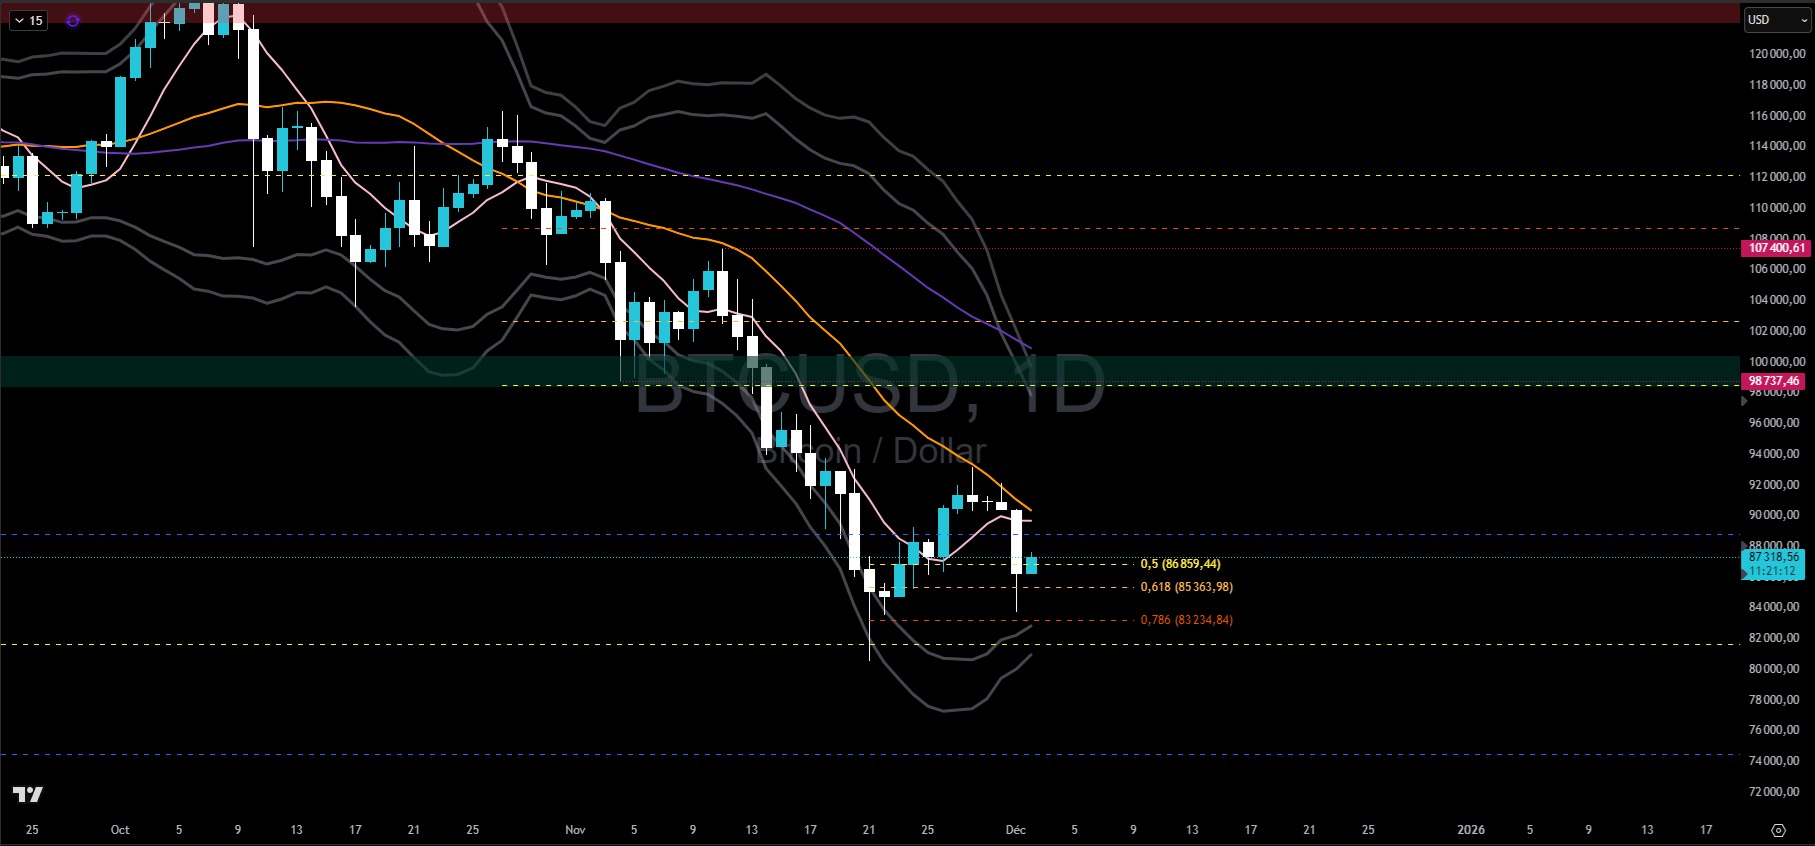
In summary, Bitcoin remains in a bearish trend. The daily configuration remains uncertain and potentially tricky, but if yesterday’s low holds today, the scenario of a bullish restructuring would only depend on breaking through $93,300. So, do you think BTC could reach $150,000? Feel free to share your thoughts in the comments.
Have a great day, and see you next week for a new Bitcoin analysis.