
Bitcoin has just gone through a historic episode that will leave a lasting impression, much like the yen carry trade or the crises linked to FTX and COVID. In a market that has been completely reset, could Bitcoin now be aiming for $150,000?
Earthquake and reset
It is Monday, October 13, 2025, 1:27 p.m., and Bitcoin is trading at around $114,000, down $10,000 since our last analysis.
Against the backdrop of a prolonged shutdown in the United States, the trade war reignited by Donald Trump has taken a new turn, causing a historic flash crash in the cryptocurrency market.
While Bitcoin price fluctuations have sometimes been much more violent in the past, the recent liquidity shock has hit the least liquid cryptocurrencies hard, causing falls of around 60%.
Numerous resources are now available to attempt to explain the scale of this correction, which has unfortunately caused heavy losses: the vast majority of positions opened in recent weeks have been liquidated.
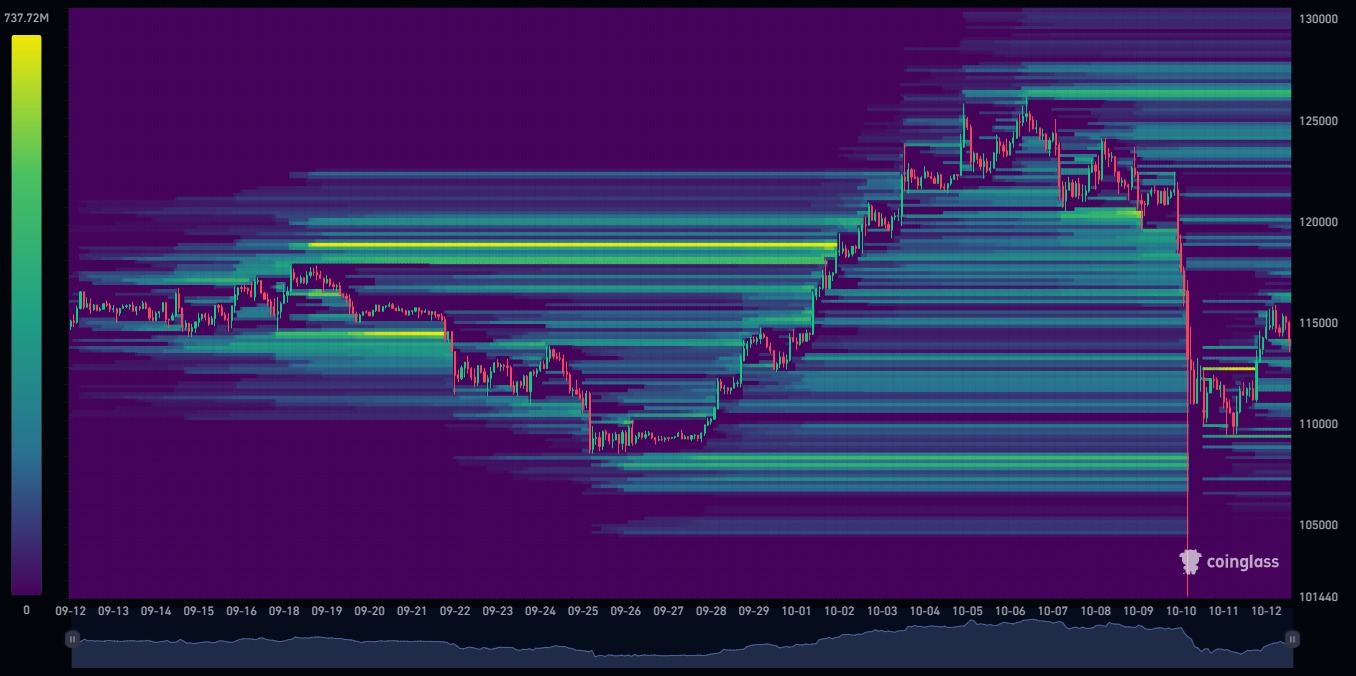
Last week, we highlighted the liquidity left behind during BTC’s meteoric rise from $108,000. A few weeks ago, we also warned about the excessive concentration of capital waiting between $103,000 and $107,000.
Today, there is nothing left.
The densest liquidity is now to be found either higher (around $120,000) or below $90,000.
In a market marked by a sudden and violent crash, some investors may succumb to irrational thinking, trapped in a bullish or bearish bias, and ready to risk what little capital they have left in a final “double or nothing” gamble.
We are entering a particularly perilous market phase.
Either the recent shakeout is beneficial, with the market perfectly positioned to launch an impulsive expansion phase, or the survivors will be seized by a thirst for revenge, generating new erratic movements until they are exhausted.
Bitcoin’s performance indicators appear mixed. In the short term, BTC seems to be starting to rebound, while slightly underperforming Ethereum. Over a longer horizon of between one and four weeks, the signals remain rather negative against the dollar, but remain favorable against ETH.
Cash hunt, reintegration, then what?
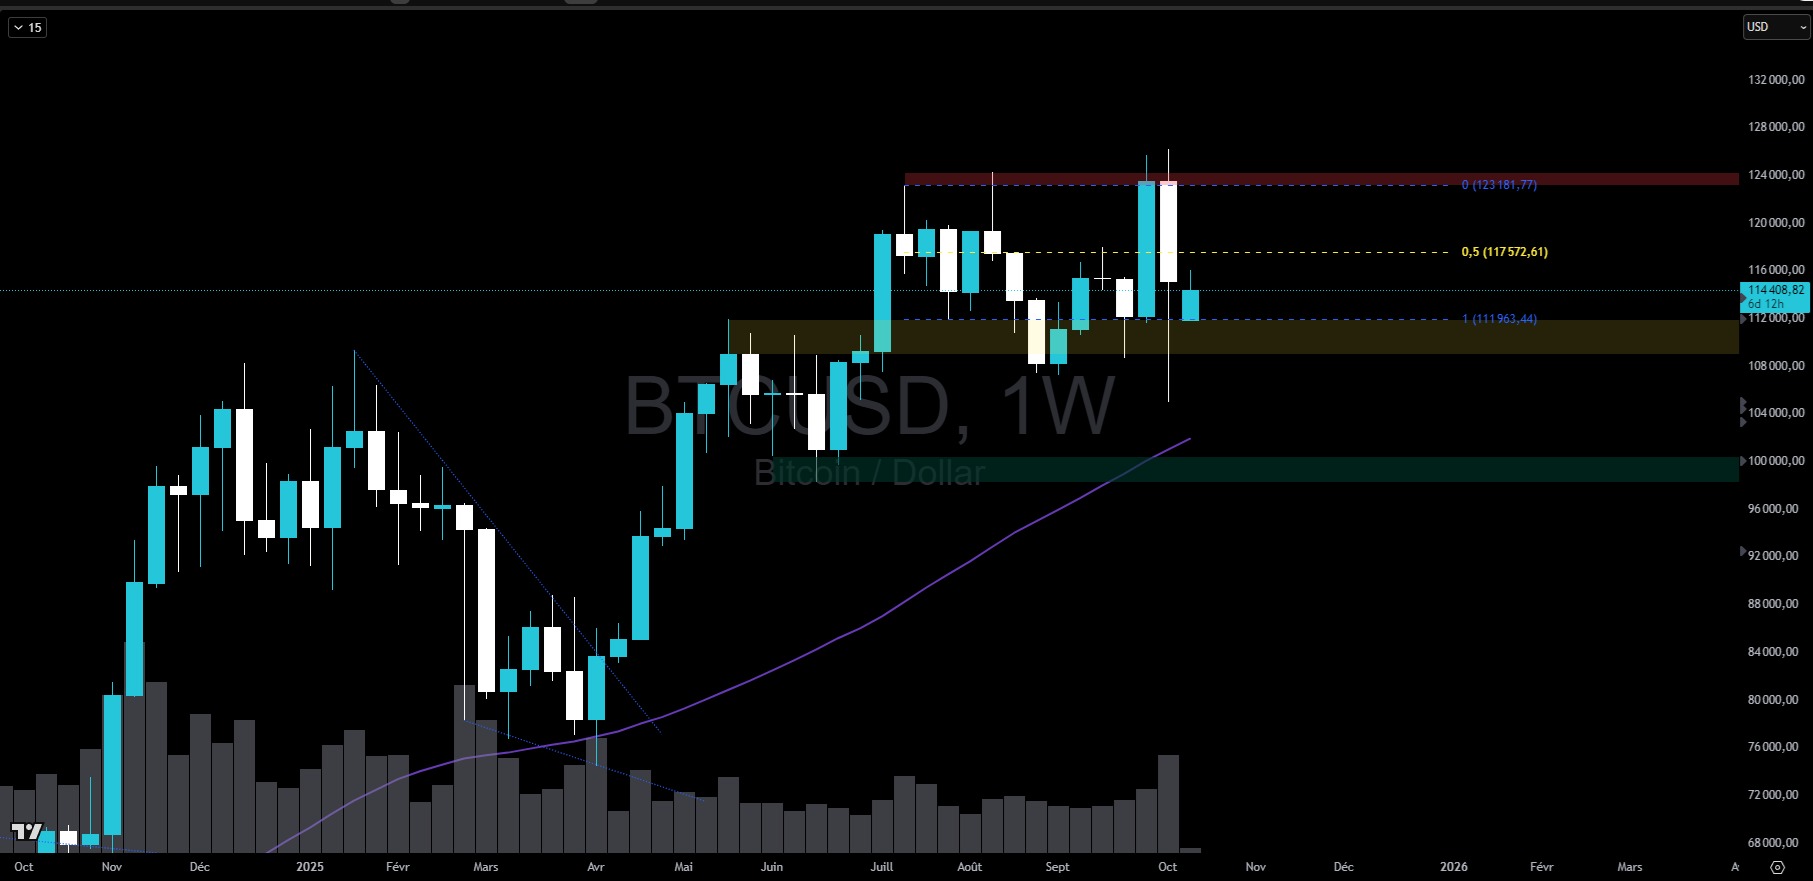
The chart available at the time of writing has a display bug concerning the last weekly candle. However, the most significant element remains the shape of the candle that has just closed.
It has a long bearish wick, briefly falling below the range support at $112,000 to brush against $100,000, before closing at around $115,000.
This episode of high volatility, which absorbed most of the available capital before a rapid recovery, illustrates a classic range phase configuration. It encourages a bullish outlook, with the median zone as the first target.
If the equilibrium at $117,500 gives way again, then we could see Bitcoin close to its historic highs in the coming weeks.
However, we will have to factor in the breakdown of the structure that Bitcoin had previously built. Admittedly, the spike shown on the chart is linked to an exceptional event, but it nevertheless calls into question the bullish trend. BTC is therefore once again in a neutral trend, which calls for caution, as the doors to a bearish scenario have opened slightly.
On a daily basis, the trend is also neutral, and has been since the low in the previous structure between $107,000 and $113,500. It is also interesting to note that Bitcoin is rebuilding a visible structure in this same zone, for the moment, only in 4-hour data.
In fact, the daily chart has not developed enough candles to give us concrete elements to analyze price action on this time frame.
That is why you will find below a 4-hour chart and the corresponding analysis, which could nevertheless change rapidly depending on price movements on this time frame.
Let’s keep in mind that any bearish scenario for Bitcoin implies the formation of a lower high than the previous one, the latter being located at the historic high. The working interval is very wide and, at the current stage of development, it will be necessary to either break through $126,000 to invalidate this idea or develop a new structure in the coming days.
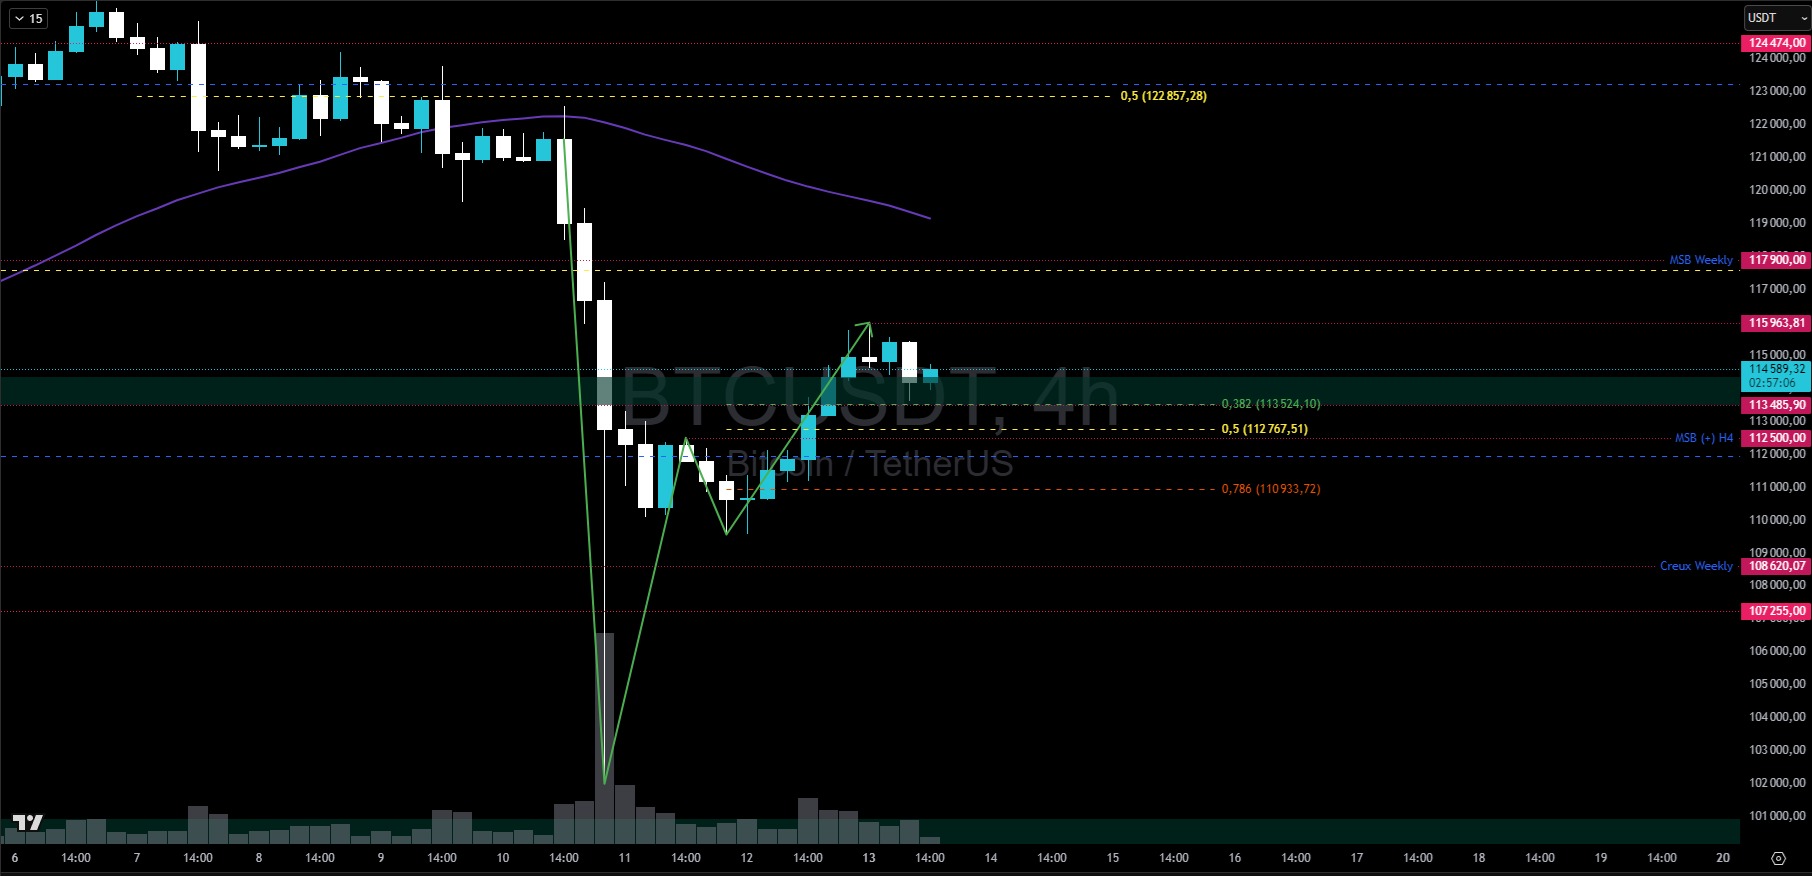
That being clear, a bullish change in structure can be observed in the H4 data, with an initial break observed at $112,500 on the 2:00 p.m. candle on Sunday.
This movement has developed a new bullish leg, which closed last night at close to $116,000, now inviting a throwback in search of a new high above the previous one.
While the legitimate target for this bullish trend in the short term seems clear: $117,500 to $118,000, the movement may retrace, seeking some liquidity near $111,000 before continuing its bullish run.
The $109,500 level represents the invalidation threshold for this small time frame rally; falling below it would send us back to the bottom of Friday’s nightmarish wick.
In summary, Bitcoin is returning to its weekly range after a historic cash run. While this movement is a favorable signal for a return to the opposite end of the range, the daily time frame will need several more candles before providing clear indications. On the other hand, the 4-hour chart is already showing bullish momentum, paving the way for northbound targets.
So, do you think BTC can reach $150,000? Feel free to share your thoughts in the comments.
Have a great day, and see you next week for a new Bitcoin analysis.