
Bitcoin (BTC) and Ether (ETH) continue their erratic movement in their respective ranges. Despite the desire to resume the upward path, the upper bounds are holding up perfectly. Is an explosive move to be expected? We take stock of the situation to understand and position ourselves accordingly
Technical analysis of Bitcoin (BTC)
Let’s start with the Bitcoin (BTC) price analysis on the weekly view. As we saw last week, it is trapped in a range on this view. Yesterday’s close does not give any more indication than last week’s close.
Indeed, the bottom of the range, identified at $29,600, is playing its role perfectly by containing the bearish assaults. As a reminder, a break from the bottom would take us into a deeper retracement with the former ATH at $18,900 as the first target, and the demand zone between $11,500 – $14,000 as the second.
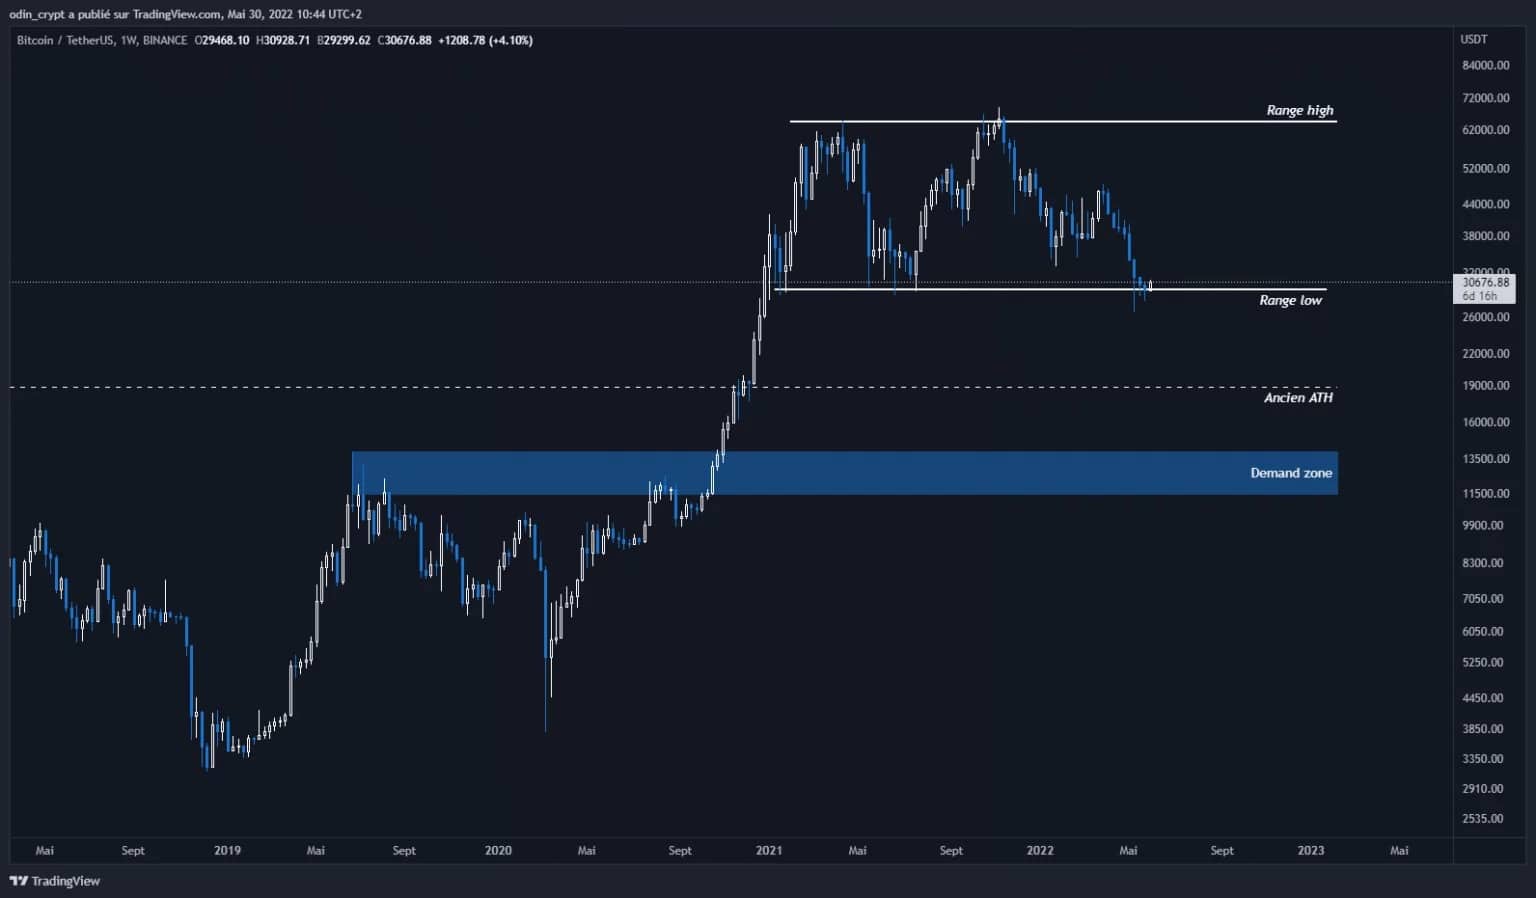
Figure 1: Bitcoin (BTC) analysis in 1W
Next, we turn to the daily view. The latter shows us a correct holding of the bottom of the range. We can hypothesize a bullish retracement of the last bearish movement. If this were to take place, the first objective would be the last low that was lost. It corresponds to the $37,200 area.
The second area I would look at is the last high at $47,000 which, once retaken, would allow for a bullish recovery.
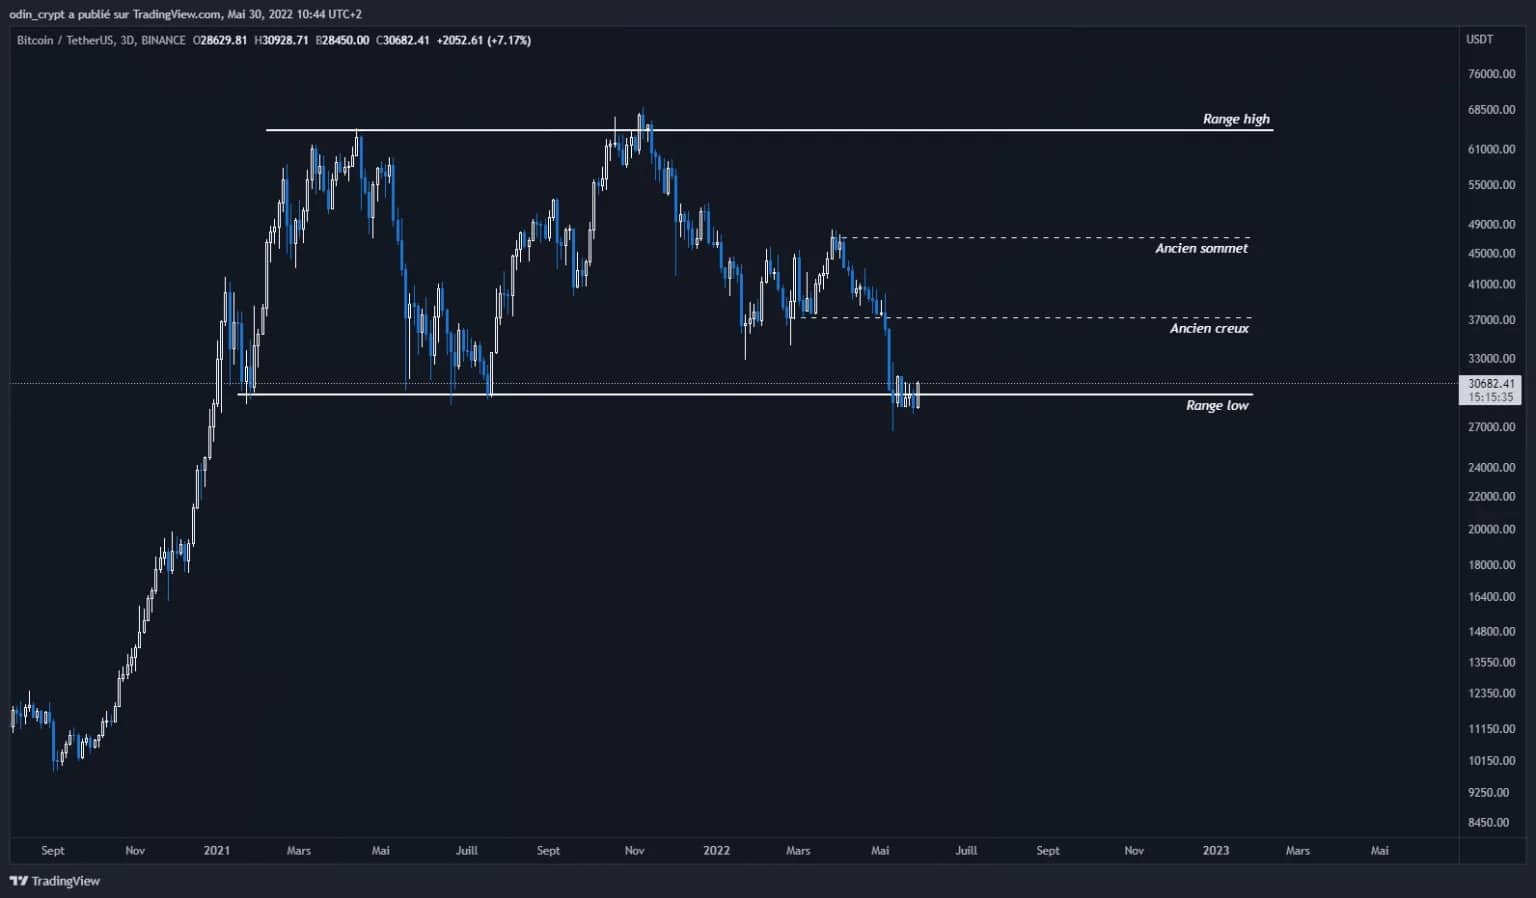
Figure 2: Bitcoin (BTC) 3D analysis
More locally, the 1 hour view shows us the current market. The price has, again, printed an accumulation range in which it has been wandering for 2 weeks now. Its lower bound takes place at $28,700 while its upper bound is at $30,700. A first phase of deviation on the upper bound was observed, and the latter has since remained unrevisited. This could allow the price to return to this area before returning to the zone of buying liquidity and then begin a more significant bullish retracement.
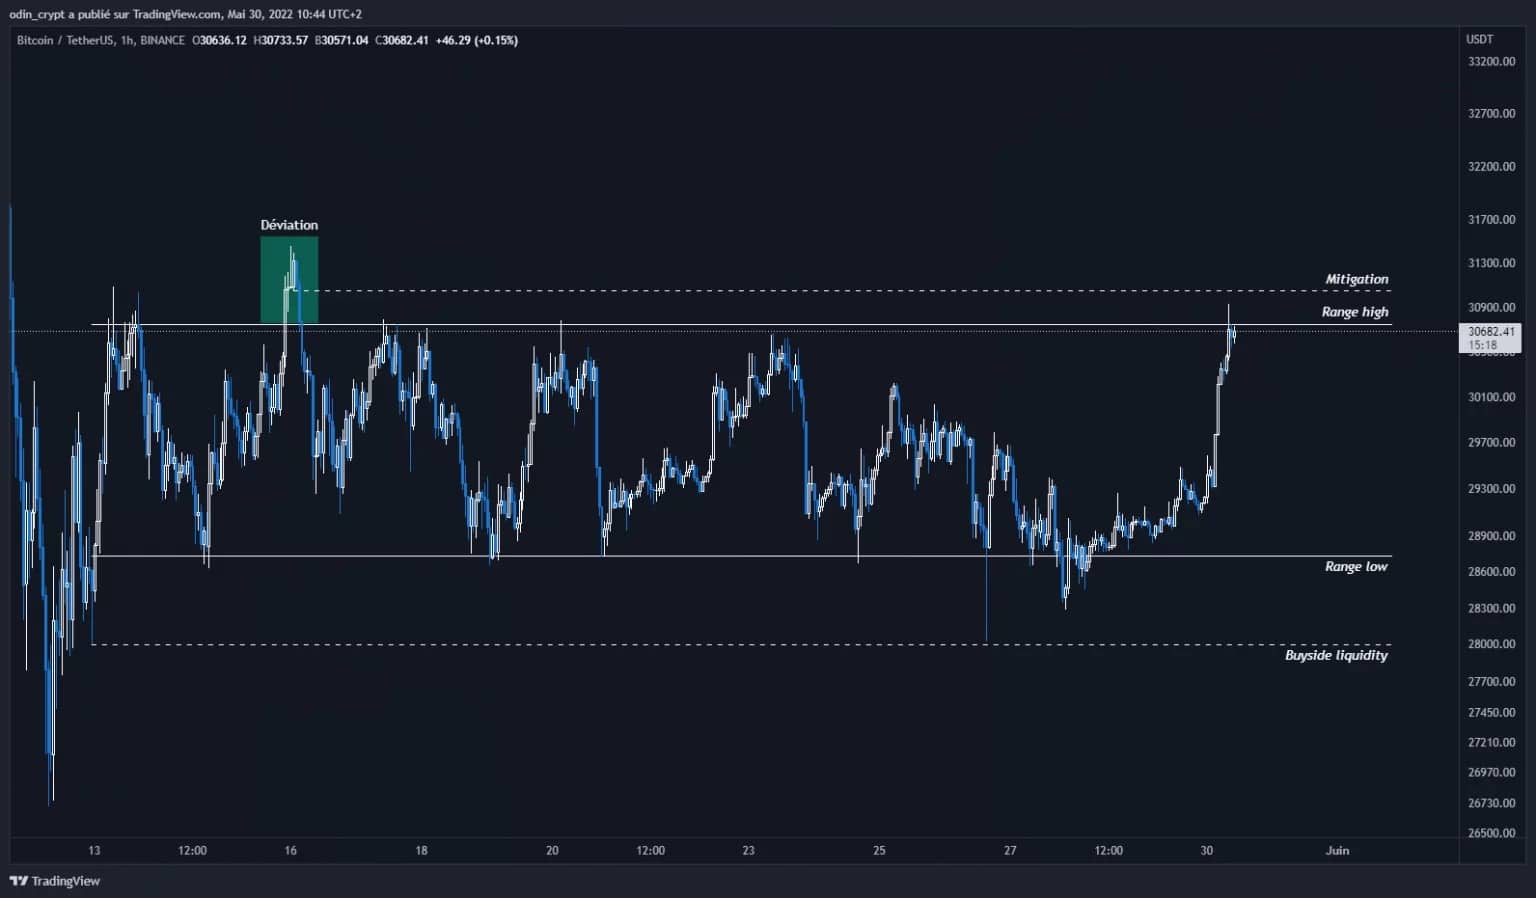
Figure 3: Bitcoin (BTC) analysis in 1H
Ether (ETH) technical analysis
Let’s continue with the price of Ether (ETH) and its weekly view. It is following the movements of Bitcoin very well but is not able to outperform it. It is also stuck between the two bounds of its range, with a resilience of the latter as it approaches its lower bound.
As a reminder:
- Low terminal -☻ $1,880
- High terminal -☻ $4,000
- Old ATH -☻ $1,300
- Demand zone -☻ $420-$490
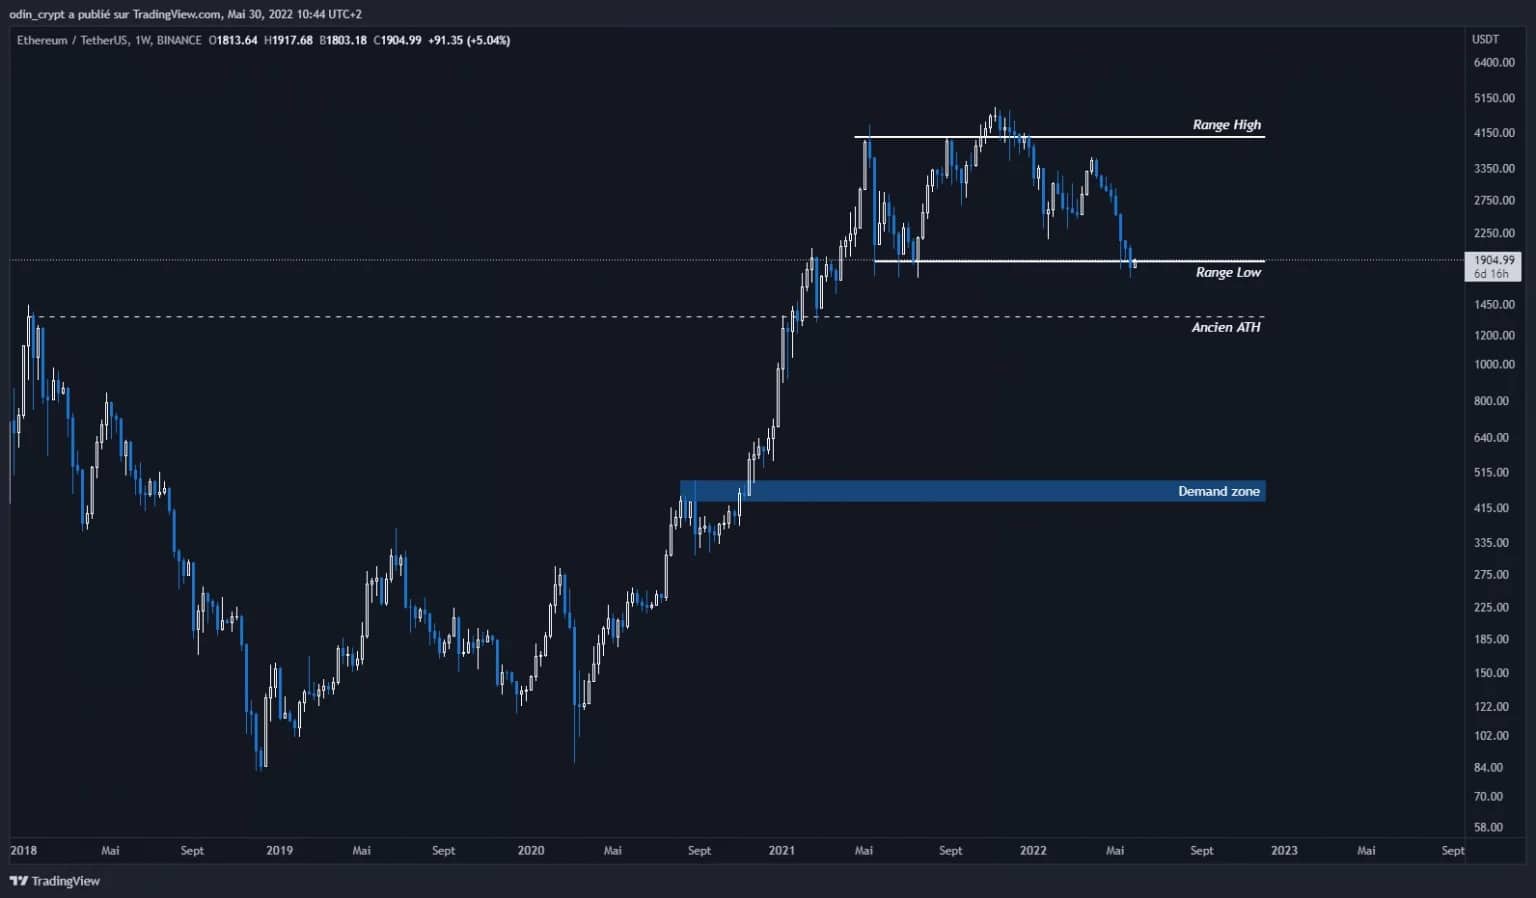
Figure 4: Ether (ETH) analysis in 1W
The daily view will tell us what areas we need to look at to understand the current moves. The loss of the last low at $2500 has reignited the bearish momentum with selling pressure. To regain a structure, the price will have to regain its last high at $3,520.
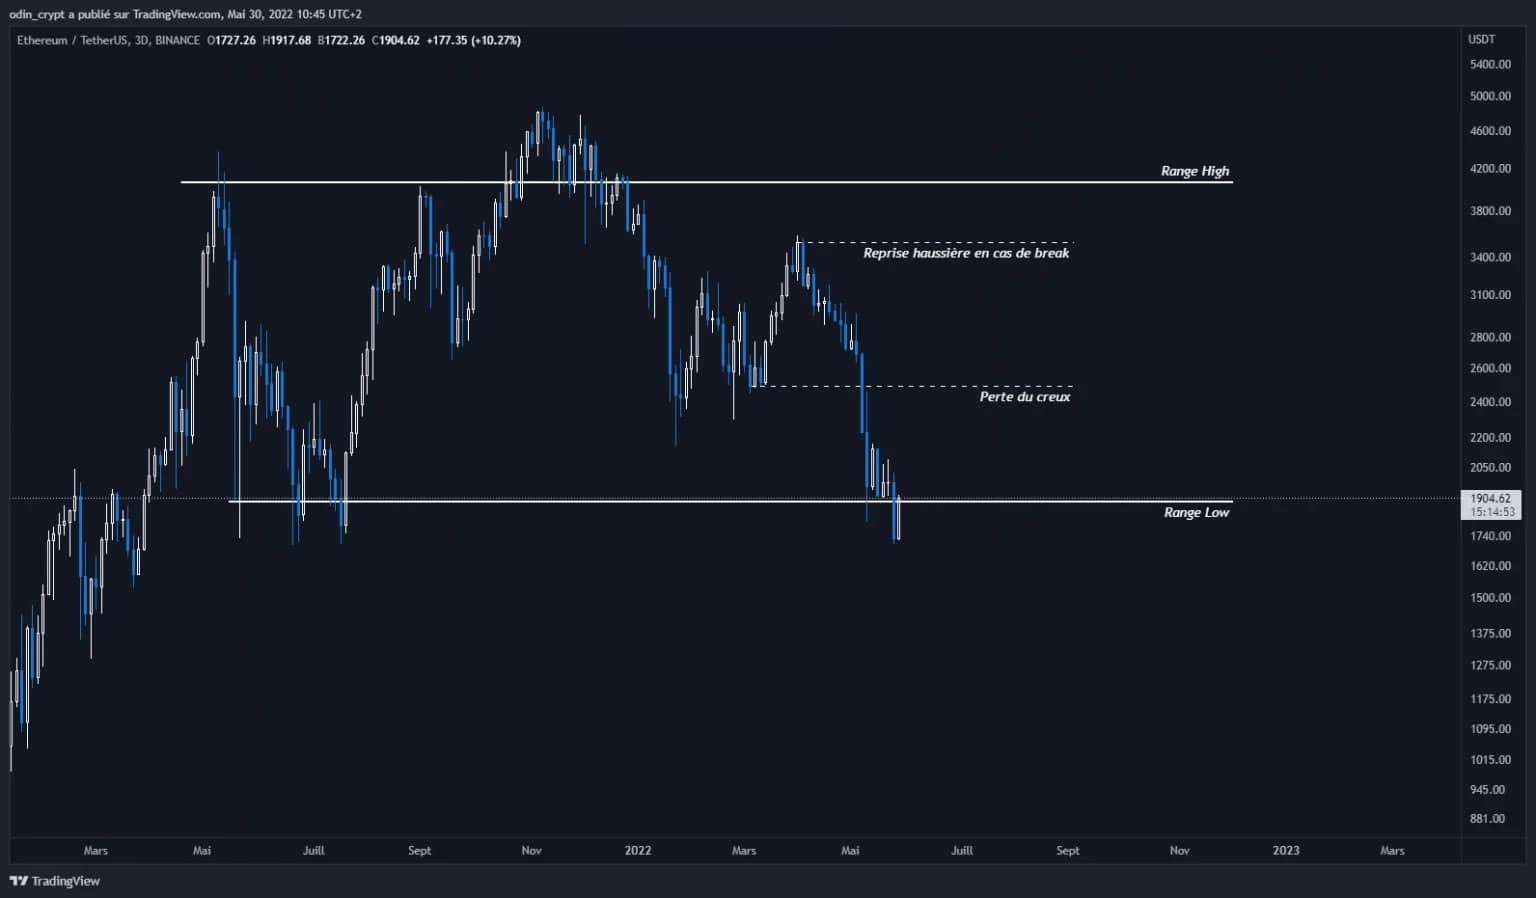
Figure 5: Ether (ETH) 3D analysis
The 4h view shows us the presence of a new range. We will have to watch the next movements of this range as it could offer a buying opportunity for a short term retracement to the $2300 mark.
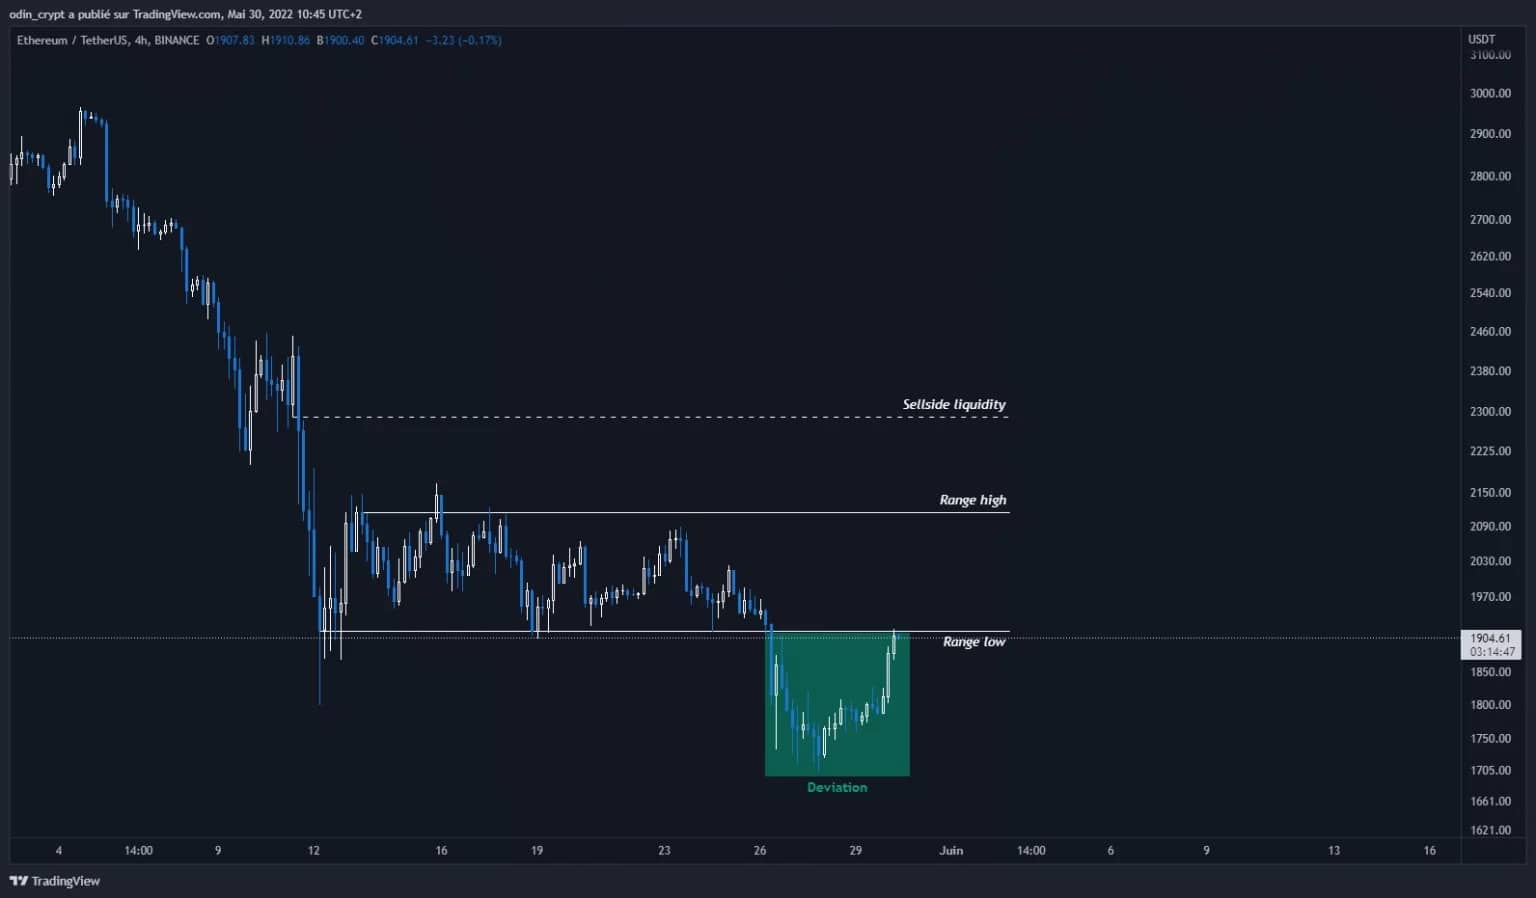
Figure 6: Ether (ETH) analysis in 4H
Sushiswap (SUSHI) technical analysis
Today I have chosen to talk about Sushiswap (SUSHI) on its daily view. The price is currently in a downtrend, and we can tell this by the succession of highs and lows lower than the previous ones.
The price seems to be attracted by the impulse zone of the big bullish movement. This zone takes place between $0.47 – $0.62. Nevertheless, it is possible to envisage a short-term rebound for the latter to come and get the selling liquidity needed to develop this last bearish phase. This area is located at $4.15 – $4.79, and will be a very interesting area for selling, or taking a short position and against the market.
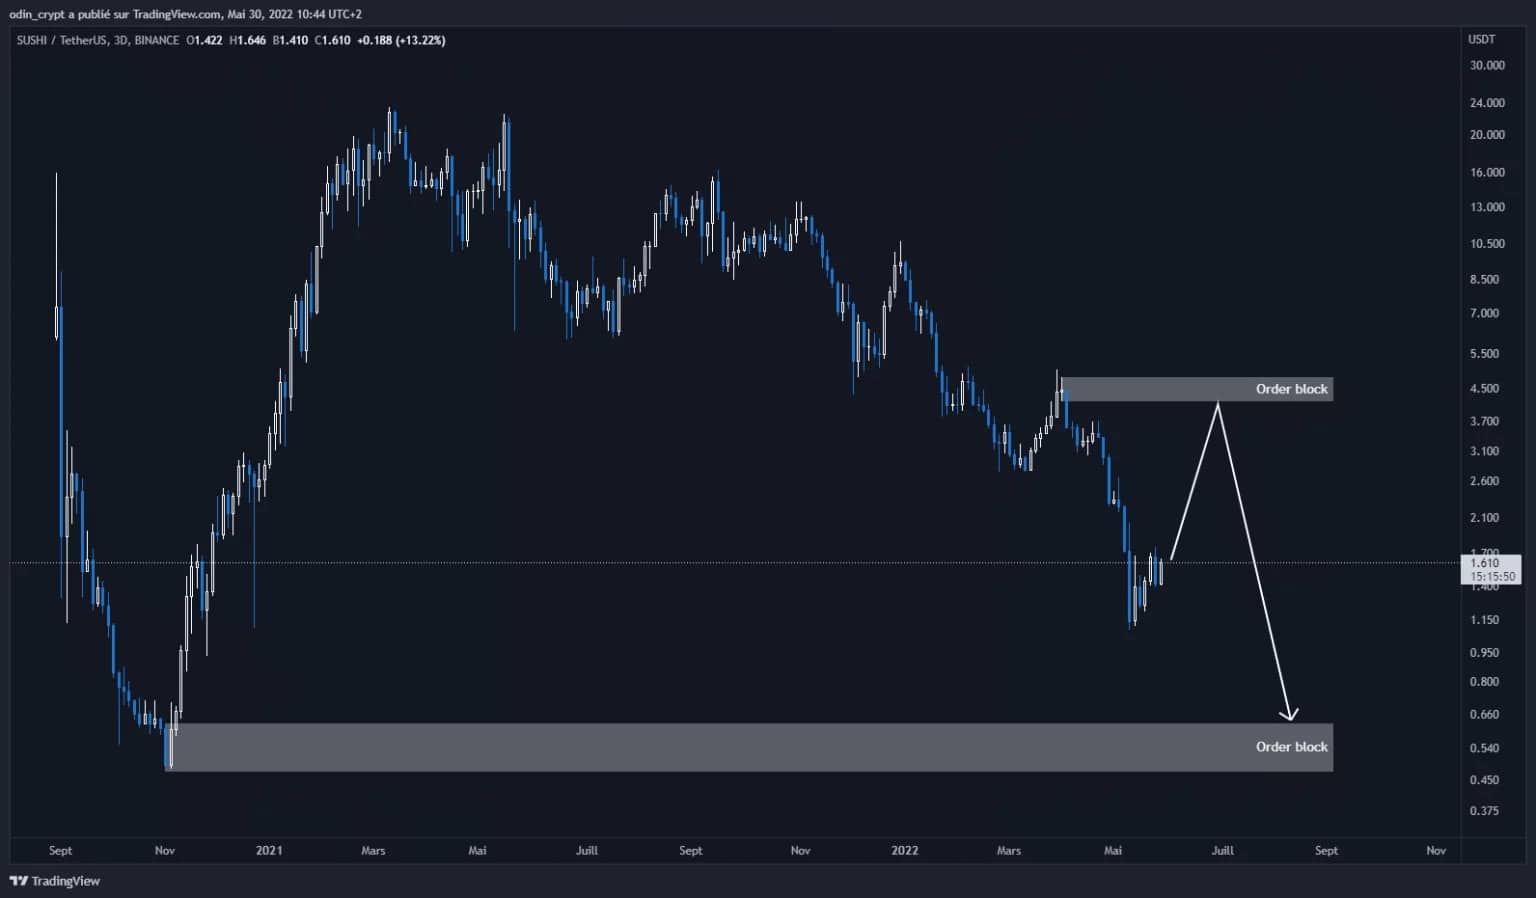
Figure 7: Sushiswap (SUSHI) analysis in 3D
Conclusion
Bitcoin (BTC) and Ether (ETH) remain stuck in their micro ranges on the lower bound of the macro ranges. This is a tricky situation for most market participants as the volatility of these phases is extremely low. This means a slower and more erratic development for all, and many will become impatient before resolution.
For Sushiswap (SUSHI), the bearish pattern remains valid and respected. A technical rebound could take place to create enough liquidity in the market to resume the initial move. The buy zone I will be looking at is $0.47 – $0.62 and will allow for a long term position.