
With the price of Bitcoin (BTC) falling below $80,000 this weekend, what will be the low point of this bear market? Let’s try to predict the future based on lessons from the past.
How low can Bitcoin (BTC) go?
Over the weekend, the price of Bitcoin (BTC) fell below $80,000 for the first time since April 2025, dragging other cryptocurrencies down with it.
Now that it is clear that we have indeed been in a bear market for some time, we can ask ourselves how far this decline will go.
To estimate this, we can look to the past to determine the extent of the corrections that BTC has faced throughout its history.
To do this, we looked at the price of BTC on a monthly chart, zooming out significantly on its history to see the last four major corrections in previous cycles:
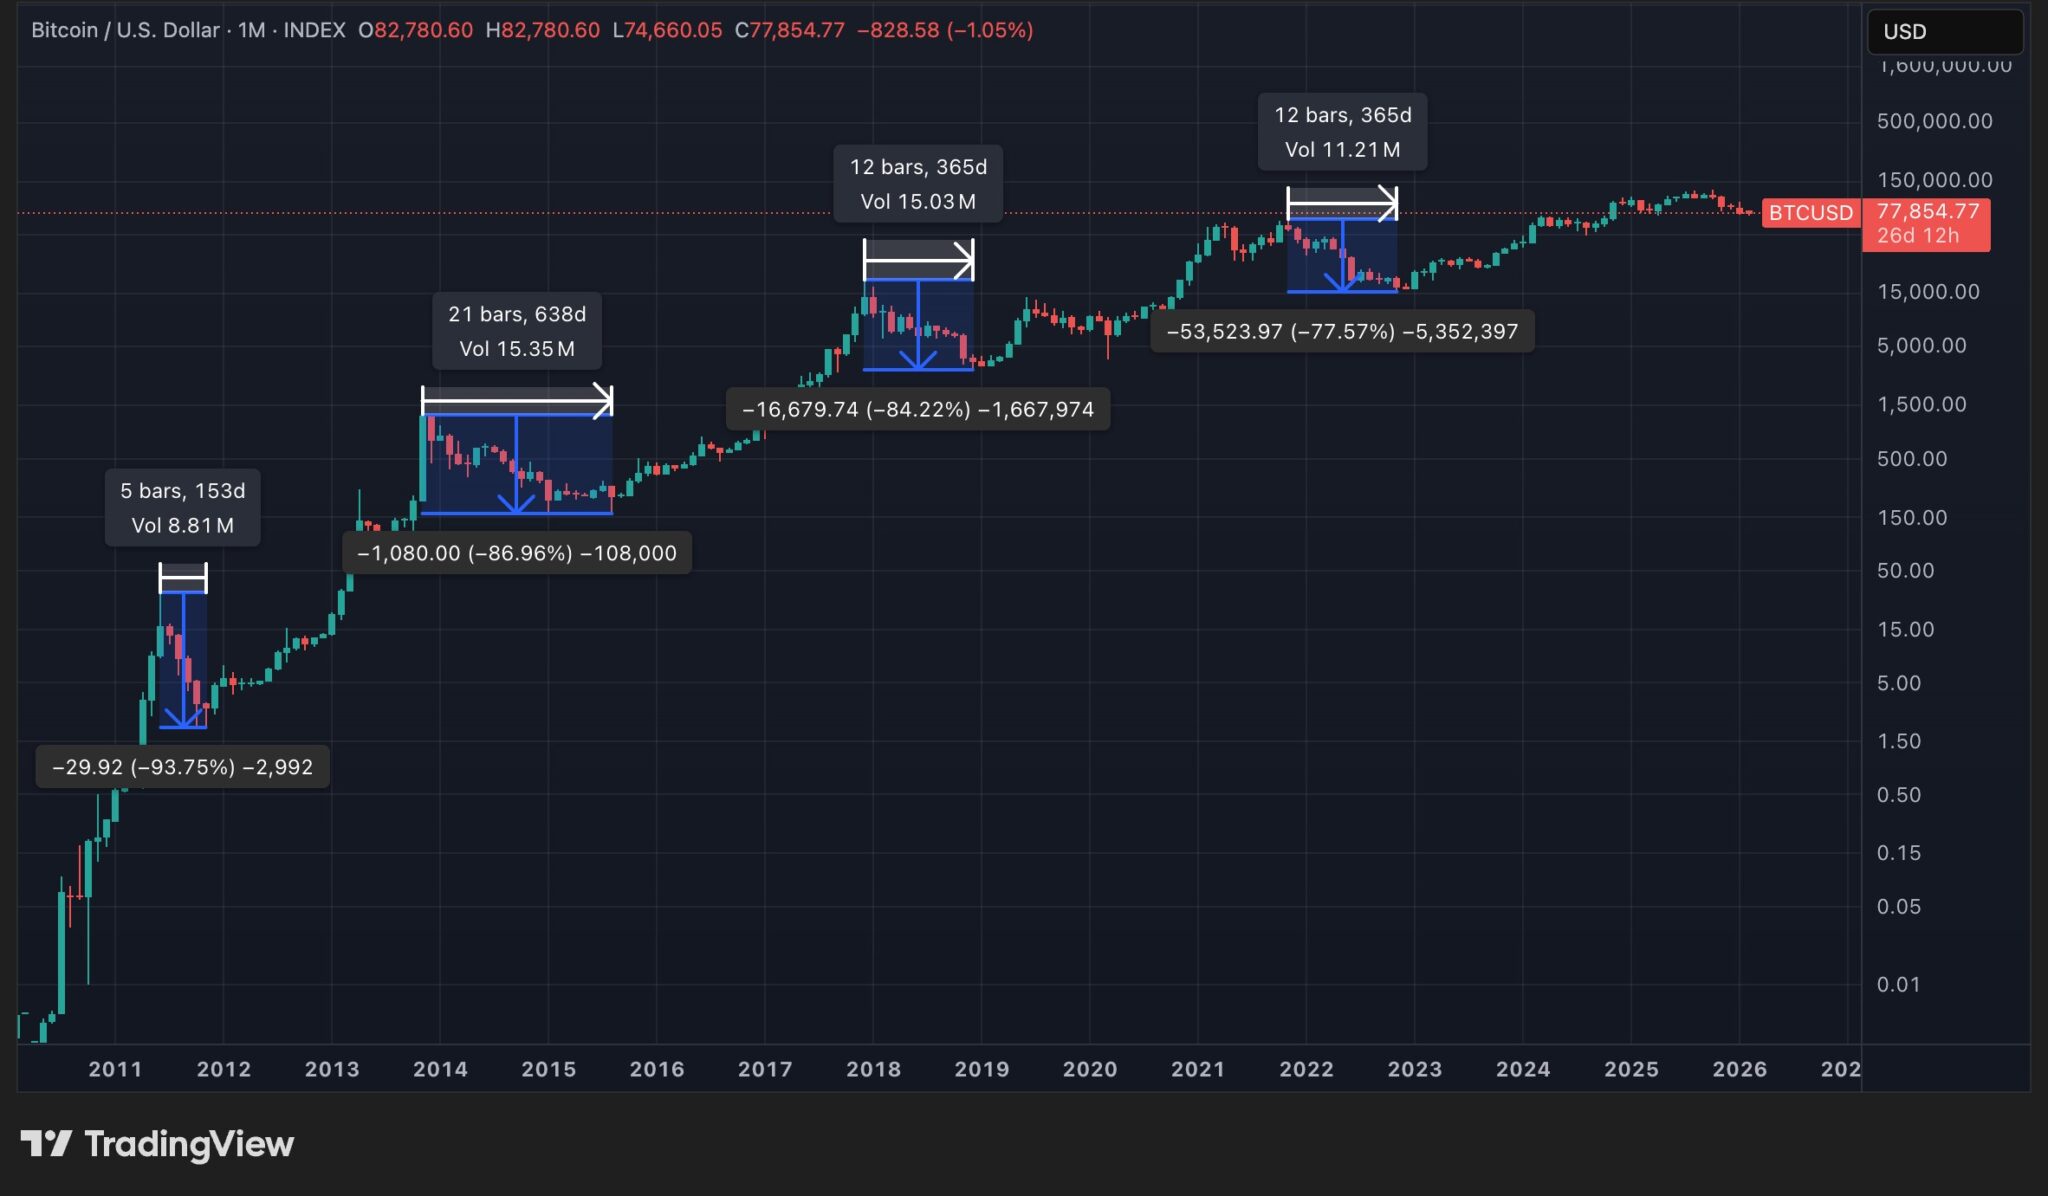
Between the previous all-time high (ATH) and the last low point before an upward acceleration, BTC lost between 77.57% and 93.75% per cycle, over a period of 5 to 12 months.
What is notable is that, to date, prices have fallen slightly less with each new bear market than during the previous cycle, a pattern that also applies to the various bull runs.
We could therefore expect a smaller decline during this bear market, even as Bitcoin is increasingly adopted by traditional finance.
However, the scenario of a low point that has already been reached would be completely unprecedented in the history of the asset. And for good reason: between its ATH in October and this weekend’s low, BTC fell by “only” 40.85% over a period of just four months.
Assuming a decline of the same magnitude as the 2022 bear market, which was the weakest, this would give a price target of $28,300.
Although too little data is available and the model is therefore not relevant, we can also point out that the magnitude of the price decline is on average 6% less significant with each cycle. With this in mind, we could assume a hypothetical decline of 72.84% for the current movement, which would imply a low point for BTC of $34,280.
For the moment, these are only assumptions based on past data, but the bull run we have just witnessed has also shown us a much smaller increase than we have seen in the past.
Therefore, we can only speculate and remain cautious in our projections.
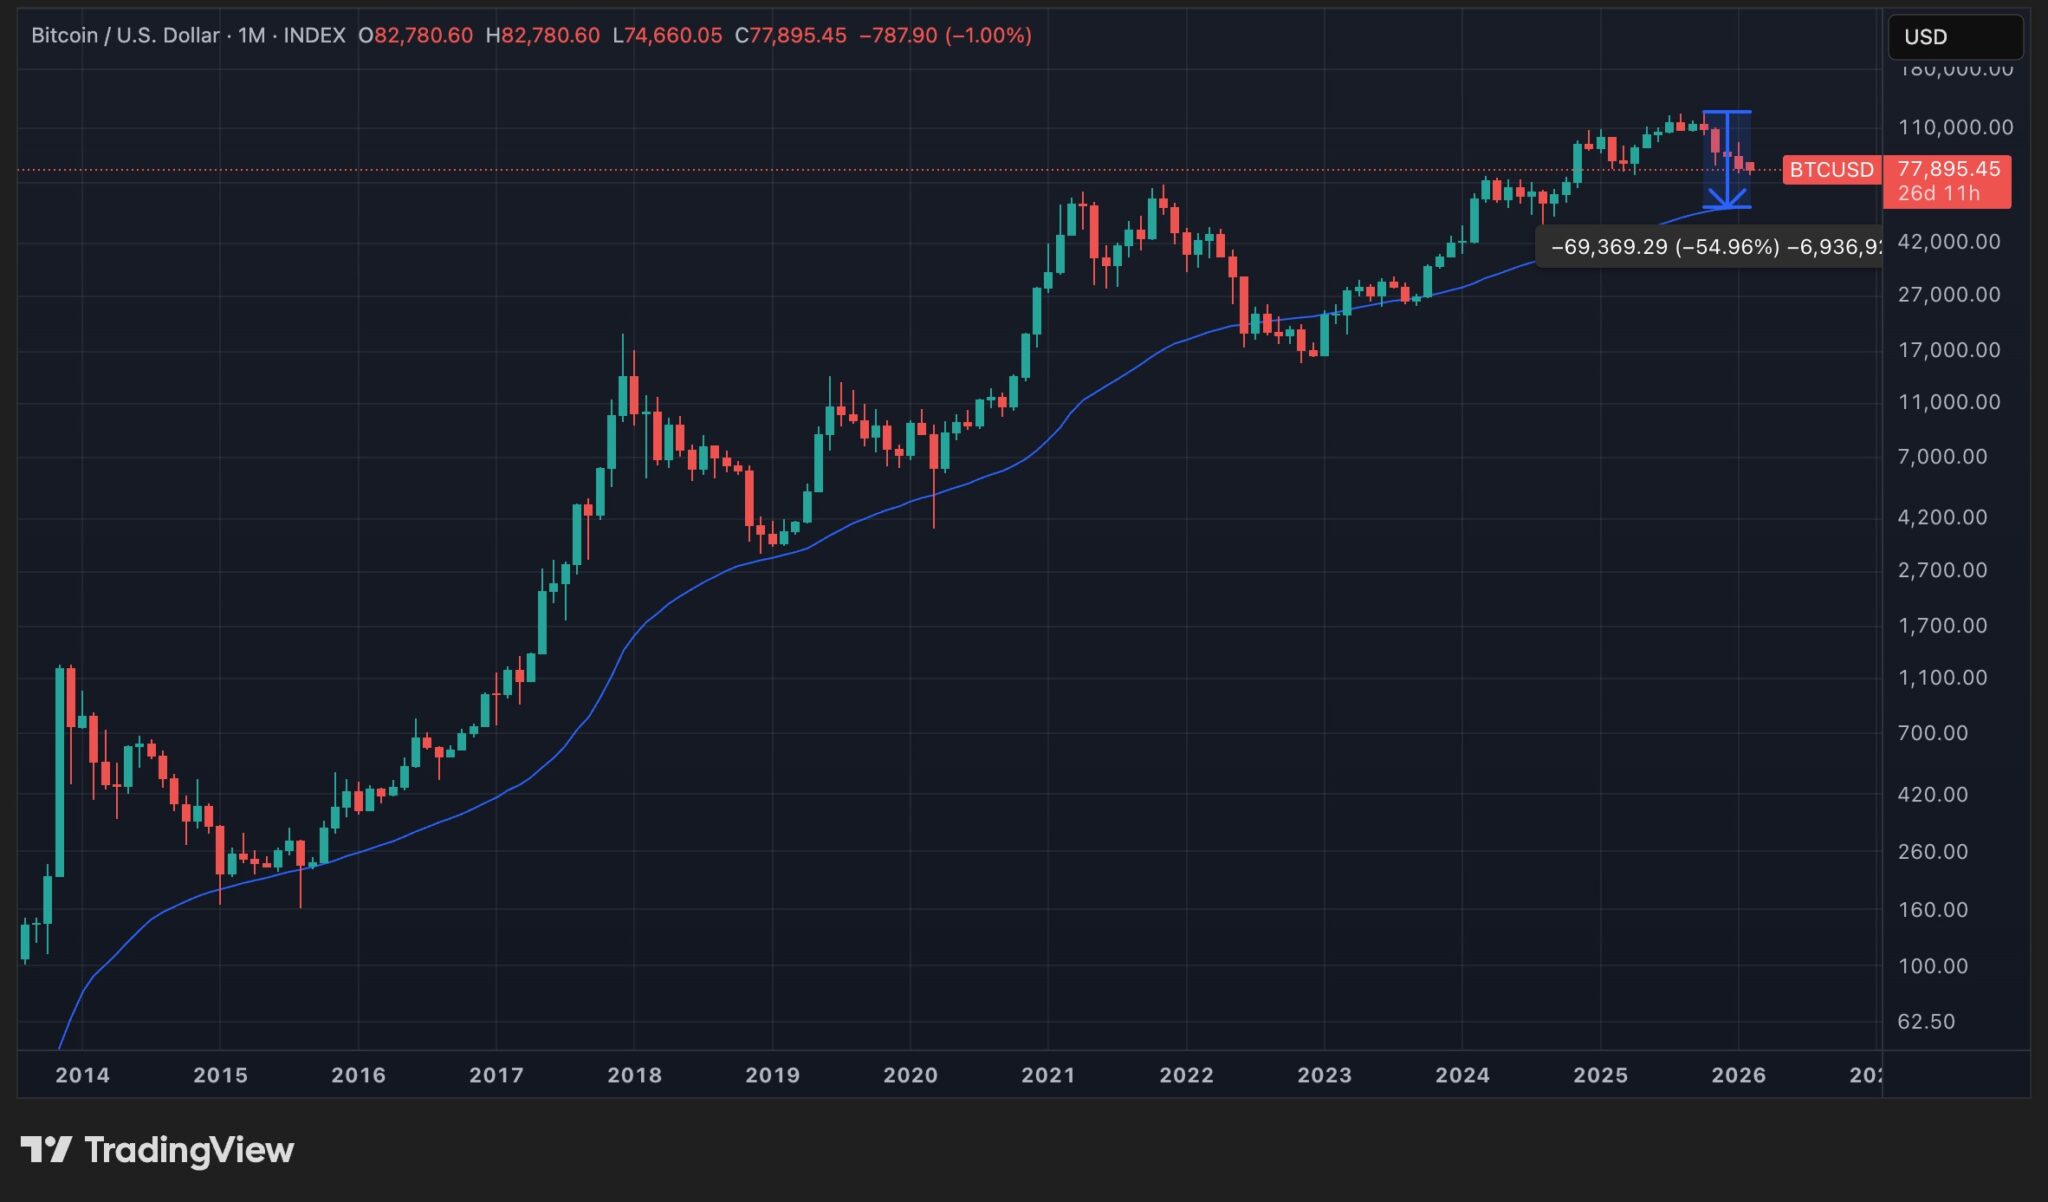
In addition, a more positive scenario could be to look at the 50-month moving average, which has served as a relatively reliable support in the past. If the price of BTC were to simply touch it, this would represent a 55% decline from the ATH, giving a price target of $56,800:
Regardless of the direction of prices over the coming months, current levels could already represent an attractive entry point from a long-term perspective, suggesting that a dollar cost averaging (DCA) strategy should be considered.