
After a nice bullish week for the cryptocurrency market, Bitcoin (BTC) and Ether (ETH) are regaining interesting levels and are about to retest important resistances. Will cryptocurrencies finally validate a short-term market turnaround, or are we close to another rejection
Bitcoin is trying to push back through its mid-range
This week, the price of Bitcoin (BTC) has finally started to rise again, with the price now trading above $20,000.
While this rebound is encouraging, we must remain vigilant on these levels which do not yet validate a trend reversal. Clearly, the price of BTC remains flat within a consolidation of several months and against a backdrop of crises.
If we want to see crypto currencies in a real bullish momentum again, we will already need to see a return of consistent buying and selling volumes that would allow the price to move back into the upper part of the range.
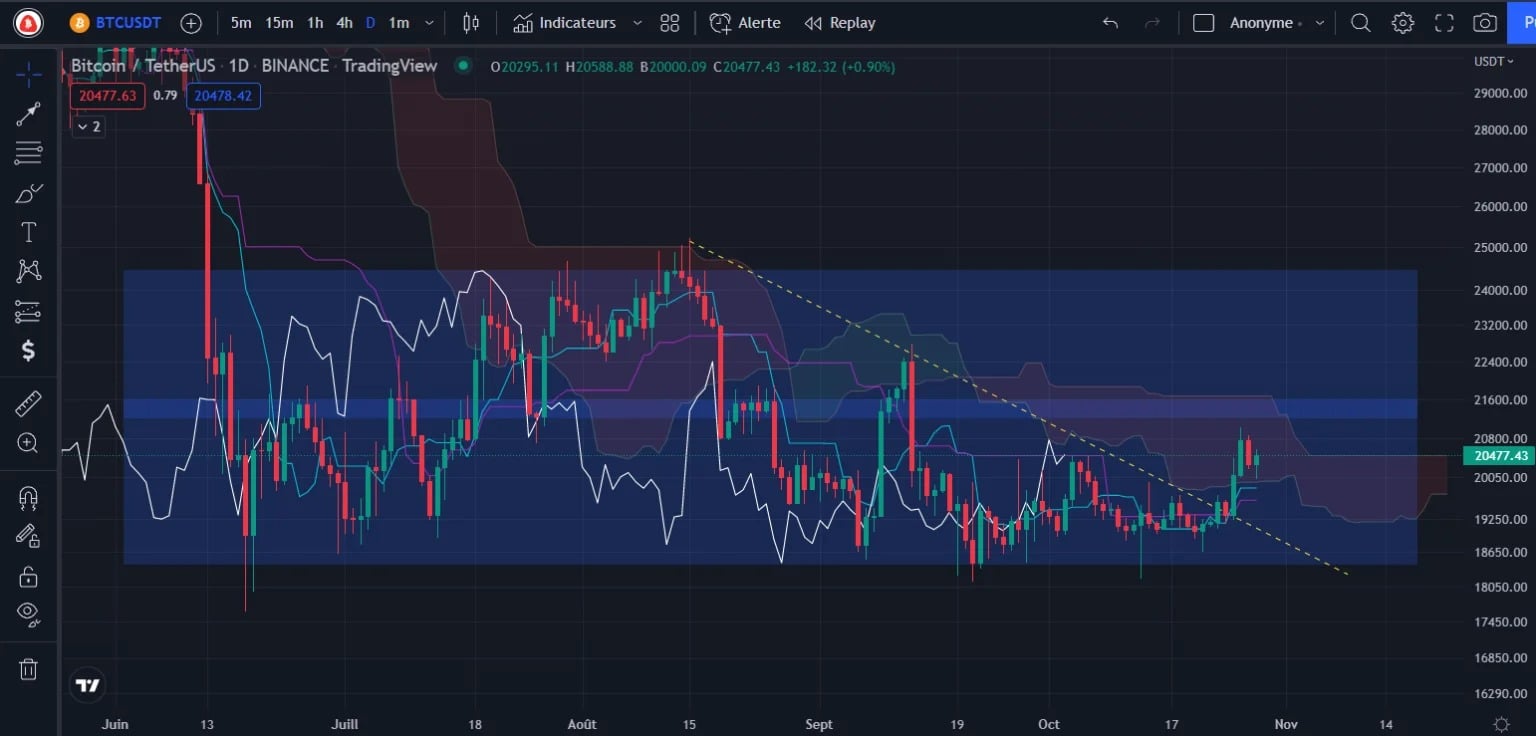
Figure 1 – Bitcoin Daily Price Chart
As we have pointed out in previous analyses, the market is maintaining a bearish structure with lower and lower tops, within a long-standing downtrend. In order to get a change in structure and look for nice bullish setups, we would need to see the Bitcoin price move back above $22,500. This area corresponds to the last local high point and would coincide with a return to the upper part of the range with the cloud becoming support.
In the meantime, the targets remain at $16,130 (Ascending Bevel), then $14,400 (Bearish Flag). In this context, a retest of $21600/22,000 remains likely, but a significant rejection would be likely due to the top of the cloud providing resistance to the price.
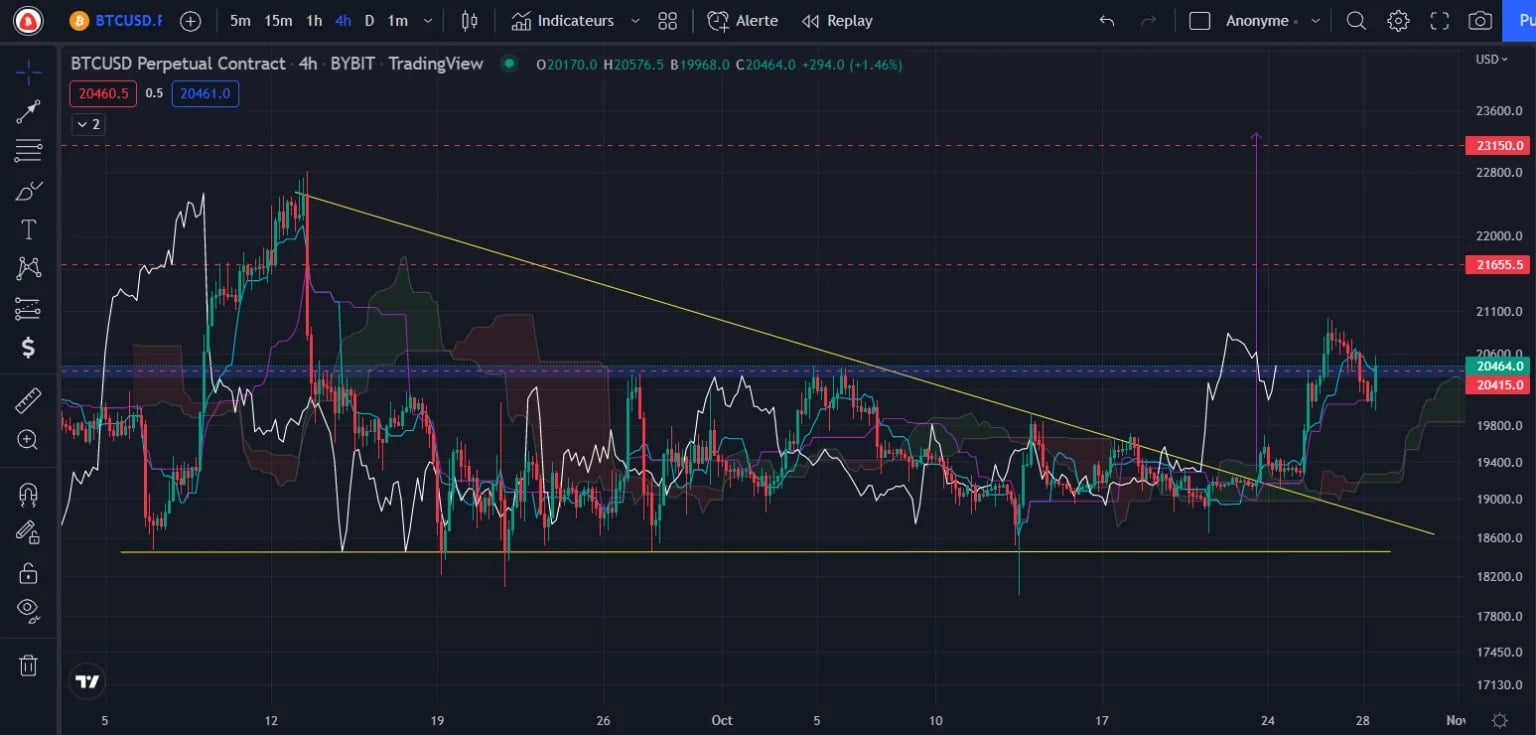
Figure 2 – Bitcoin price chart h4
On the H4 timeframe, a short term target has been activated at the $23,150 level following the breakout of the triangle from above. The problem remains the presence of two notable resistances on the way: the Tenkan Weekly at $20,415 and another Tenkan Weekly flat at $21,655 (both in red on this chart).
This Ichimoku curve, like the Kijun, represents important resistances not to be overlooked, and thus a risk here for the price to be rejected. Despite this bullish break, it is therefore advisable to be vigilant and to consider a very likely rejection of the price around $21,655 if it manages to break the first Weekly resistance.
Join our group composed of Vincent Ganne and our fundamental and on-chain analysis experts on the Pain Grid. Our experts deliver daily exclusive information and analysis on the crypto market to optimize your knowledge!
Ether (ETH) ready to head back towards $2,000
The price of Ether (ETH) has managed to hit our bullish target set last week and is now showing a new triangle breakout this time in Daily.
This triangle is right in the range and could help ETH to go for the top of its range at $2,000. But before that, it will obviously have to break the Tenkan Weekly resistance from above at $1,625 (also corresponding to the top of the cloud, which is currently acting as resistance).
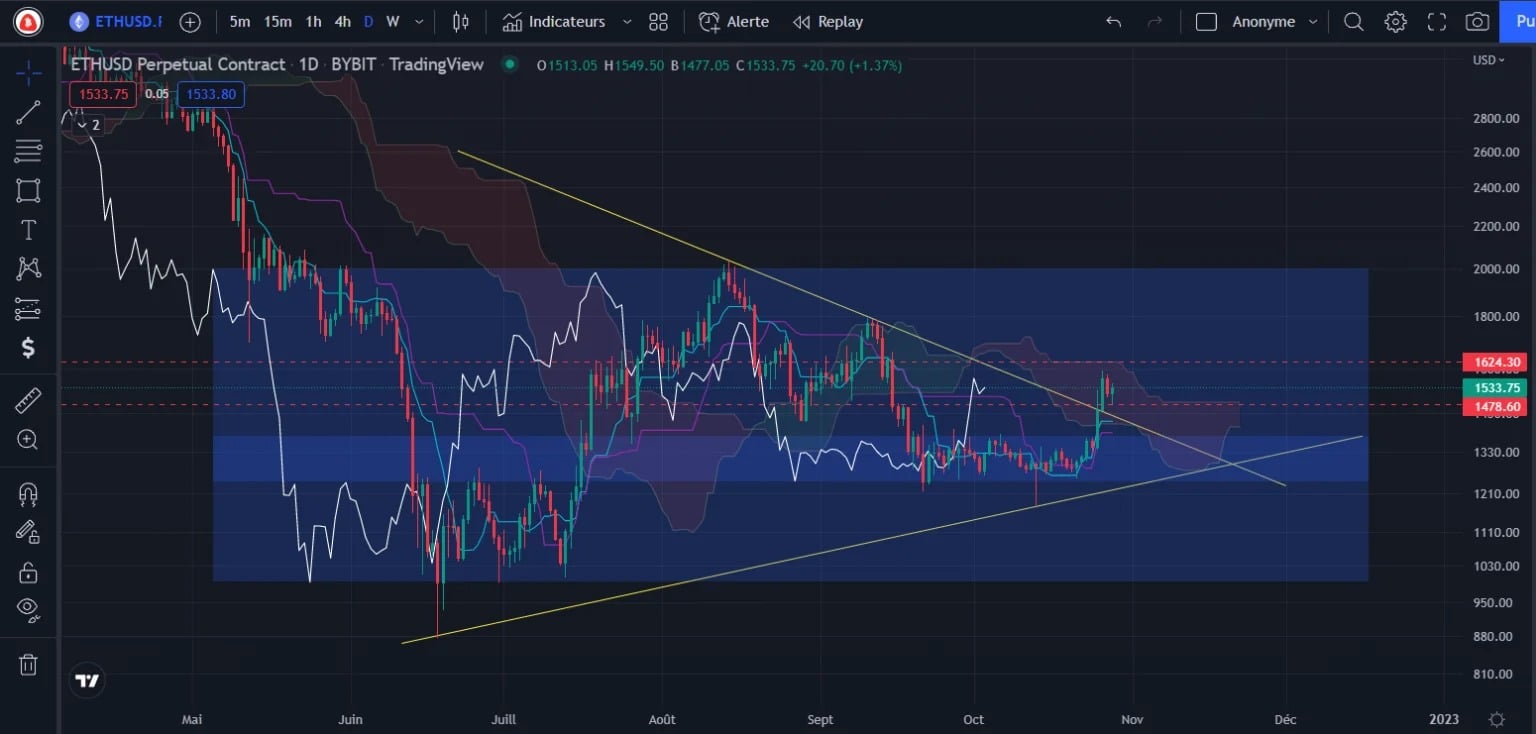
Figure 3 – Ether Price Chart (Daily)
If the price breaks this resistance, then ETH should move back up to the top of the $2,000 range as the Tenkan Weekly will provide support. On the other hand, should the crypto face a rejection, there is a good chance that it will finally go for the bottom of the range at $1,000 this time.
Conclusion of this technical analysis
Bitcoin and Ether are showing early signs of returning to bullish momentum, but remain below important weekly resistances.
Breaking these would validate structural reversals and therefore offer good prospects for the future. As long as prices remain under resistance with lower and lower tops, the risk of a fall will remain high.