
The prices of Bitcoin (BTC) and Ether (ETH) have exploded this week. The hope of a short-term bullish recovery is back but after such a strong rise, what are the different scenarios to watch? The point in this new technical analysis of the cryptocurrency market.
Bitcoin (BTC) faces a big wall of resistance
After trading flat for many weeks, the price of Bitcoin (BTC) has soared, regaining +12.5% of its value in a week. Now, its price is trying to cross a major resistance zone again as it is the $19,000 / $20,000 area that had been a support during the long range from June to November 2022.
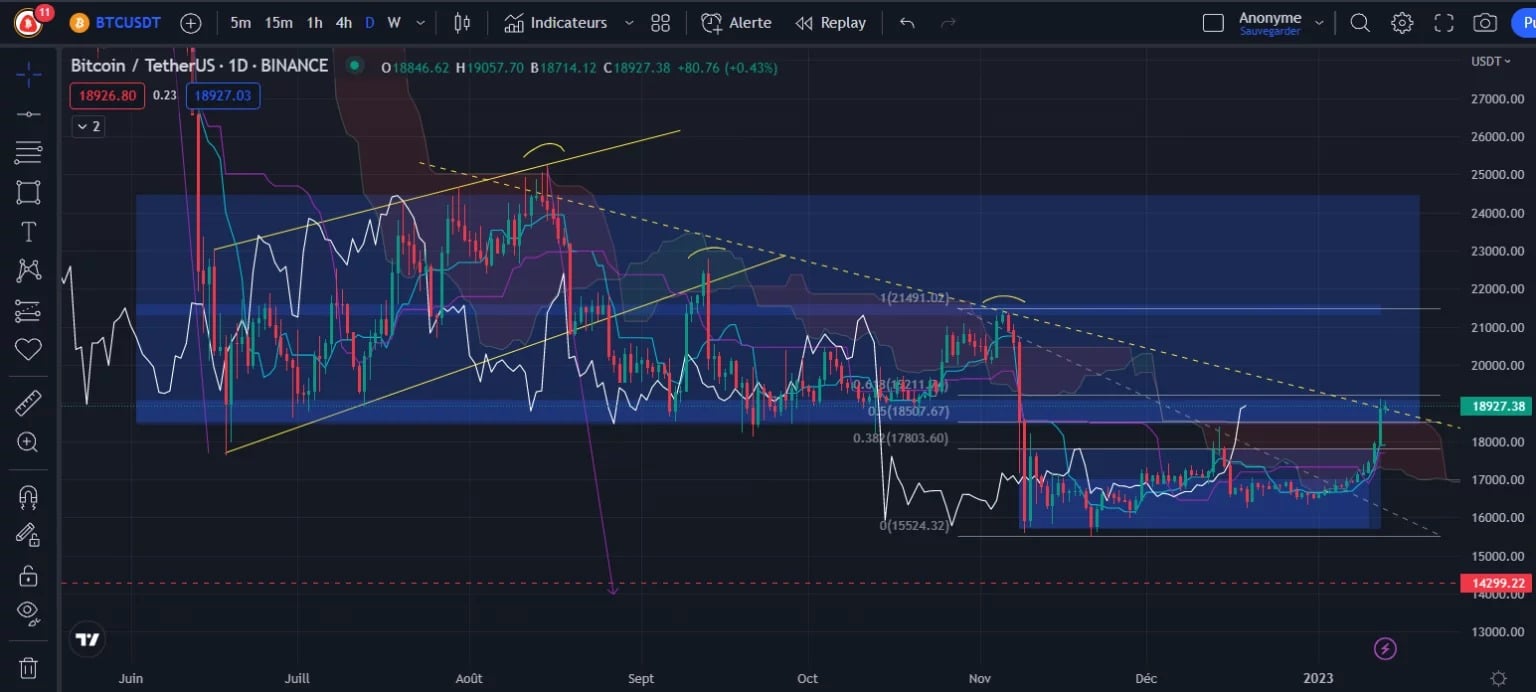
Figure 1 – Bitcoin Daily Price Chart
While this is encouraging and it is approaching key levels, Bitcoin is still in a downtrend with lower and lower tops. We can also see that the price is surgically stumbling on both the Daily trendline but also on the 0.618 Fibonacci level.
Furthermore, this $19,000 area corresponds exactly to the bottom of the former 6-month range. As a reminder, any broken support will become resistance, so it is likely that the price will suffer a rejection in the coming days and correct, at least temporarily.
If the price were to confirm the reintegration of the range by making a pullback on the top of the ichomoku cloud, for example, then there would be a strong probability that the price would then go for the Kijun Weekly at 20,360, or even the middle of the Daily range at $21,500. This move should be done in stages to consolidate the various supports and to accumulate as much liquidity as possible in view of the break of this very large wall of resistance.
In the opposite case, if the price does not manage to stay within the range, it should return to test its support at $15,800. At that point, it will be imperative to hold this level, otherwise there will be strong risks of seeing the price fall towards the Bear Flag target which is still active at $14,300.
A reversal pattern for Bitcoin (BTC) in h4?
By linking local tops and bottoms together, the price of BThttps://www.todayscrypto.news/wp-content/uploads/2023/02/2.BTC1301H4-1536×694-1.jpgC shows us (in lower time units) a price that is increasingly volatile within a chartist pattern called “ascending broadening wedge”. This type of pattern is rather known to break from below, so it is advisable to remain vigilant as it coincides with the very important resistance level characterized by the former Daily range.
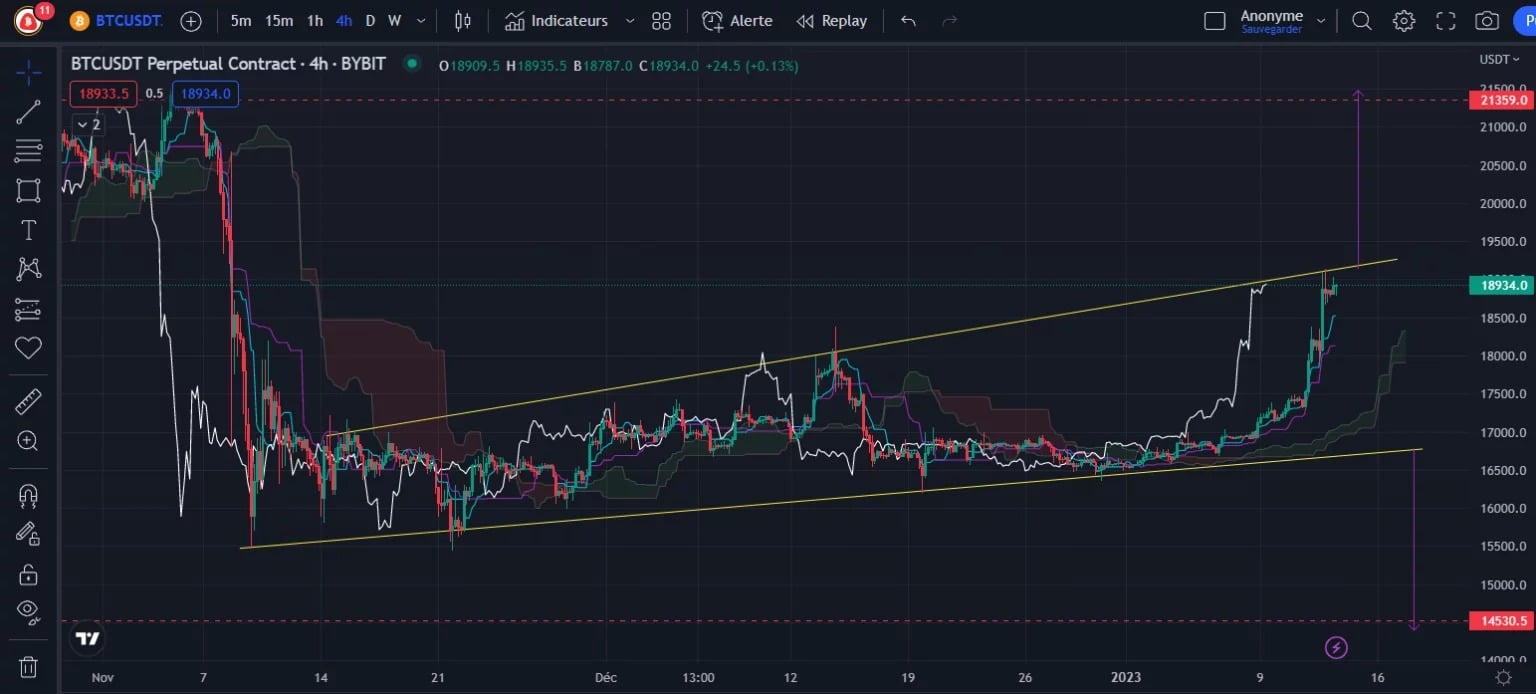
The odds of this pattern tend to push the price towards a breakout from the bottom, towards $14,500 or so. So the question is, will buyers be able to beat the odds and send the price back above $20,000 with this target at $21,350? Answer in the next few days.
Ether (ETH) needs to break its h4 resistance
The price of Ether (ETH) is in a bullish channel and is currently below its resistance. It will be interesting to watch this asset over the next few days to see if the price manages to break this pattern from above, or if we find ourselves back on a local market top.
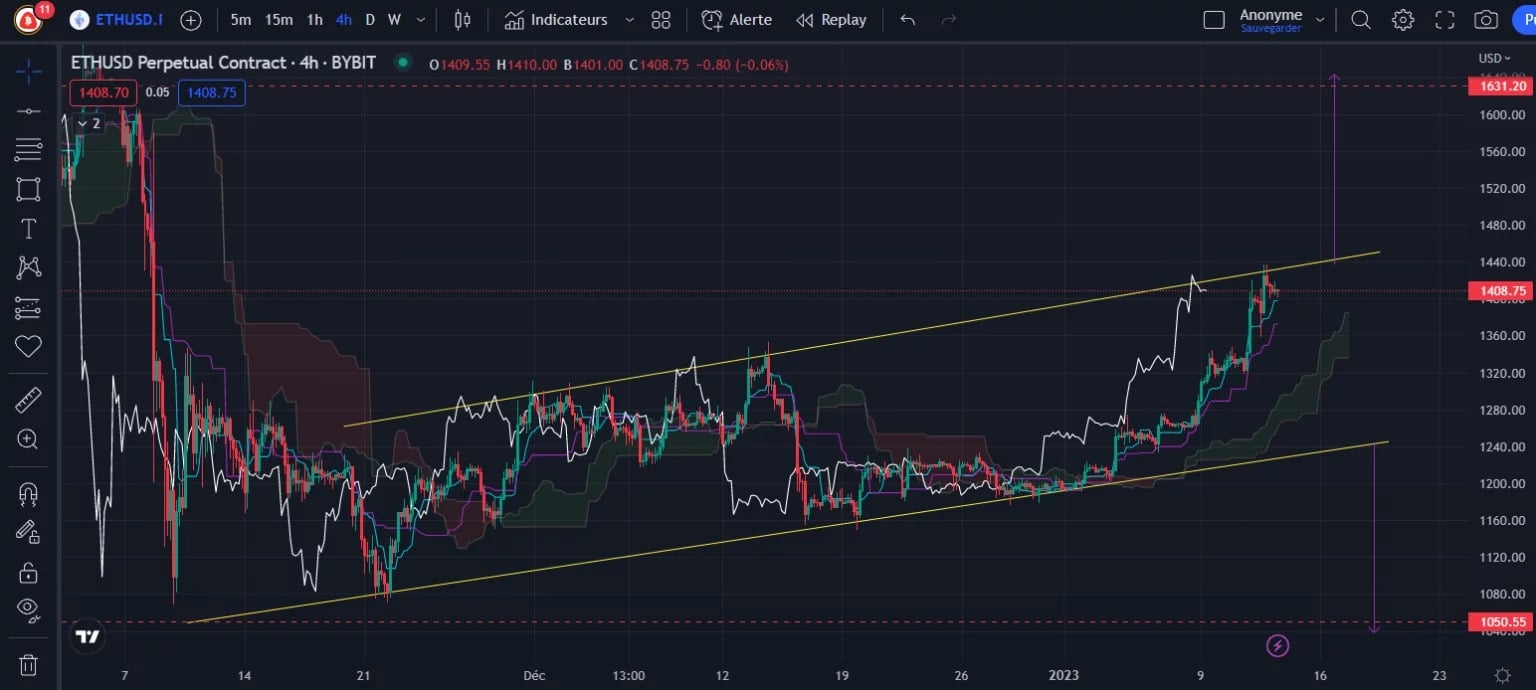
Figure 3 – Ether Price Chart (H4)
Here, the target for a breakout from the top would be around $1,631. However, as the pattern is rather bearish on Bitcoin, be careful that it doesn’t have a rejection otherwise Ether should follow towards $1,050.
Conclusion of this technical analysis
Bitcoin and Ether are stuck under important resistances. We will have to break them to consider a new bullish impulse in the coming days, otherwise beware of bearish targets that could quickly make us lose this beautiful progression of the last few days.