
After bouncing off a major buying area, Bitcoin (BTC) and Ethereum (ETH) seem to be regaining nice bullish momentum. However, the crypto-currencies are still in a range and need to break through their resistance. What are the scenarios to be considered
Bitcoin is back on resistance
While it has been in a horizontal range between $18,600 and $25,000 since June, the price of Bitcoin (BTC) has rebounded in recent days from the bottom of this range (blue rectangle) with particularly strong momentum today, a +10% candle in less than 24 hours.
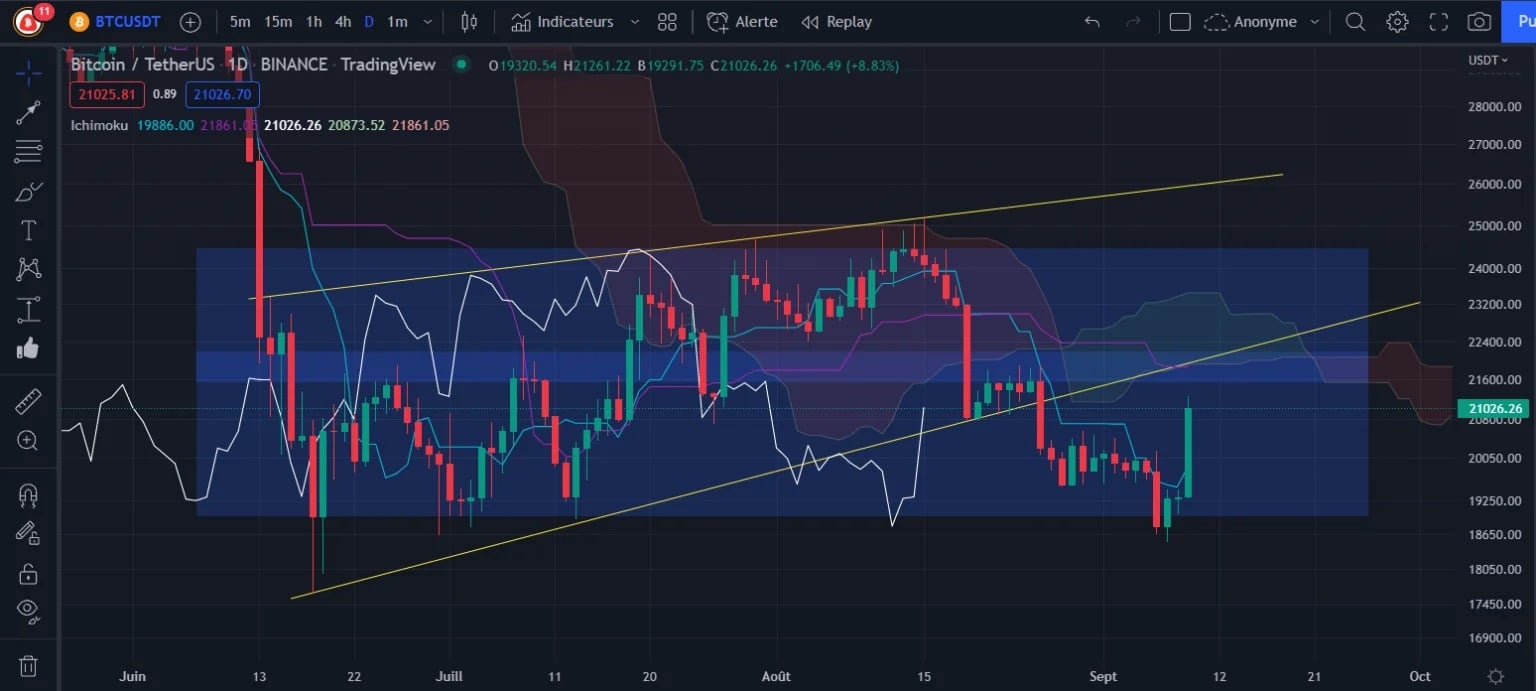
Figure 1: Bitcoin Daily Price Chart
On its return to the $18,600 level, BTC was able to benefit from significant buying strength on the bottom of the range. A solid level that caused a dynamic rebound towards the next resistance at $20,500.
This rise has managed to trap those who have gone short in the market and this new liquidity should help the price move higher, towards the next resistance level at $21,800 which is simply the middle of the range.
This level is a breakeven point for the price in the current market, although it is still very much in a downtrend on the higher time units.
In addition, an ascending wedge (yellow pattern) has been broken and the lower part is now acting as resistance and could take the price towards the breakout target at $15,500 if the price were to retest this mid-range area. Vigilance therefore, because to invalidate this bearish scenario, BTC will have to break its range from above, as well as the upper trendline, which remains a significant obstacle for the price.
Join our group composed of Vincent Ganne and our fundamental and on-chain analysis experts on the Pain Grid. Our experts deliver daily exclusive information and analysis on the crypto market to optimize your knowledge!
Ethereum (ETH) on its way to $2,000
The price of Ethereum (ETH) is also moving in range since June, between $ 1 000 and $ 2 000. The difference here is that the crypto is bouncing off the middle of its range, which could allow it to test the upper bound again in the coming days.
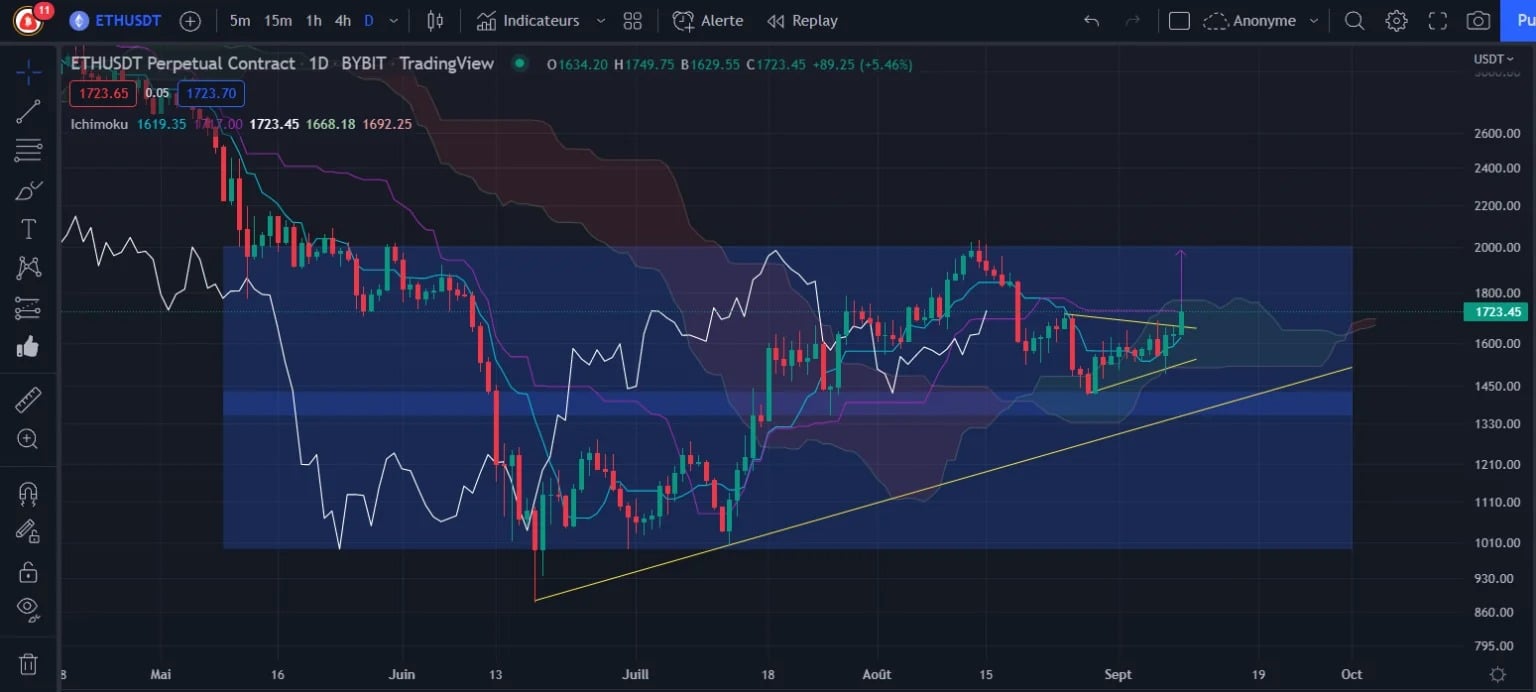
Figure 2: Ether price chart (Daily)
For this to happen, it will be necessary to get back above the Kijun and the cloud around $1,730, and the taking of liquidity in the middle of the range should help the price to do just that, especially since an h4 triangle has also been broken from above, with $1,930 as the target.
A return below $1,350 would be a strong bearish signal as the price would fall back below the middle of the range as well as below the large yellow trendline. These two levels are important liquidity areas that would give strength to sellers to return to test the lower bound of the range at $1,000.
In conclusion
Bitcoin and Ethereum are rebounding in the short term, but remain in the bearish trends that have been in place for many months. As long as the crypto-currencies do not break through the many resistances mentioned as well as the top of the range, the odds remain on the side of a continuation of the decline.