 and Ether (ETH) on support – What scenario?")
Bitcoin (BTC) and Ether (ETH) have slowed their falls sharply over the past week. Price volatility has also fallen, leading to slower, horizontal movements on support zones. The price seems to be stabilising little by little, but some areas of both up and downside have not been revisited. This week, we take stock for you
Bitcoin Technical Analysis
Let’s start our analysis of the week with Bitcoin (BTC) and its weekly close which took place overnight. Compared to our analysis of last week, the price of Bitcoin remained rather stable. Indeed, it closed at $30,200 with a volatility for the week of 9%.
This does not give us any relevant information as it stands, but we can note that it ended below the bottom of the range established previously. For the moment, this passage under this point is however too weak to conclude to a real break.
It will be necessary to remain attentive to see if the price will really continue its fall to come to revisit the zones of the old ATH ($18,850) and the impulse zone between $11,400 – $14,000.
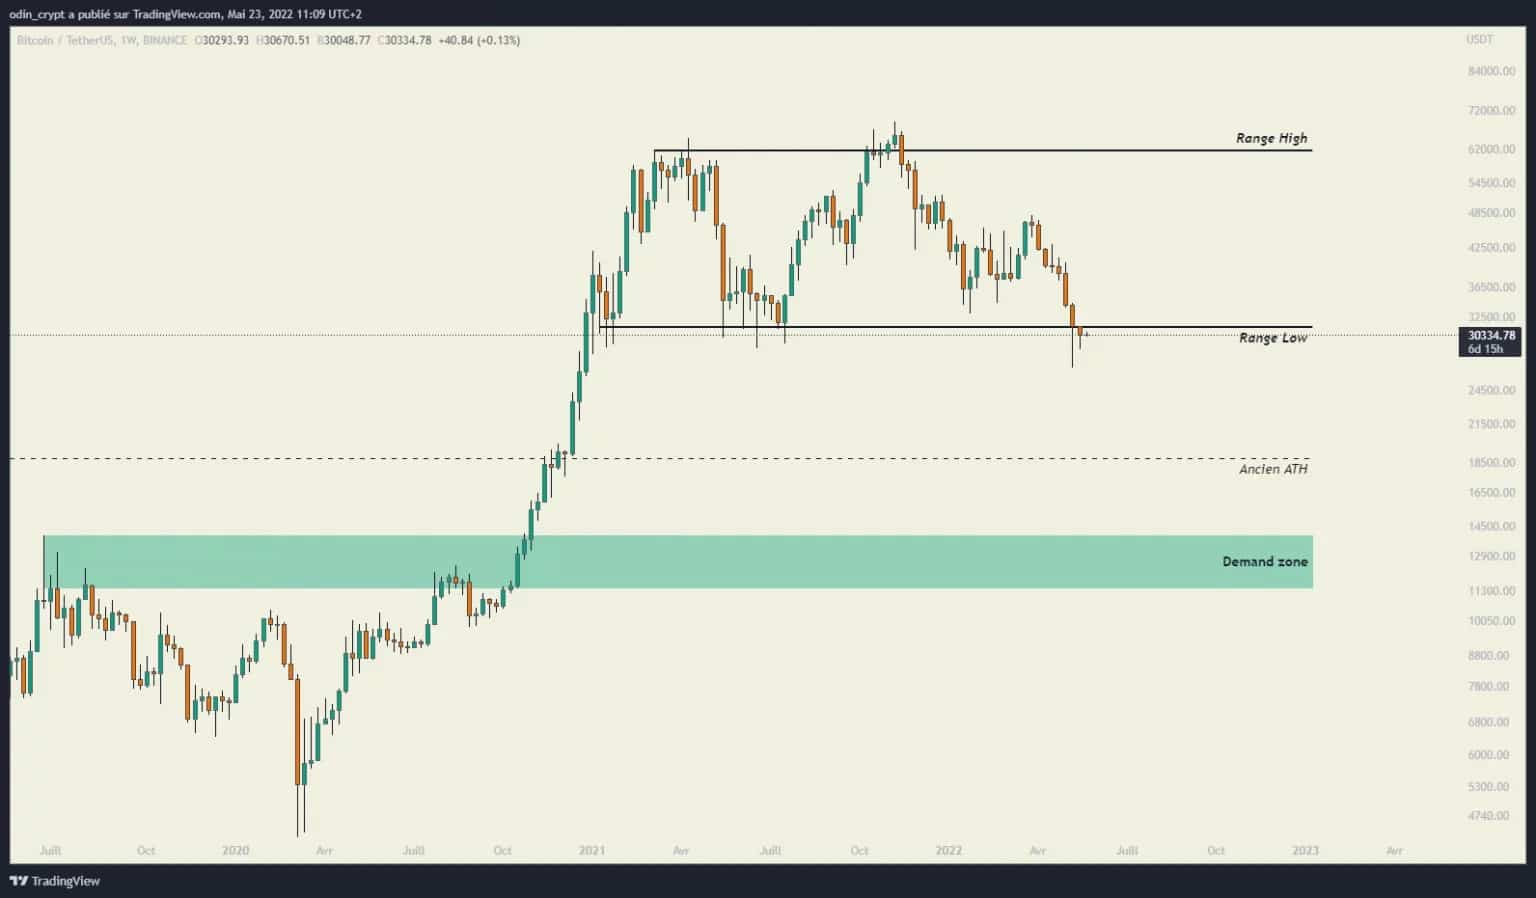
Figure 1: Bitcoin (BTC) analysis in 1W
The daily view will give us more details on the week’s movements. We note a drastic reduction in volatility with a temporization close to our support zone. The areas mentioned last week are still valid, namely:
- The first sell zone located at $36,500, which corresponds to the last low of the former local uptrend;
- The second important area at $46,000 – $47,000, the last high. Exceeding it on one or more daily closes would be a very strong signal of a more significant bullish recovery.
A rebound is therefore possible up to these areas acting as a retracement and reloading of the downward movement. To put it simply, we would regain selling strength on the upside before continuing the initial move.
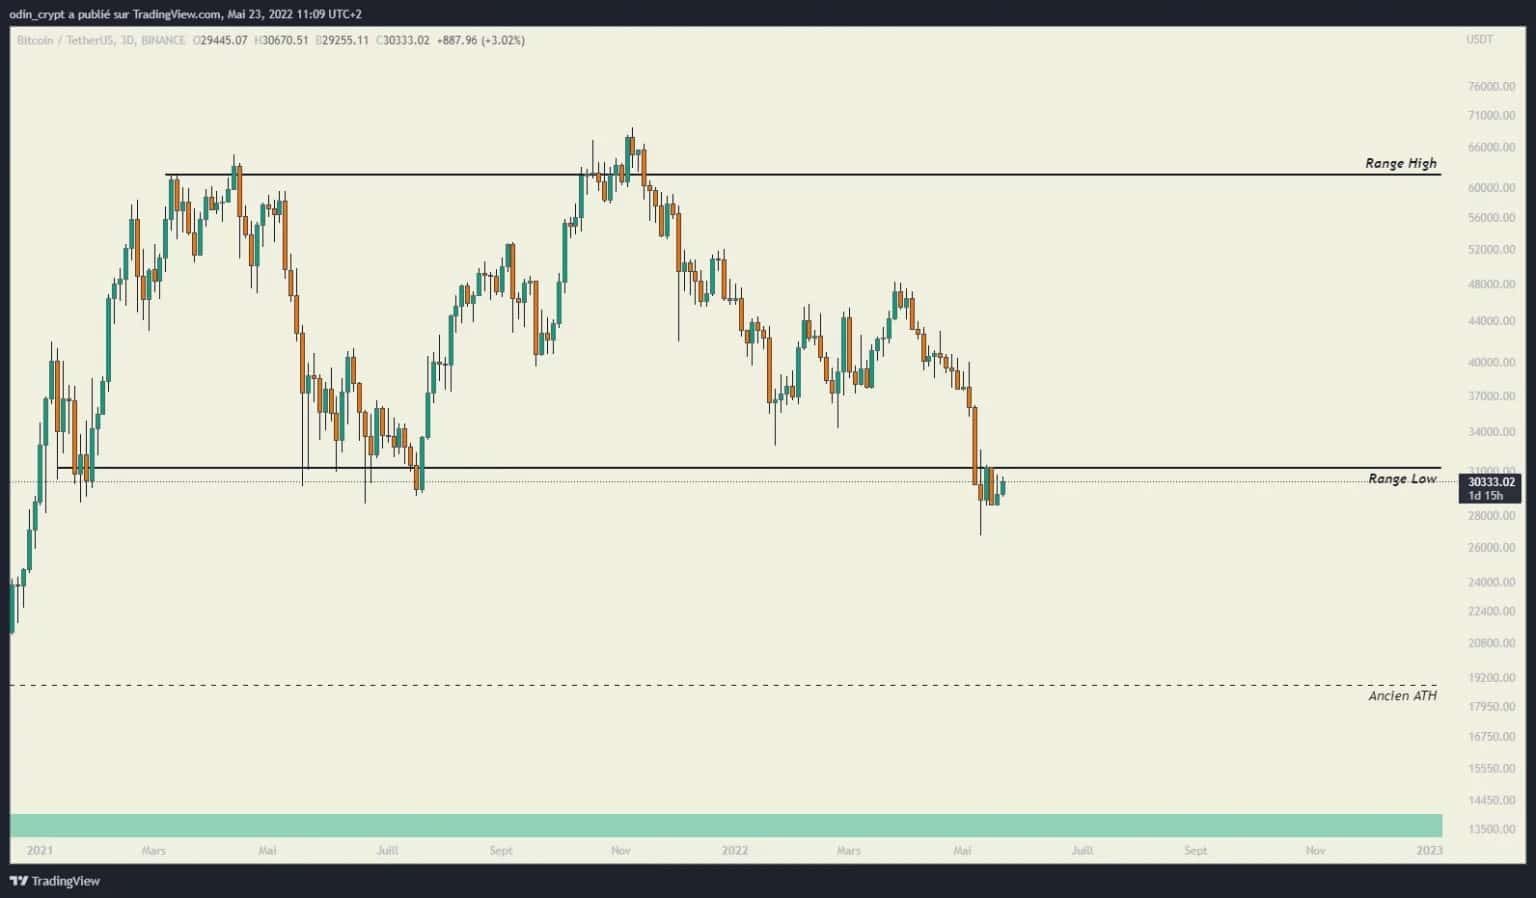
Figure 2: Bitcoin (BTC) 3D analysis
The most relevant time unit this week is the 1 hour time frame. Indeed, we can observe a very clear range scenario on this view. The upper bound takes place at $30,700 for a lower bound at $28,700. We can see an initial “deviation” phase to $31,300 followed by a retracement to the lower bound. The likely scenario now is a bullish retracement to $31,000 before a downward phase to the $28,300 area.
From here, I would like to see a bullish recovery to really start the retracement of the bearish move towards $37,000 at least.
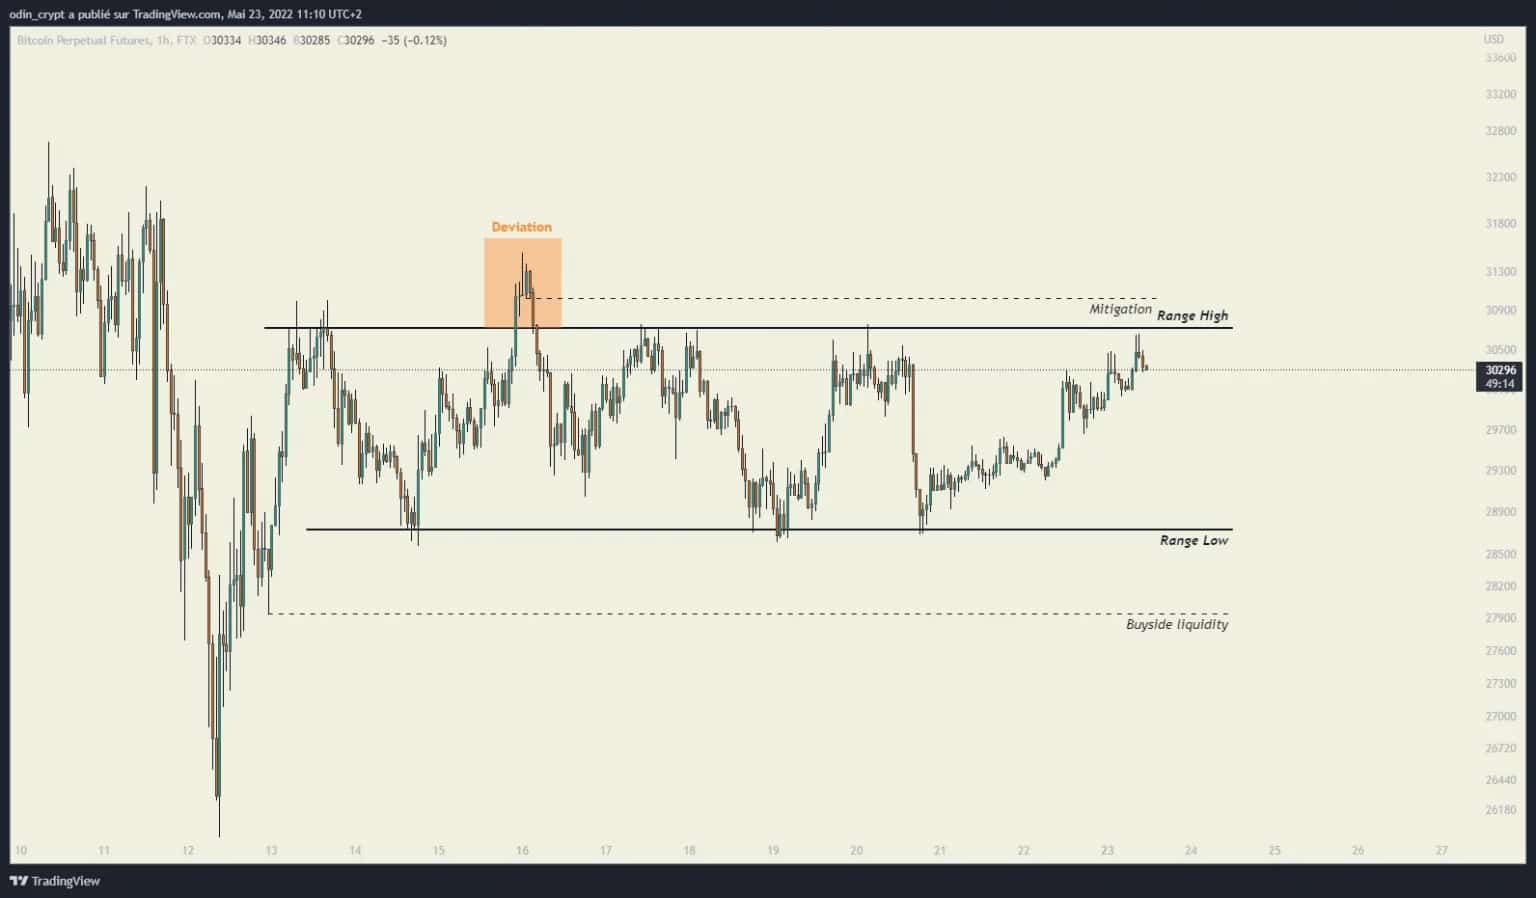
Figure 3: Bitcoin (BTC) analysis in 1h
Ether (ETH) technical analysis
Ether (ETH) remains in the same configuration as its counterpart. Indeed, as Bitcoin has regained dominance in financial trading, it sets the pace for all others.
Its weekly pattern is logically the same, and the price of Ether is also on its lower range bound. The range is $1,850 – $4,000, and the loss of the lower bound would also see it revisit the lower areas.
- The first being the former ATH at $1,300;
- The second being the bullish impulse between $428 – $488.
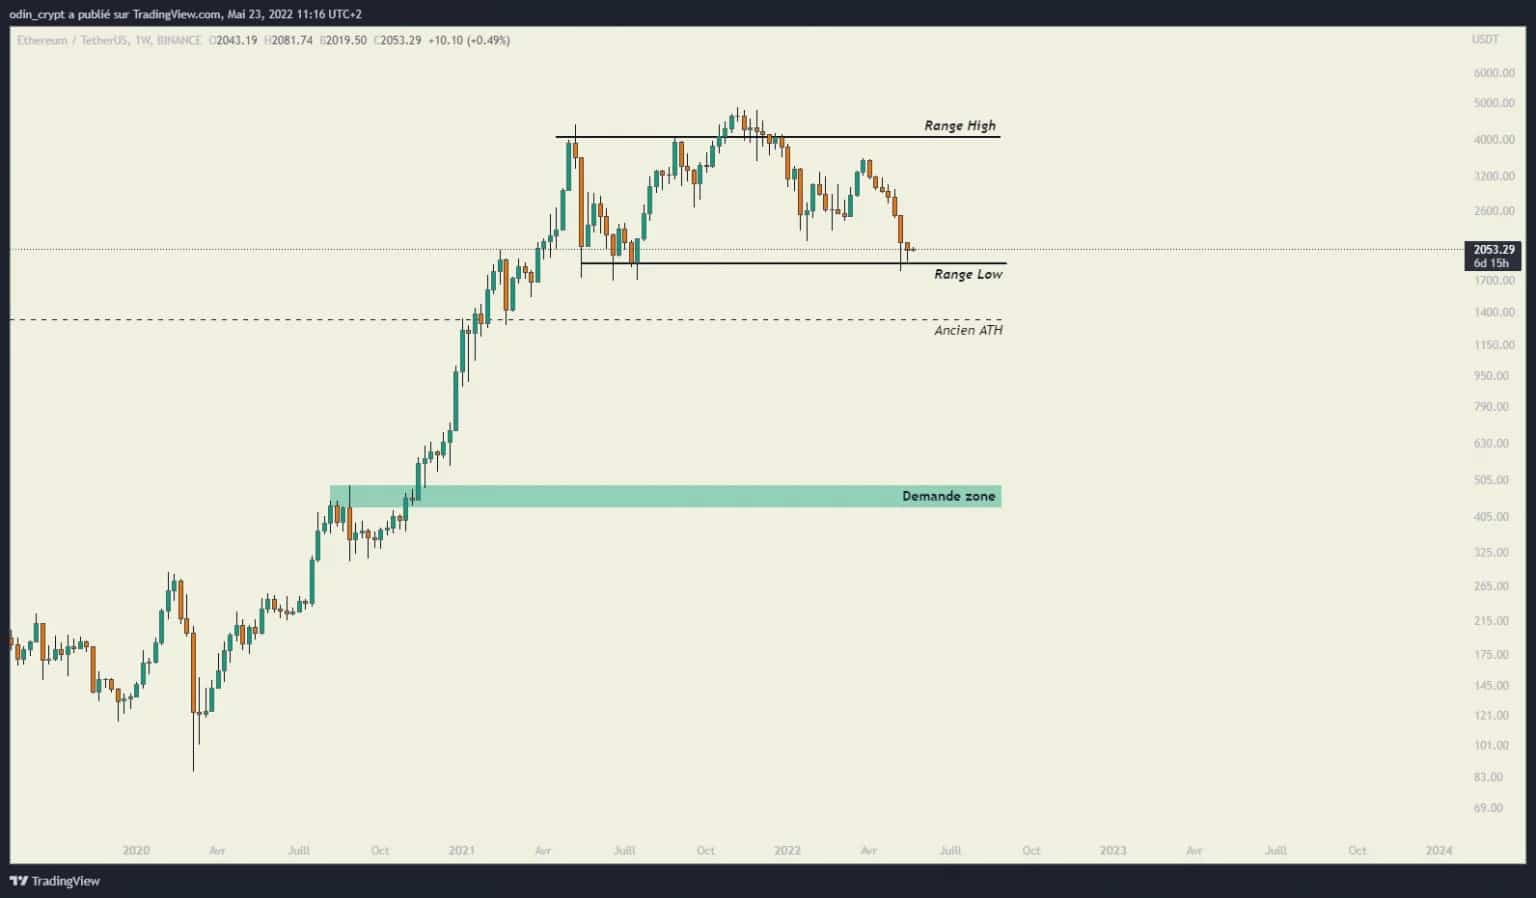
Figure 4: Ether (ETH) analysis in 1W
Let’s focus on the daily view to understand the movements within the range. Here again there are two interesting areas for our analysis:
- The area at $2490 corresponding to the last low passed on the downside;
- The $3,500 area corresponding to the last high that will have to be retaken to restart a bullish momentum.
As long as these two areas are not retaken, the price will be able to retrace to these points while maintaining a downward momentum. This means that there are two trading options:
- The first option is to buy in the current area to play a retracement with securing profits on the mentioned areas;
- The second option is not to take new positions and secure old positions in the mentioned areas.
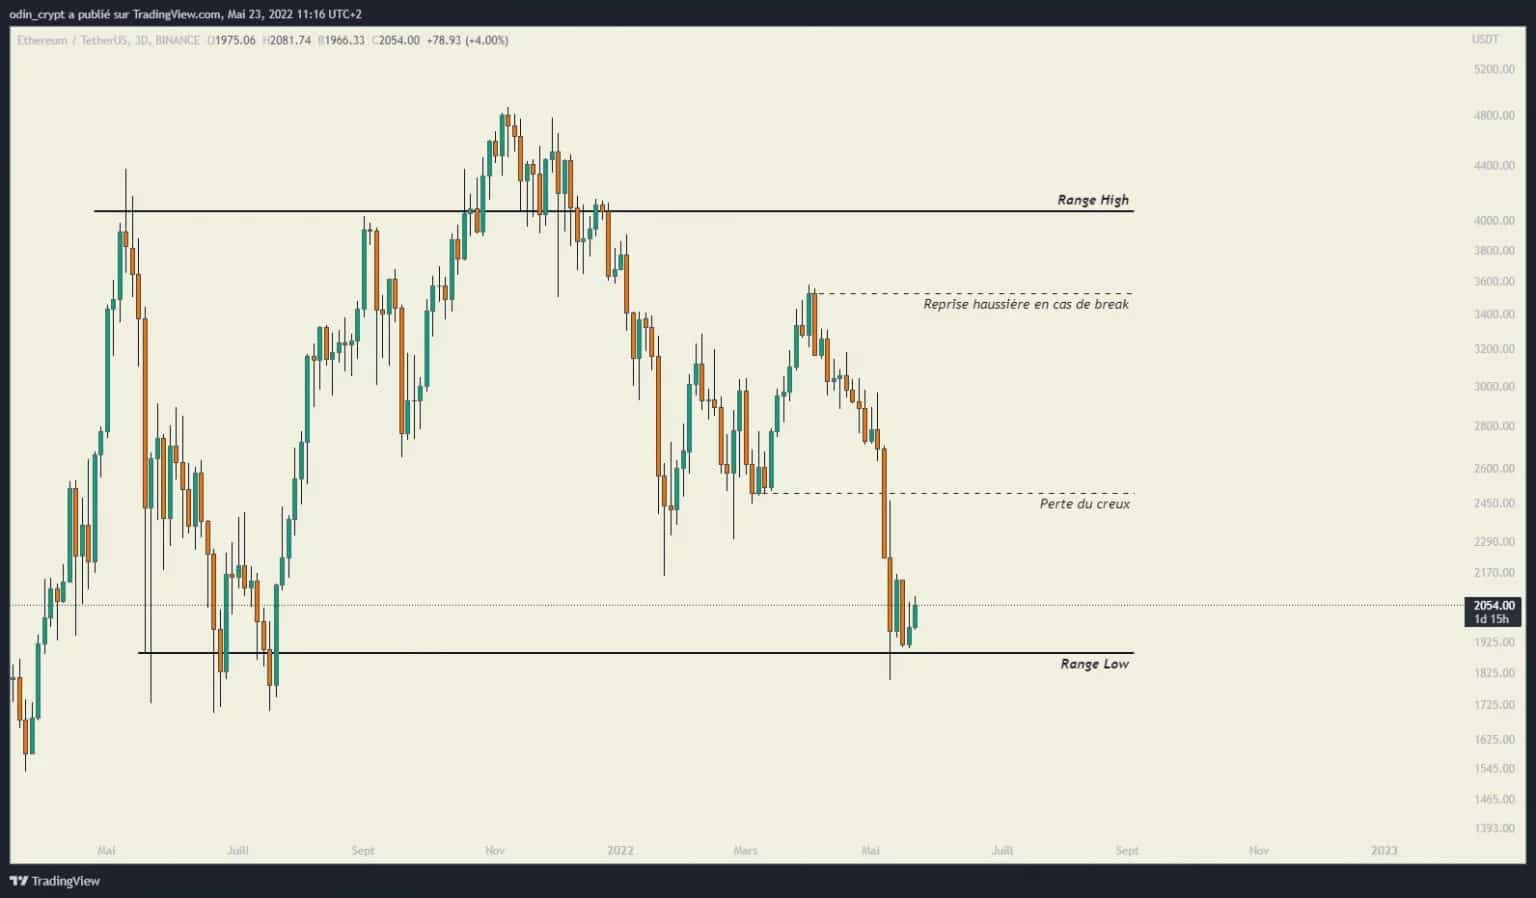
Figure 5: Ether analysis (ETH) in 3D
On the 4h view, we can also see this range phase that has been developing since last week and which is delaying the selling attacks. It will be necessary to wait for a resolution of the latter to come and place oneself accordingly (to buy or sell)
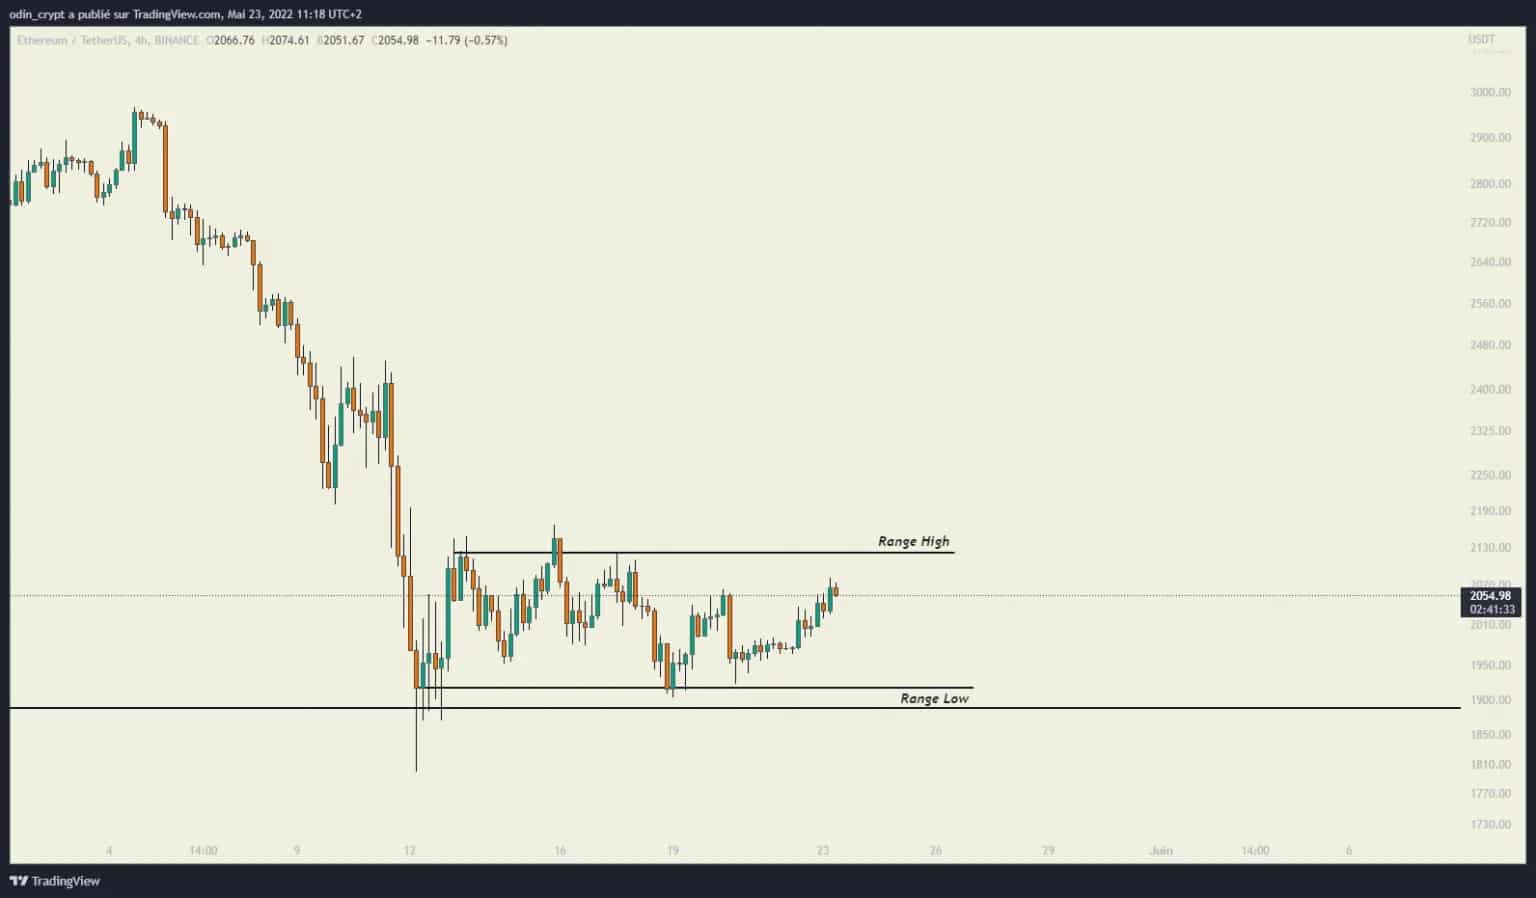
Figure 6: Ether (ETH) analysis in 4h
Technical analysis of The Sandbox (SAND)
Today I am revisiting my analysis done for Cryptoast a few weeks ago where I mentioned the possibility of a full retracement of the move. It involved a move to $0.66 – $0.88. Despite a lot of very aggressive comments on this assumption on my Twitter account, the price has come to revisit this area. There is nothing magical about this, and it is simply due to a retest of the impulse zone. This order block area (noted on the chart) served as the starting point for a particularly violent move higher. The market needs to correct its excesses by coming back to this area.
Interestingly, the SAND price pattern is now bearish on local time units. The price needs to regain the $2.43 level by breaking through it, to see the structure change from bearish to bullish. Until then, it will be possible to bet on a retracement.
Be careful though, the price ranges will be large, as this cryptocurrency is very volatile.
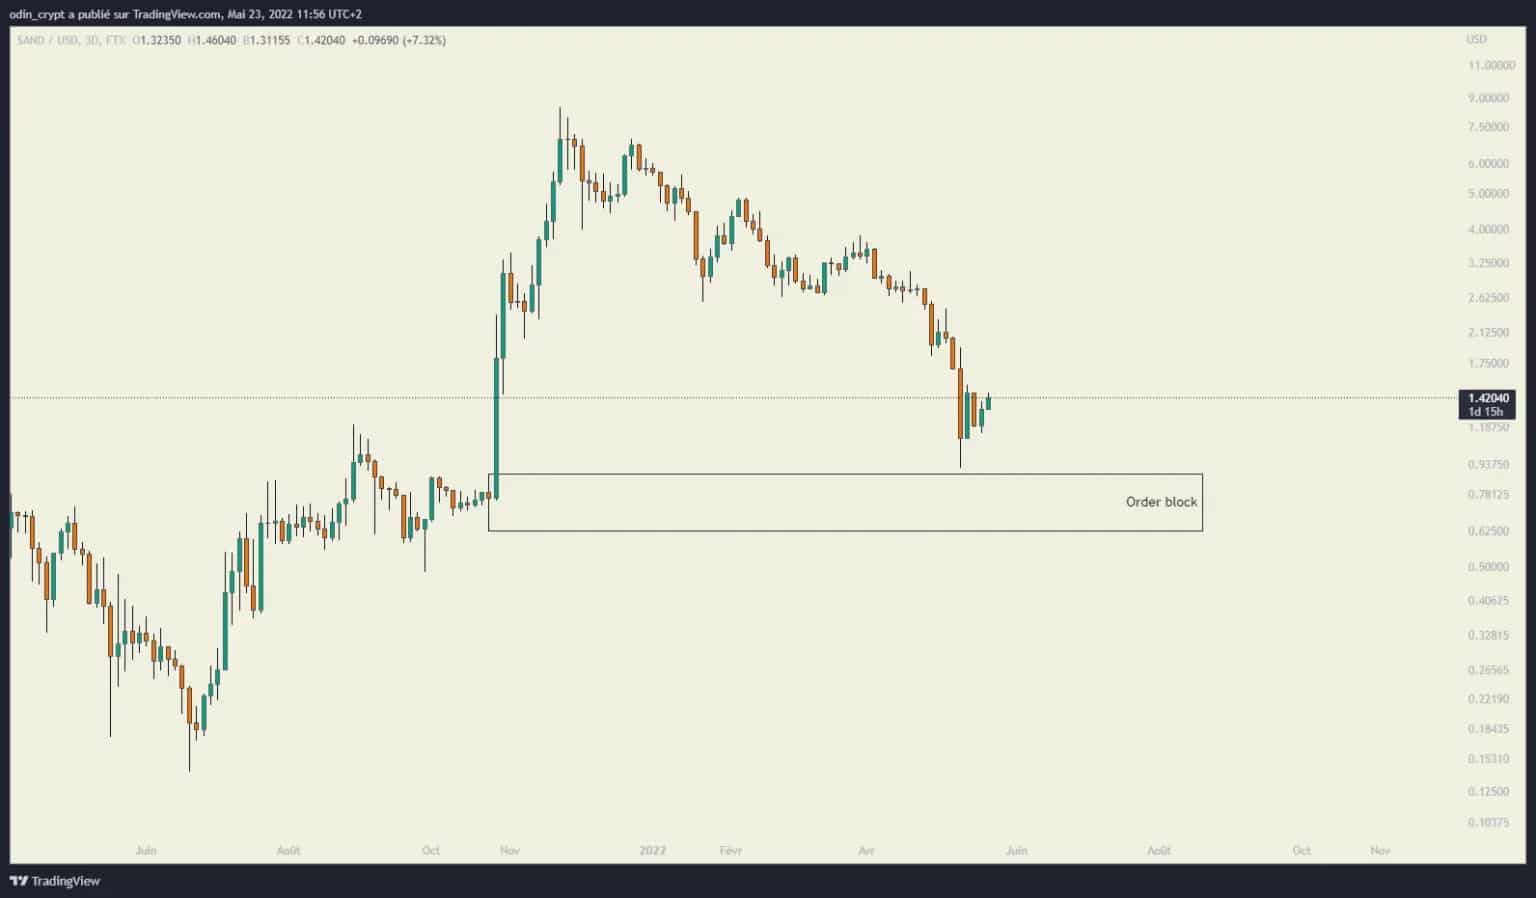
Figure 7: 3D analysis of The Sandbox (SAND)
Conclusion
Bitcoin (BTC) and Ether (ETH) are both at the bottom of their respective ranges. The volatility of the past few weeks has gradually disappeared, giving way to more horizontal movements without a trend. In this chaos, short term range scenarios are gradually emerging, creating opportunities for speculators, and impatience for investors. There are still very local areas that the price will have to revisit before starting a retracement phase of the downward movement. With this in mind, it will be interesting to secure profits or reduce losses on the selling areas.
For The Sandbox (SAND), the price is in a very interesting buying zone. However, it also remains in a local bearish configuration, forcing speculators to secure their profits in case of a retracement of the downward movement. A recovery from $2.43 would be a very good sign for a deeper bullish recovery.