
After an explosive weekend, the market is breaking its important supports. Bitcoin (BTC) and Ether (ETH) are starting a deeper structural change to the downside. What exactly is going on? We take stock of the situation.
Technical analysis of Bitcoin (BTC)
Last week, I raised several scenarios for Bitcoin (BTC), including a bullish one. The area that was to hold all assumptions was the $40,000 area, which we could refine with a PAXG analysis. It became clear that the Bitcoin price yielded to the downward pressure without much difficulty.
What is the scenario to expect? How do we approach this phase of the market?
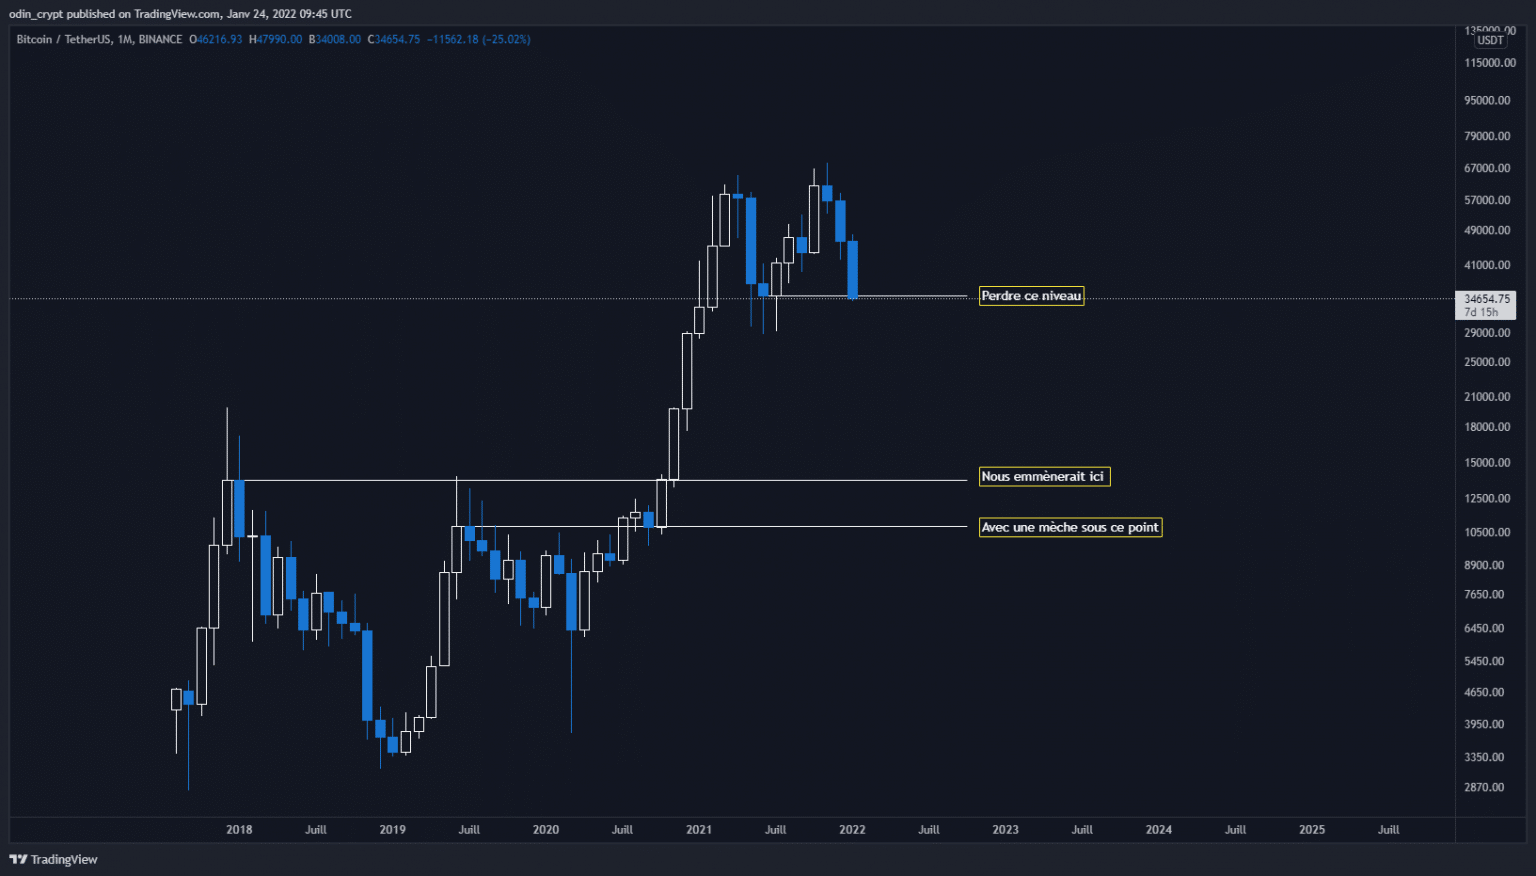
Let’s start our analysis with a look at the monthly view, which will close in 7 days. This last one gives us an interesting indication of the close that will make us completely fall into this famous “bear market”.
We can very easily see that the price must absolutely preserve a close above $35,000 in order not to trigger the much larger retracement scenario. In case of a close below this point, the old ATH at $20,000 becomes an area of interest, but the precise area we want to retest is between $13,700 and $10,000.
Why so low?
This is the last high that when broken to the upside had created the bullish scenario we have been experiencing. Since then, these have not been retested and will undoubtedly act as prime buying areas.
Bitcoin (BTC) analysis in 1M
As always, let’s clarify our observations on the weekly view.
The pivotal area of $40,000 has given way to the downside, and now we have seen a bearish acceleration. The next support of choice remains the $30,000 – $32,000. The latter should be tested quickly, given the current configuration.
Again, there are several scenarios to keep in mind:
- A technical rebound is made on the $30,000 support, and validates the break of the $40,000 by retesting it.
- Price rebounds and regains the lost area, the move retraces higher.
- Price breaks directly through support and accelerates again.
For now, I expect a technical bounce towards $40,000. This point will be a great place to take a short.
Bitcoin (BTC) analysis in 1W
Ether (ETH) technical analysis
Let’s move on to the analysis of the Ether (ETH).
Last week we mentioned the need to retake the $3,630 area to re-start a bullish momentum, otherwise the ETH price would remain in a bearish trend. The monthly view gives us, once again, the areas to hold in order not to continue this correction.
A close below $2,200 would trigger this sharp fall scenario. Indeed, the next big support is located at $1,130, corresponding to the last broken and never retested high.
If we extrapolate a bit, the capitulation of this move would then be at the $435 low. Obviously, for the moment this scenario cannot be realized until we have the closing point of the month.
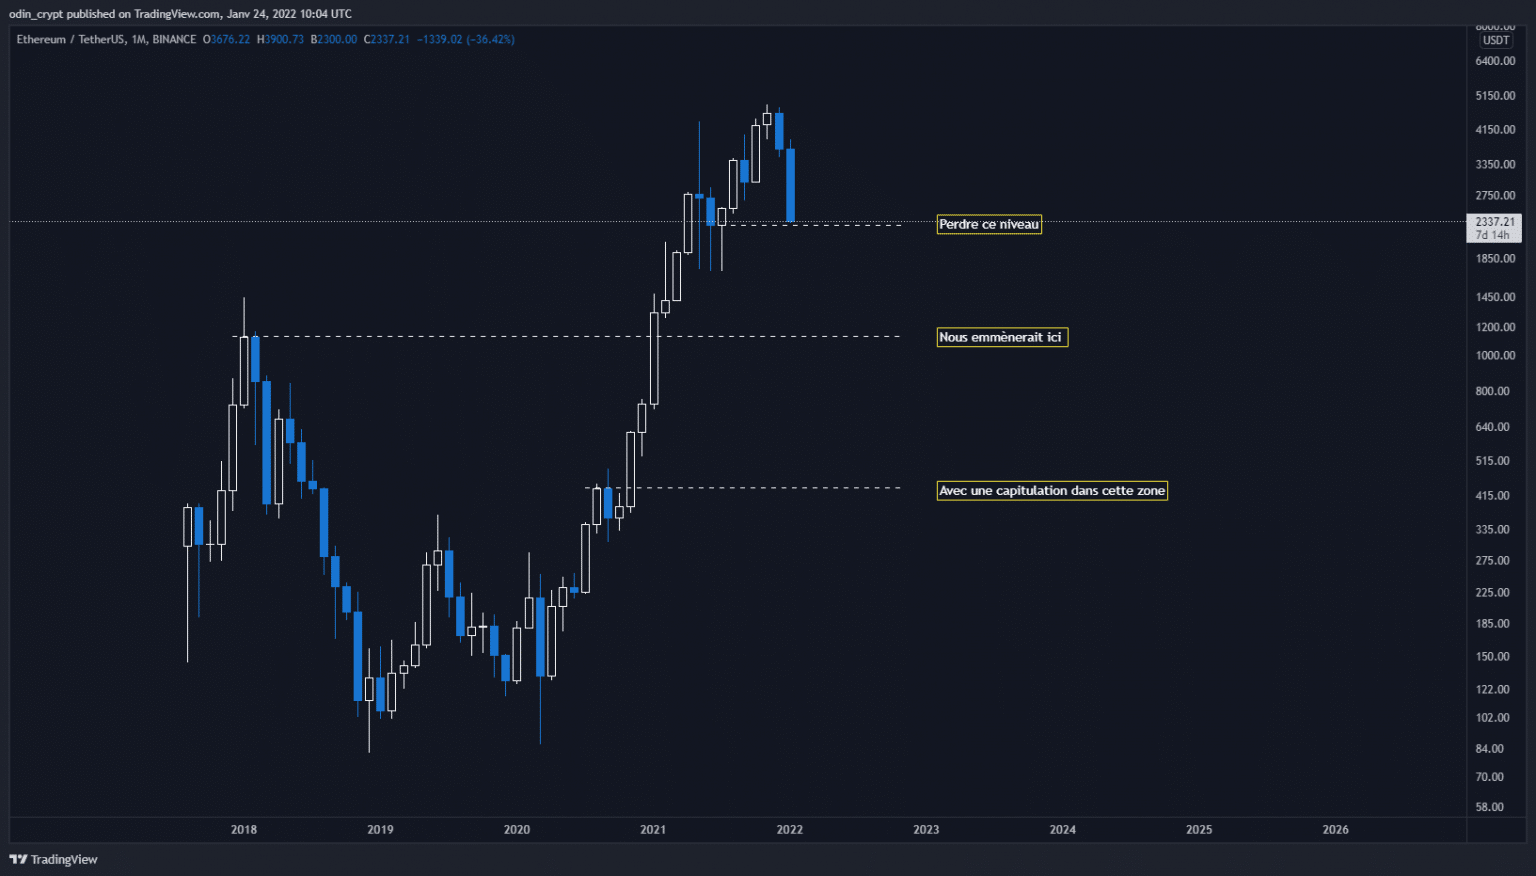
Ether (ETH) analysis in 1M
If we zoom in on the weekly view, we can already note the $3,000 area as a pivot point that would allow us to take short positions in case of a retracement. The support level is at $1,900. The price seems well on its way to return to this area in order to test it again.
It will be necessary to observe the movements to be followed and not to be overwhelmed, one will prefer to buy the supports and to take profits on the resistances/pivot zones.
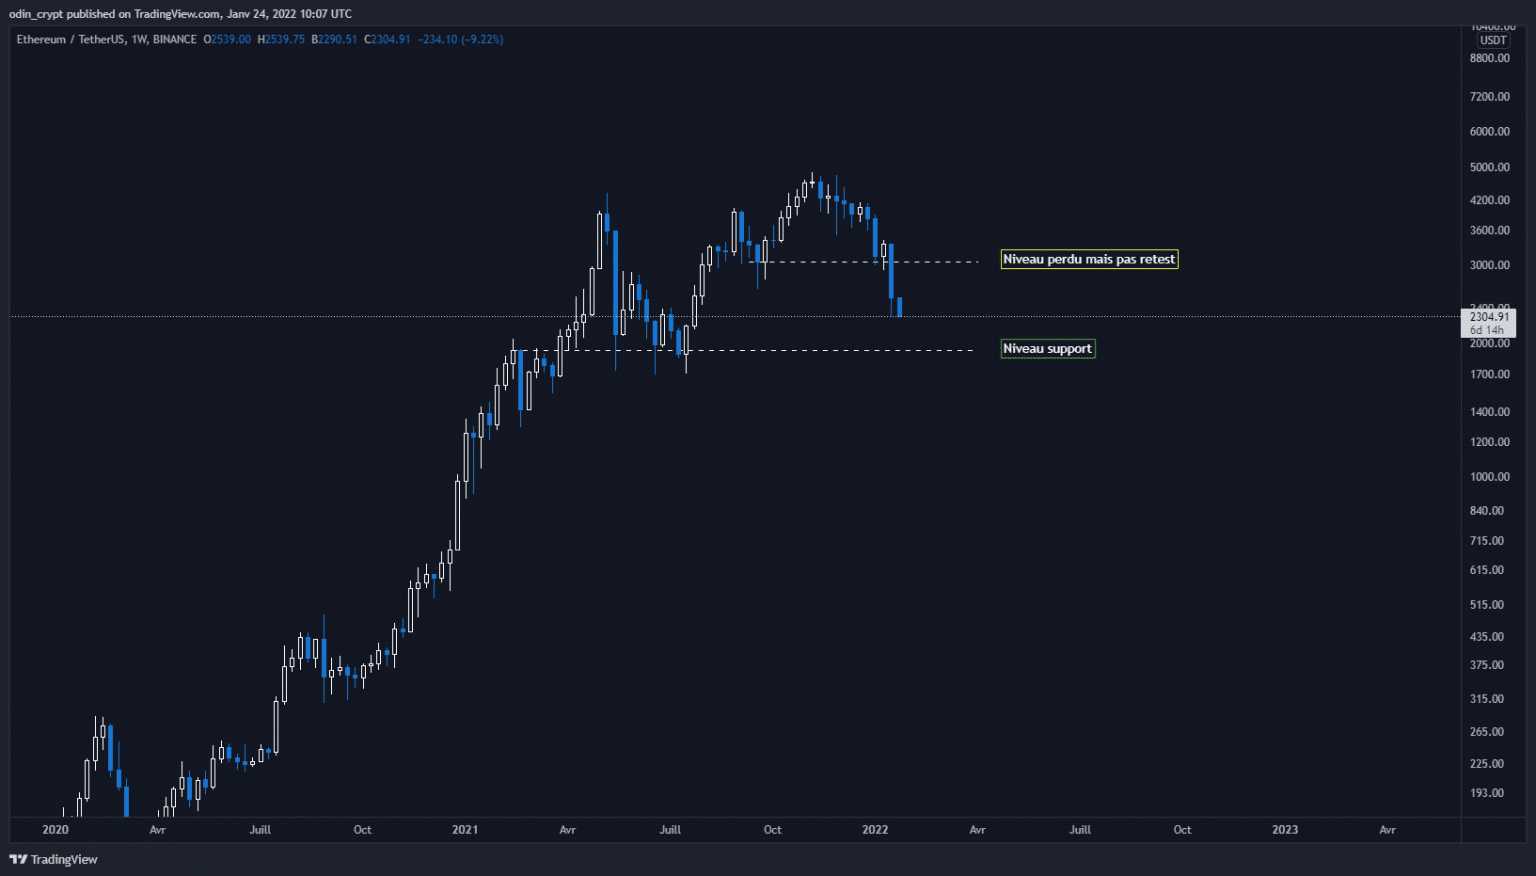
Ether (ETH) analysis in 1W
Solana Technical Analysis (SOL)
I would like to provide an update on Solana (SOL), as I know this crypto-currency is very hot for many. I posted an initial analysis on December 10, 2021 on my Twitter account:
$SOL
Interesting to note that this corner went quickly to the moon without ever retesting its high. The beginning of the move has already been tested, and comes back on. If the $172 doesn’t hold, head to the $123 last defense zone. If it breaks, next support at $55 pic.twitter.com/zzFcVnEc64– cryptOdin (@odin_crypt) December 10, 2021
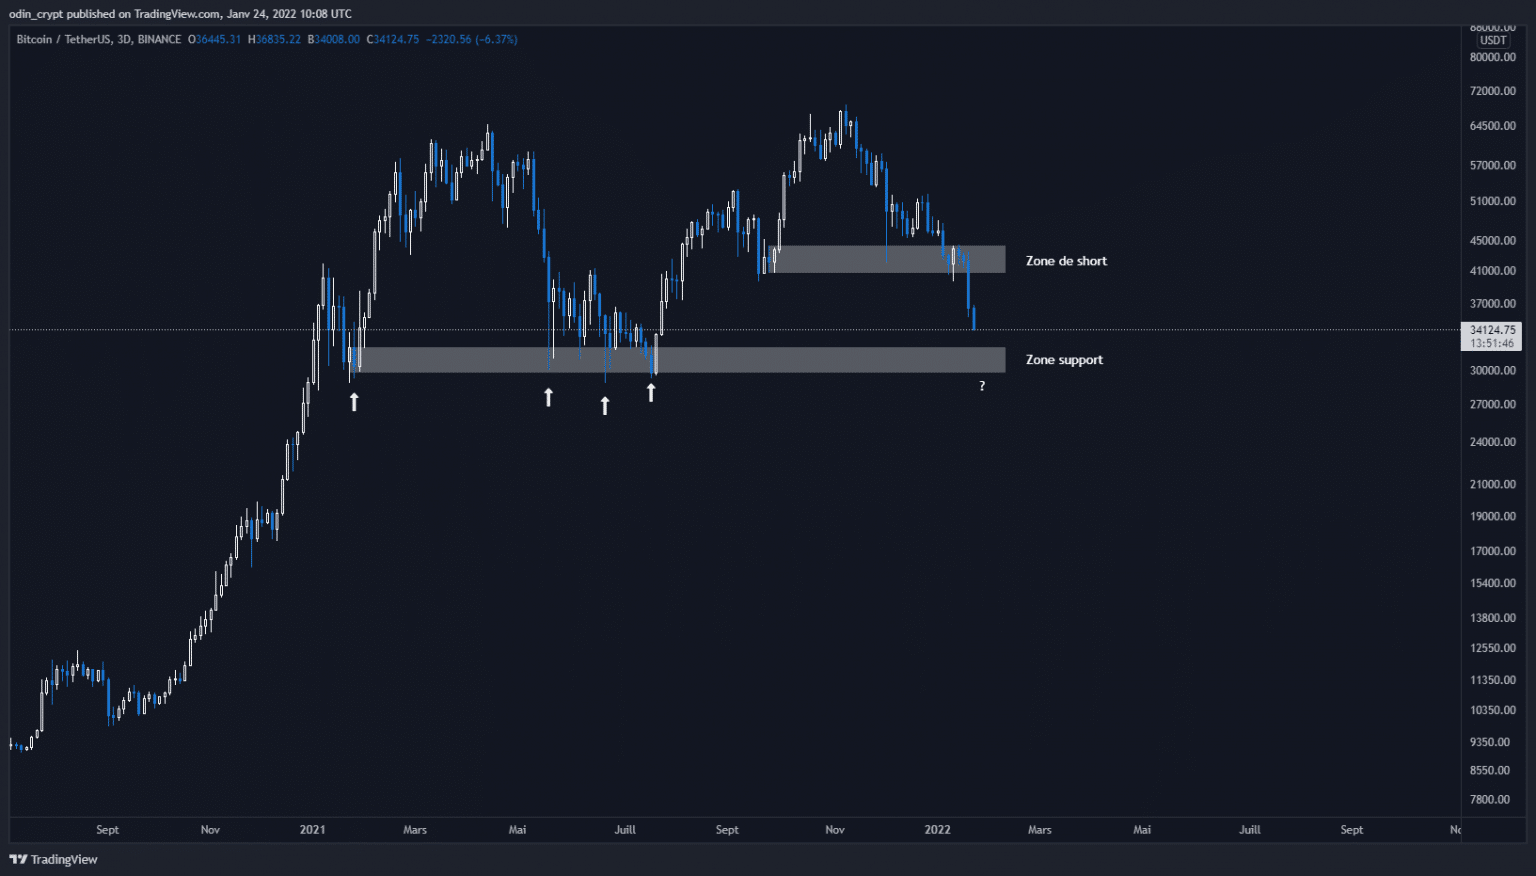
By now, the price movements have had ample time to develop, validating the theory initially observed. The price of SOL will inevitably return to the $55 area which corresponds to the last untested high before the bullish wave. This will allow us to take medium-term buy positions to profit in the worst case from a bullish retracement, and in the best case from a new bullish wave.
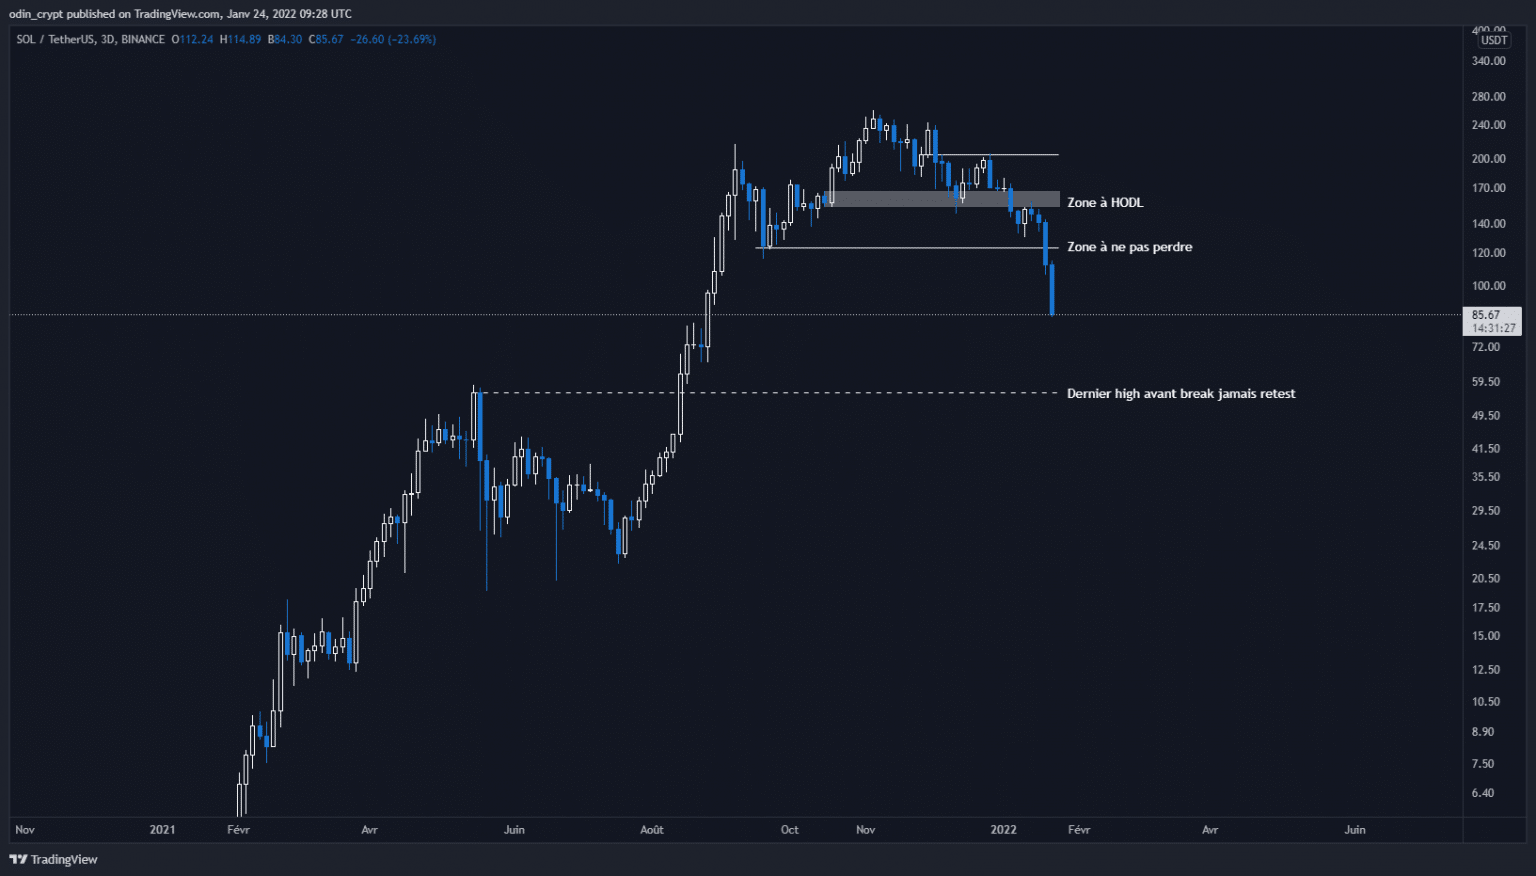
Solana (SOL) analysis in 3D
Conclusion
Bitcoin (BTC) has lost its important support at $40,000, sparking a larger bearish move. For now, the $30,000 – $32,000 support remains the most likely area for a delay in movement. We will have to watch the monthly close, which will give a glimpse of the continuation of the downward movement or a bullish recovery. The $40,000 mark is now a sell zone.
On the Ether (ETH) side, the configuration remains essentially the same. It will be necessary to keep the $2,200 monthly close, and the $1,900 by the end of the week. Otherwise, the bearish continuation could be much more important.
For Solana (SOL), sell signals were observable in the past weeks. Now, the $55 area will offer an interesting buying point to allow us to play a technical bounce up.