
After 3 months of sideways movement, Bitcoin (BTC) and Ether (ETH) are finally breaking out of their range. A bullish move has allowed the price to break out of it. We will see which areas are interesting to buy in order to enter this new market phase with confidence.
Technical analysis of Bitcoin (BTC)
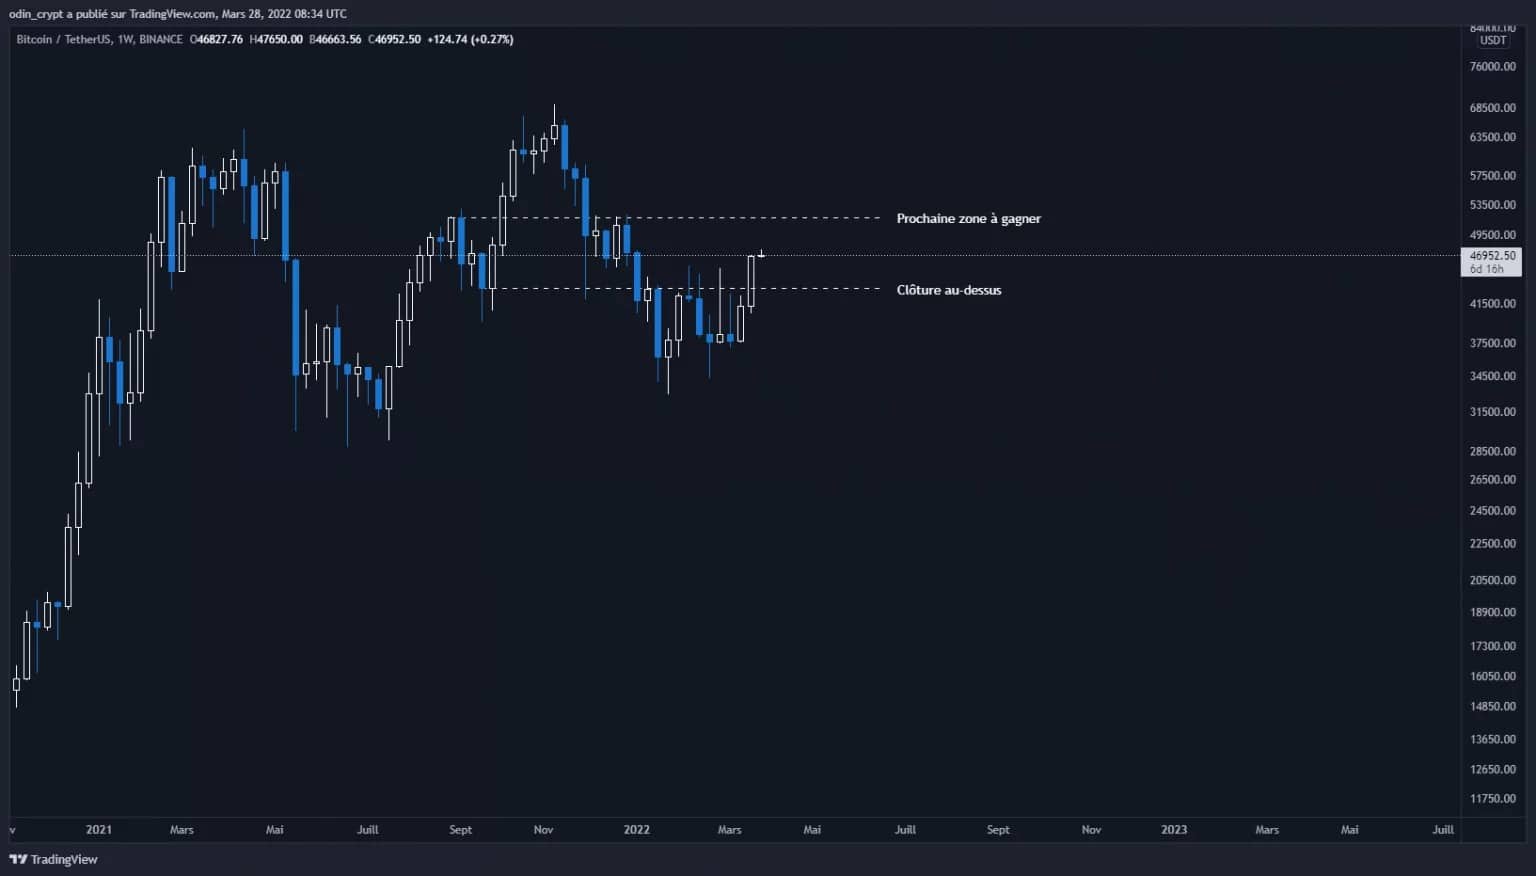
Last week, we mentioned a bullish scenario for the Bitcoin (BTC) price in case of a weekly close above $43,000. This has now happened, with the price closing overnight at $46,800. It is now clear that the price has managed to break out of its range, and that it is resuming a bullish structure.
The next point that will act as a resistance/sell zone is now around $49,000 – $51,000. As with all bullish rallies, the price will need to retrace its movement to validate this change in market state.
Bitcoin (BTC) analysis in 1W
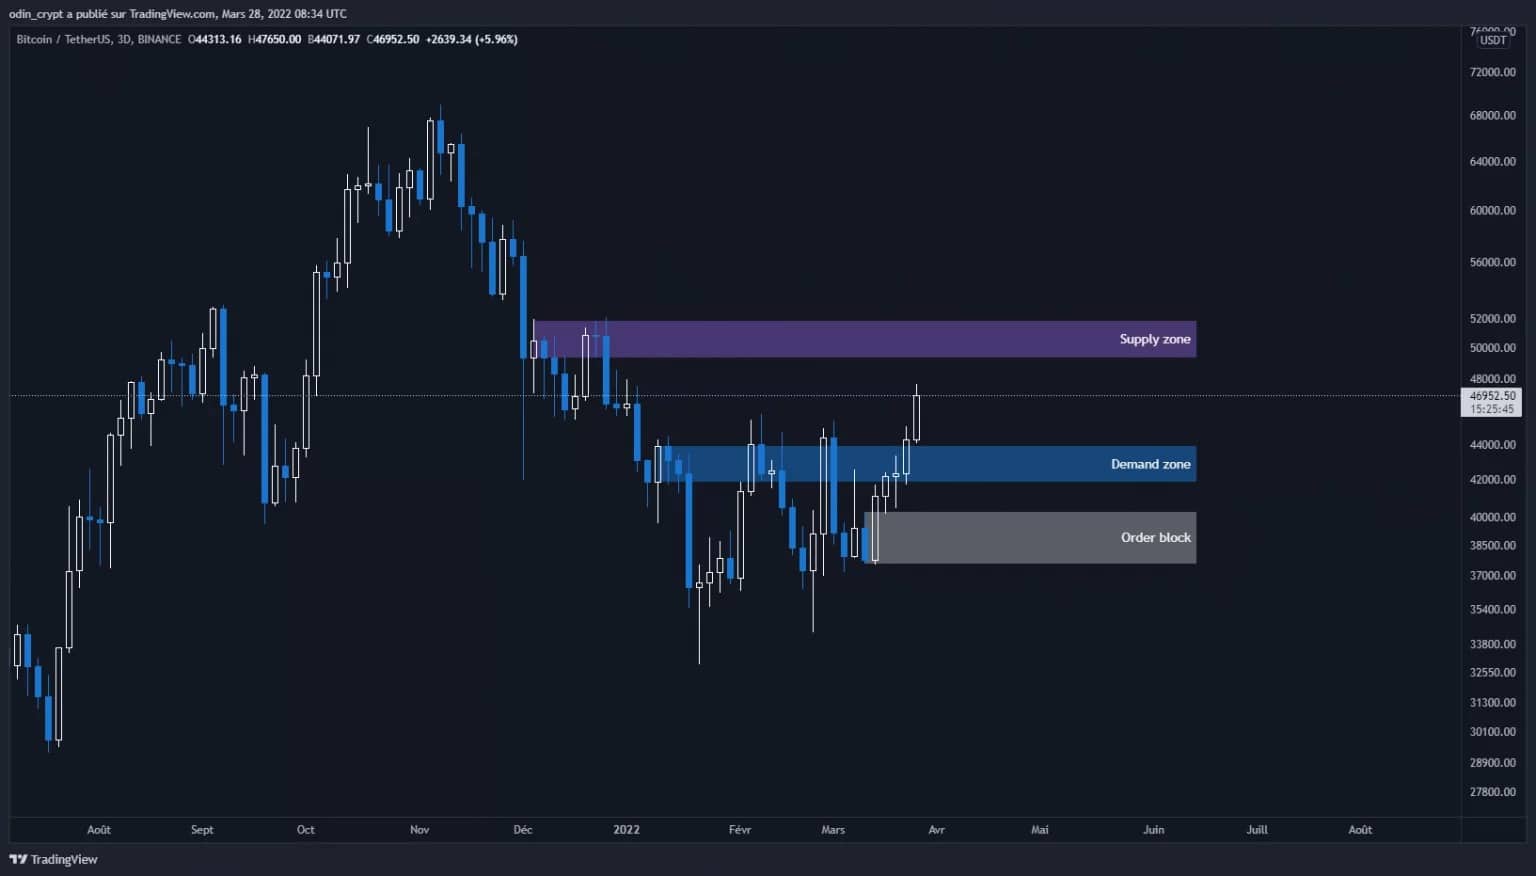
The 3 day grouping will give us more clarity on what happens next. Again, we can clearly see this bullish breakout from the range with an accelerating price movement. The $49,000 – $51,000 area mentioned earlier is identifiable as a sell zone. A recovery of the latter will be extremely positive, as it will be in a bullish context on the monthly view.
Thanks to this move, 2 new areas appear to take buy positions:
- The demand zone at $41,000 – $43,000, corresponding to the former range top,
- The order block area at $37,500 – $40,000, corresponding to the impulse of the breakout movement.
A loss of the $37,500 daily close would be a sign of a market reversal. Indeed, all the buy zones of the macro uptrend have been revisited, and the market will no longer have reason to defend buy zones below this threshold.
Bitcoin (BTC) 3D analysis
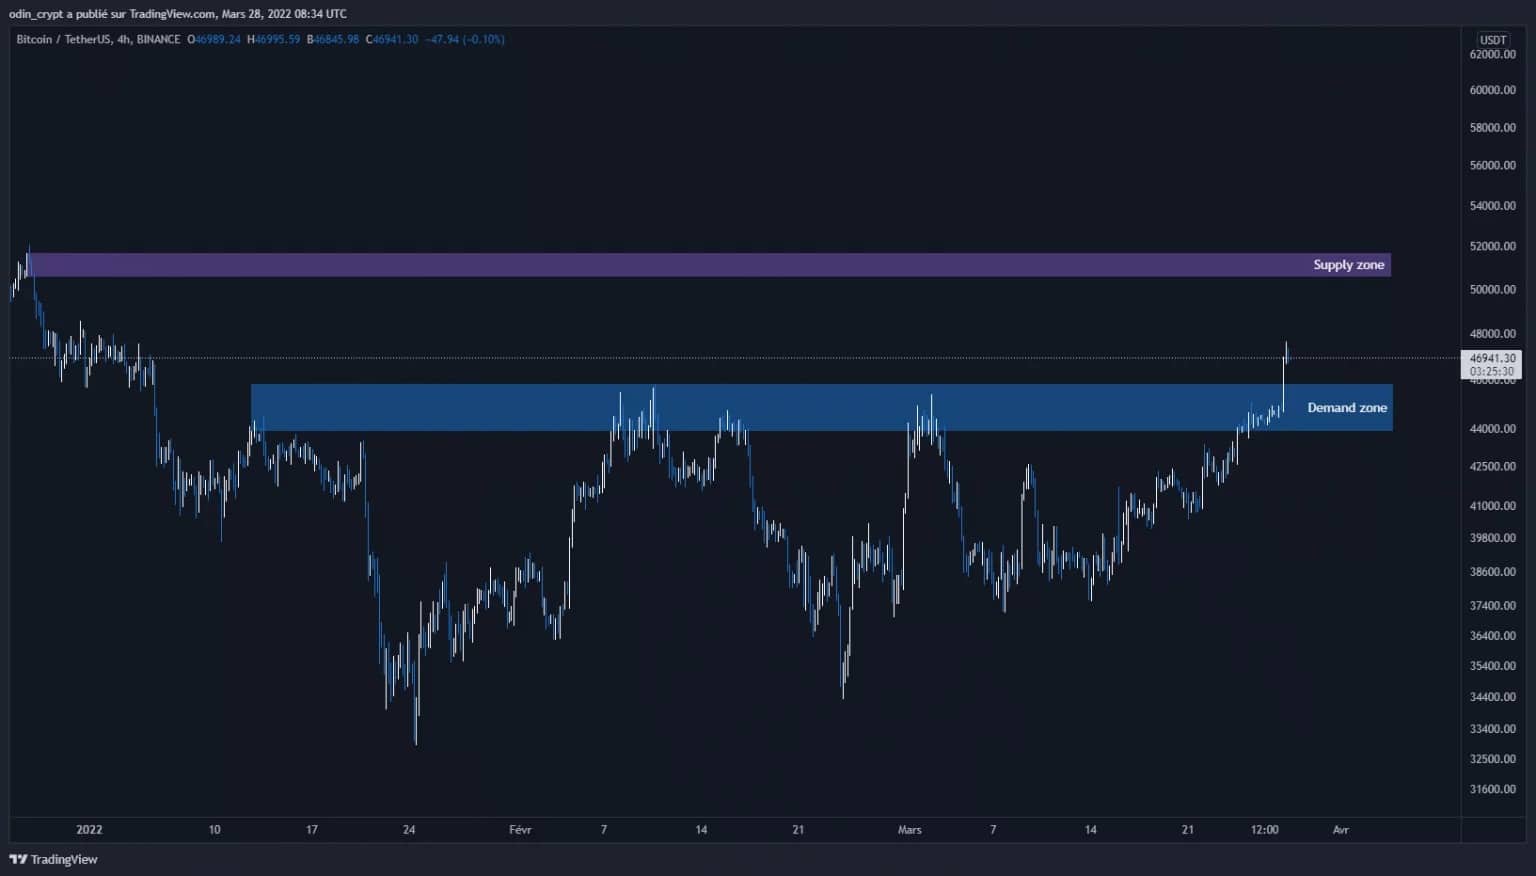
On the 4h view, the information is pretty much the same as on the daily view. We can see our demand zone, and the sell zone at $50,000 – $51,000.
For the time being, the best strategy for a smart investor will be to take a long position on the bullish retracement between $43,000 – $40,000 and wait for a bullish recovery to play future moves. It is quite possible to secure quickly on the first sell zone, and sell on the upside in increments.
Bitcoin (BTC) analysis in 4H
Ether (ETH) technical analysis
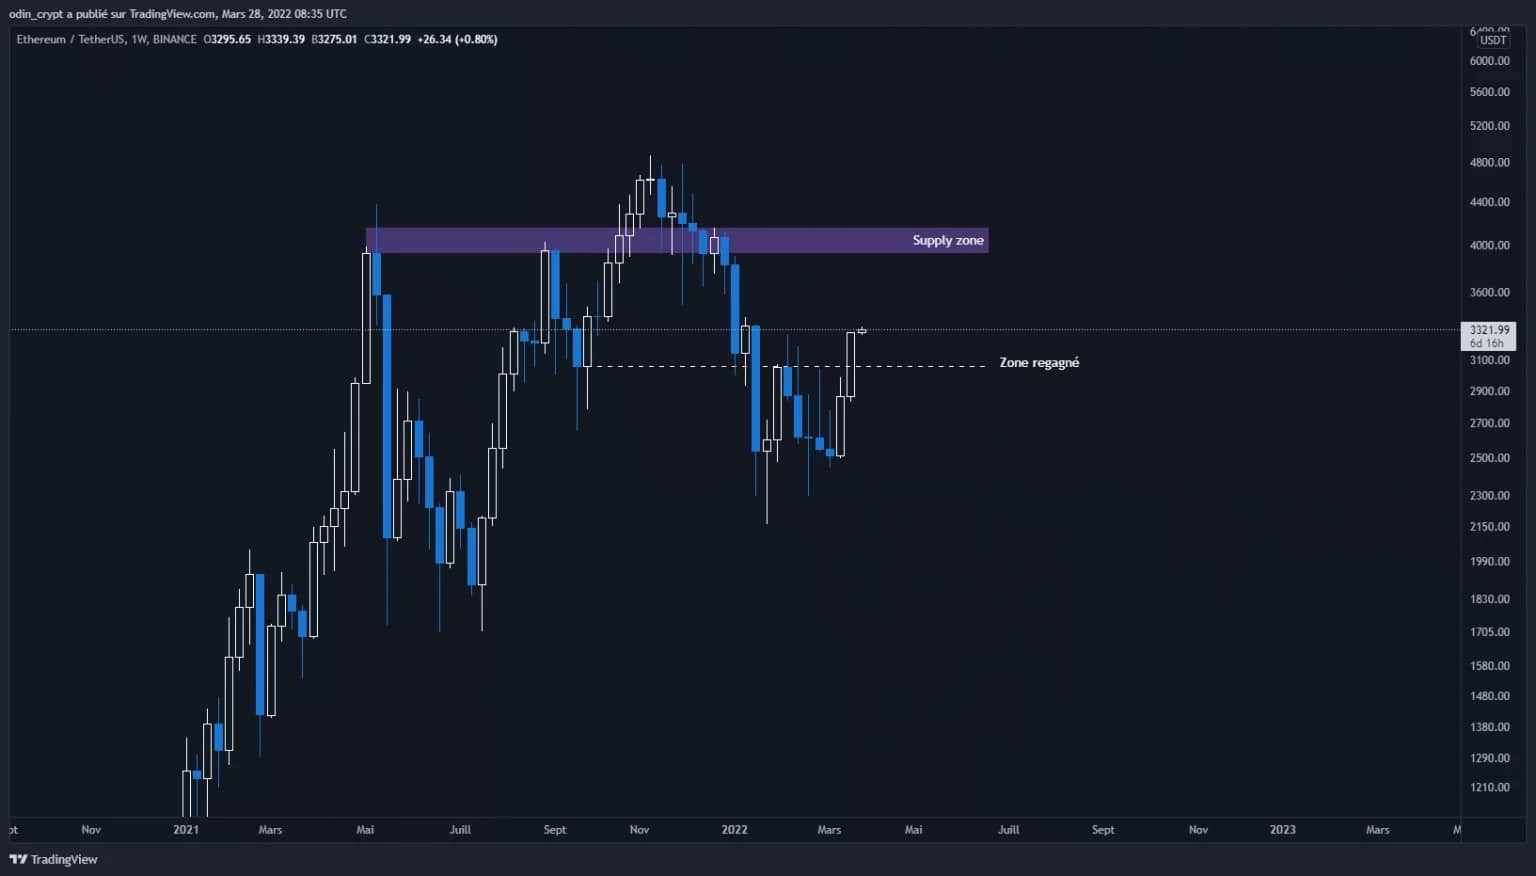
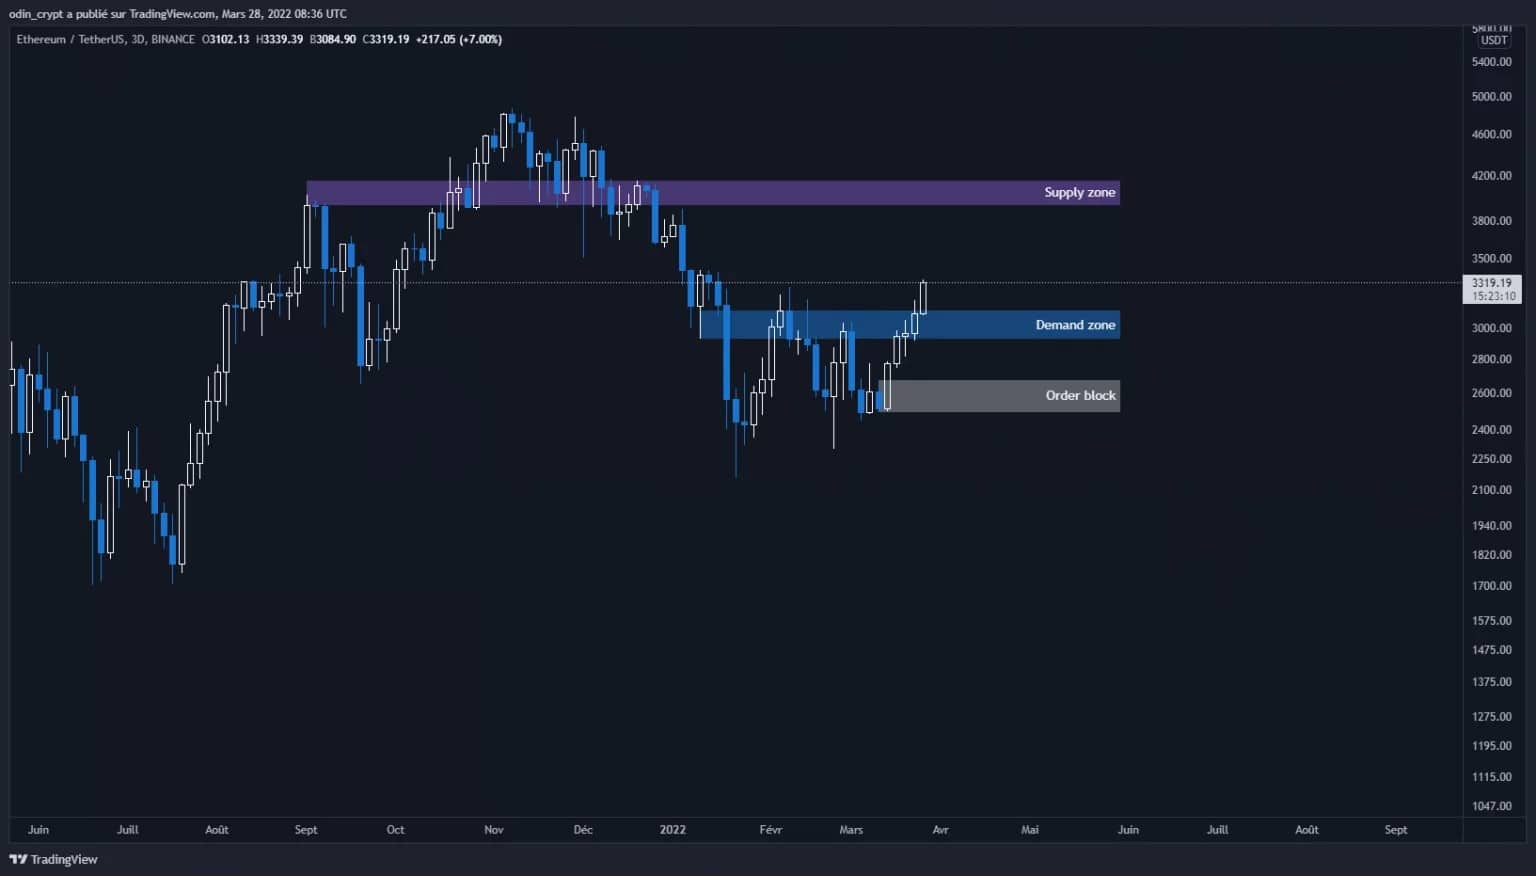
The price of Ether (ETH) has also reacted very well to the bullish breakout of Bitcoin. On the weekly view, the sell zone has also been taken over. Indeed, the price managed to close above $3,000, with a breakout to $3,300. The next major selling area is now $3,900 – $4,150.
The Ether price has also resumed an uptrend, and will need to retrace its movement to validate the structure.
Ether (ETH) analysis in 1W
The daily view will show us this dynamic. We find our sales area mentioned above, and 2 new areas appear:
- The demand zone at $2900 – 3100, corresponding to the former high end of the range
- The block order zone at $2,500 – $2,700, corresponding to the impulse of the upward movement
These two areas will allow buying with the aim of moving up to the new selling area
Ether (ETH) 3D analysis
On the 4h view, we also validate the recovery of the point identified last week at $3,000. A zone of interest is again emerging at $2,650 – $2,750, giving more weight to our analysis on the larger time units.
The point that absolutely must be held in 4h and 1D, is now at $2,500 and corresponds to the last low recently printed.
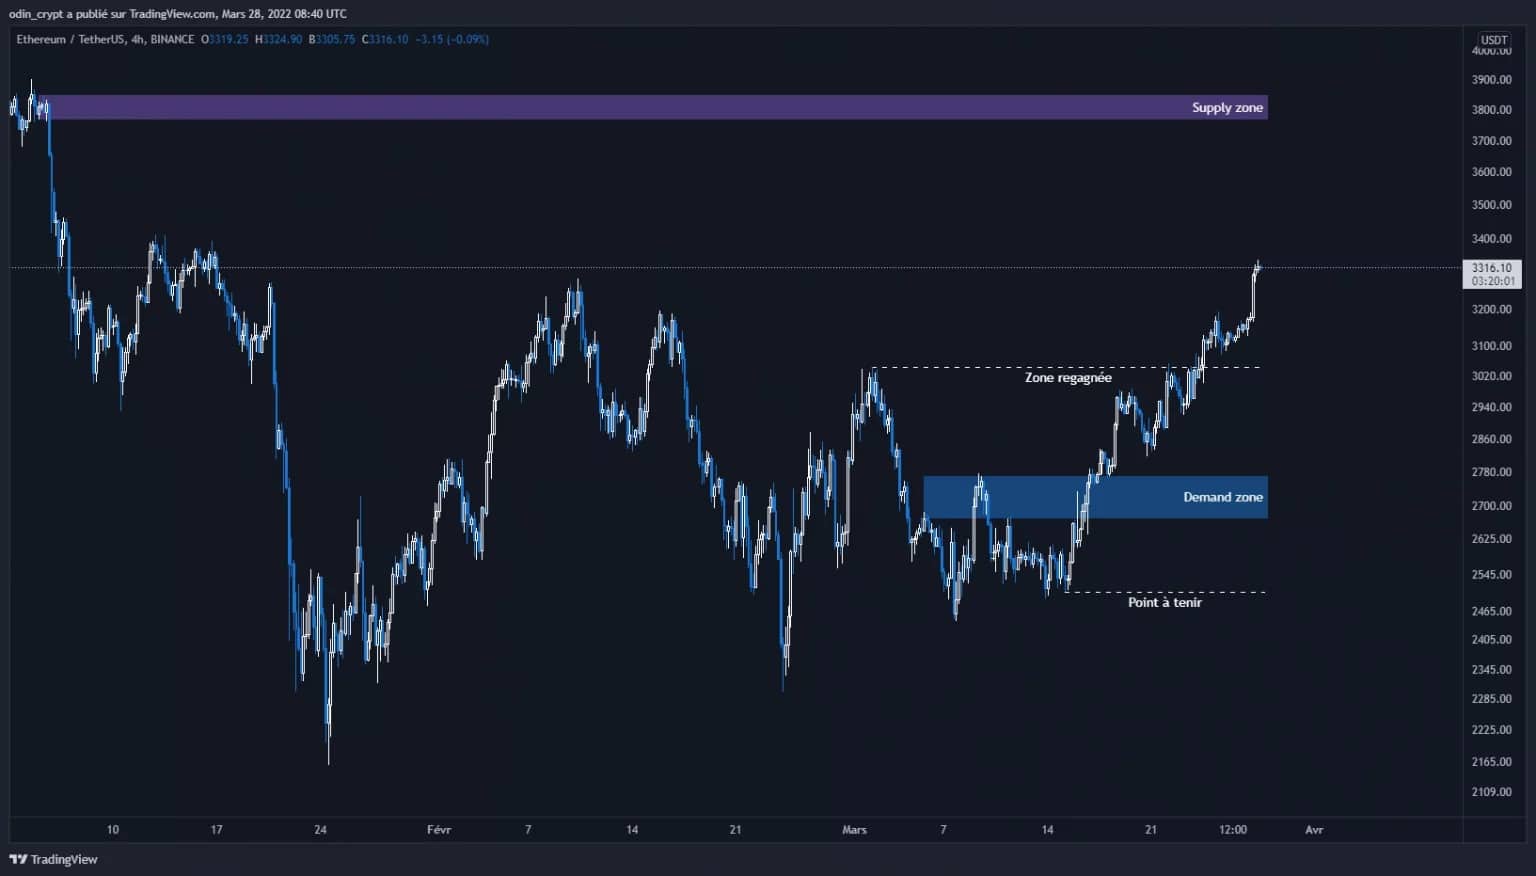
Ether (ETH) analysis in 4h
Technical analysis of Spell Token (SPELL)
Today I propose you the analysis of a token much less known, namely the Spell Token (SPELL). I’m going to explain my analysis to you so that you can correctly identify my entry and exit conditions.
Let’s start with the price structure. This is perfectly bearish on the major time units (daily, weekly). Nevertheless, the price seems to want to make a definitive bottom on this bearish phase. If a local uptrend were to take shape, it would really only be a bullish retracement of a bearish move.
What I am looking at on this assumption is a retracement into the $0.02 order block area. However, the price will have to close above $0.00517 on the daily view. Once this is validated, our plan can take place. The strategy is simple, we will take a buy position on the bearish retracement of the local uptrend. A stop-loss order under the last low will allow us to protect ourselves in case the strategy is invalidated.
Without optimising the strategy, it is possible to have a scenario with a risk/reward of about 33. That is, we gain 33 times our loss.
As this token is very volatile, and is after the top 150 (153rd) it is better to put a risk of 1% or less on this scenario.
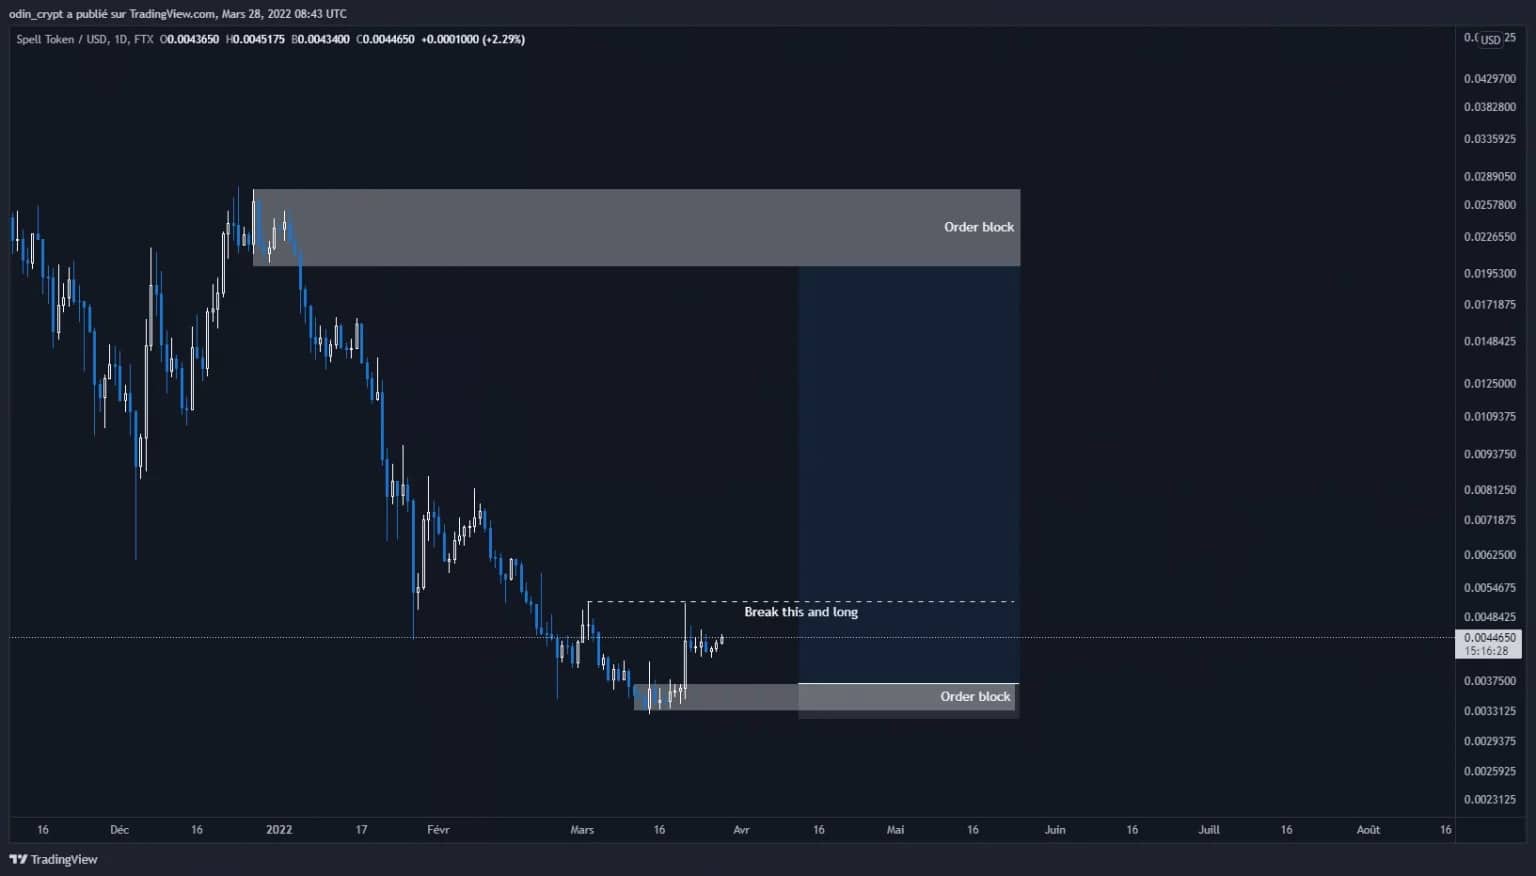
Spell Token (SPELL) analysis in 1D
Conclusion
Bitcoin (BTC) and Ether (ETH) have managed to break out of the range that has held the price since early January this year. Now, the bullish momentum can clearly be established, and the price is heading towards the selling areas:
- $49,000 – $51,000 for Bitcoin
- $3,900 – $4,100 for Ether
However, I expect a retracement in the demand areas, which will allow for buying with less risk.
The Spell Token (SPELL) also presents interesting buying prospects. A daily close above $0.00517 would allow a buying strategy to be initiated with a target of $0.02.