
This week, Bitcoin (BTC) and Ether (ETH) have failed to break through important resistance levels. Should we expect a new fall in the next few days? A look at the targets and the different levels to watch out for
The underlying trend remains bearish for Bitcoin (BTC)
This week, the price of Bitcoin (BTC) has consolidated around $16,800 with resistance still at the Tenkan, the Kijun and then the Cloud of the Ichimoku indicator in Daily. In this configuration, it still seems difficult to envisage a bullish rally as long as the price remains under all these curves since they characterize potential levels of important rejections.
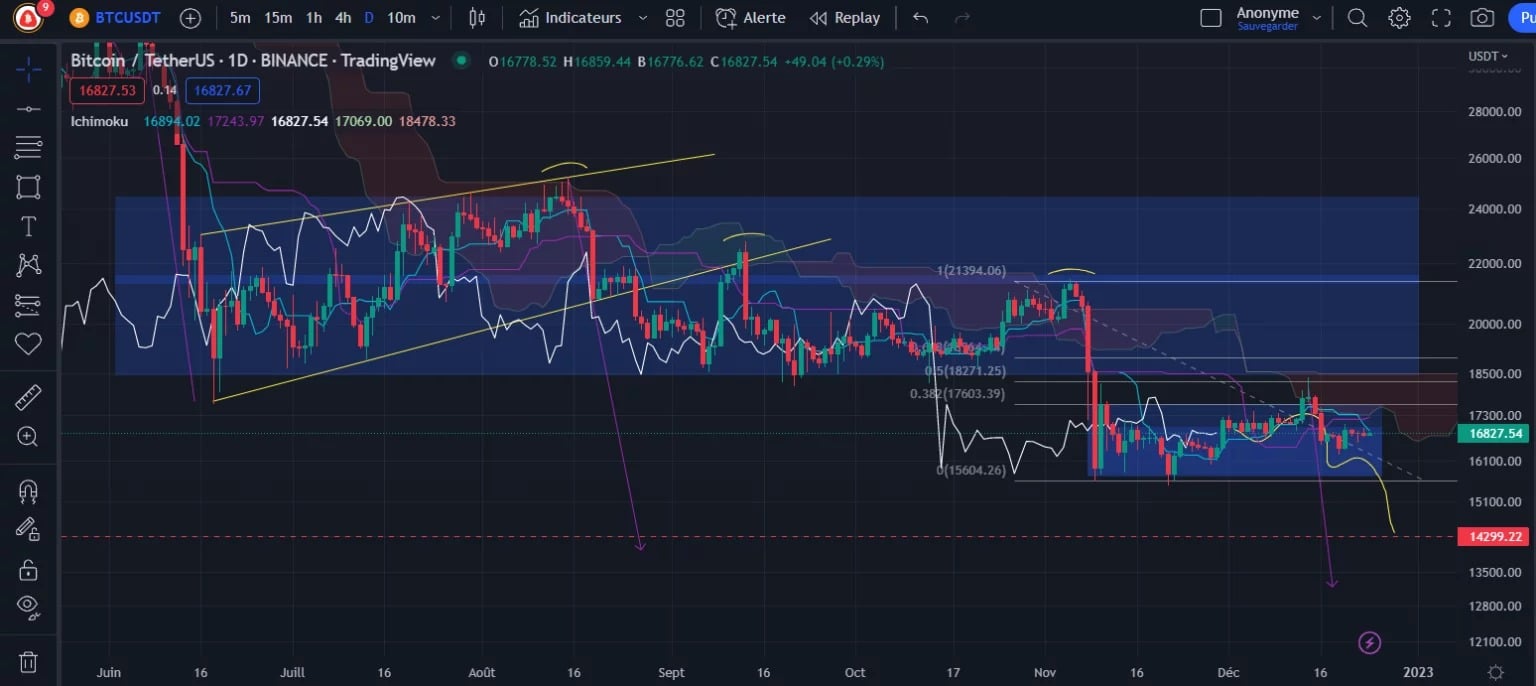
Figure 1 – Bitcoin Daily Price Chart
Until the price manages to re-enter the large blue rectangle that encompasses the previous consolidation (range), the price will remain under threat of a fall towards our initial target at $14,300. This follows the break of the Bear Flag (drawn in yellow on the figure above) and pierced from below last August. It was the subject of a confirmatory pullback (touching up the lower bound) in September.
Moreover, the previous fall which took place at the beginning of November was corrected by 50% (with a rejection precisely on this level which also corresponds to the Kijun-Upper Cloud alignment), which is not a very good sign. Indeed, if the price were to break $15,600, a new Bear Flag would be activated, with a target at $13,500.
To invalidate the bearish scenario we are witnessing, the price would have to break above the cloud at $18,500 and above all, it would have to break back through the high part of the previous range towards $22,000 to give a trend reversal signal with a new high higher than the previous one. But we are still a long way from that and the odds remain on the downside for the time being
Ether (ETH) is on its way to $1000
Since our analysis last week, the price of Ether (ETH) has confirmed the breakout of the triangle we detected on the 4-hour time unit. This yellow chartist pattern is a continuation-type triangle compression that follows a long downtrend. A breakout from the bottom was the most likely outcome, and we can now expect with high probability a return to the bottom of the rectangle at $1,080.
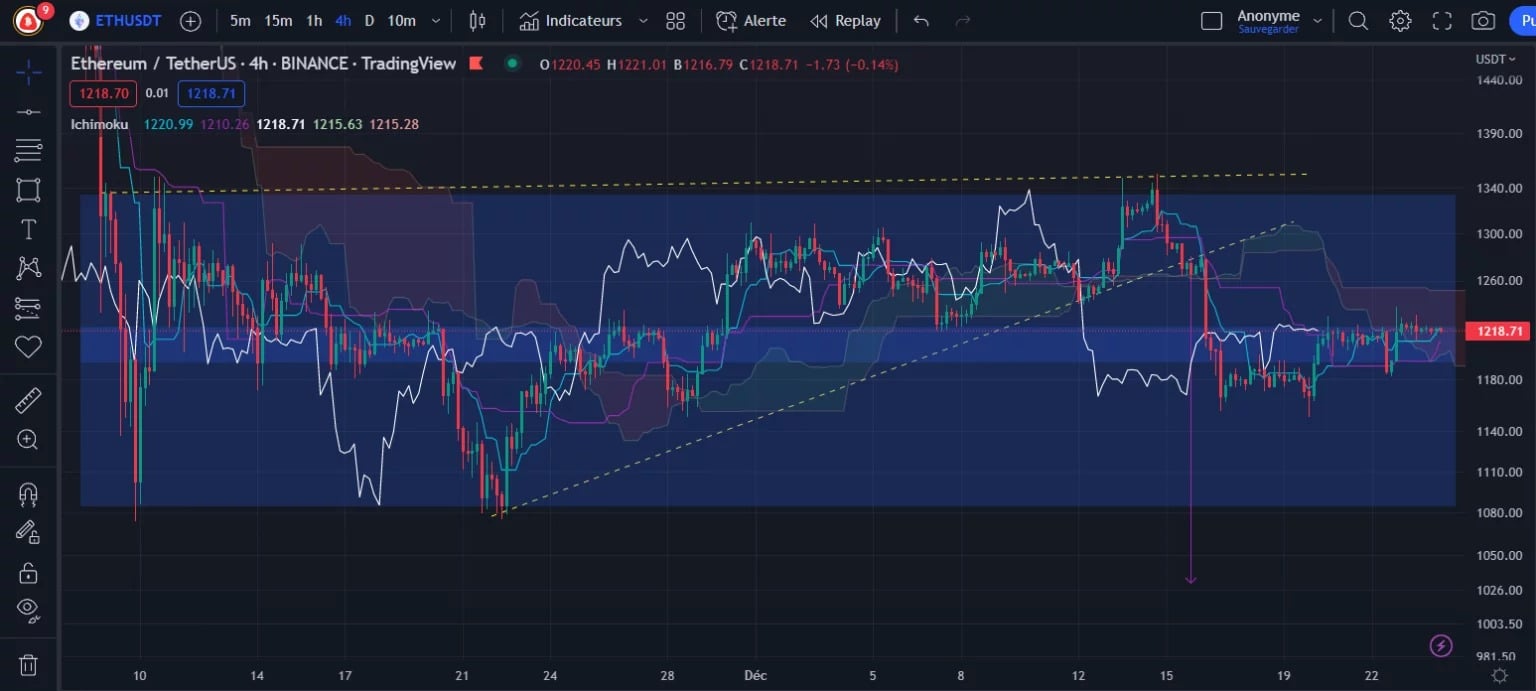
Figure 2 – Ether Price Chart (H4)
The target for this triangle is actually a little lower towards $1,030, which would mean that the range would be breached from below, with new bearish targets to be determined if that happens.
To invalidate the fall that is underway, the price would need to break back above $1,340 to finally break a larger triangle from above, with the help of the cloud becoming an important support again.
Conclusion of this technical analysis
Bitcoin and Ether are still in a clear downtrend and the price continues to move towards the breakout targets triggered in our previous analysis.