 Defies Its Historical Pattern")
Historically, the price of Bitcoin (BTC) tends to rise in October. But the cryptocurrency could break a 10-year streak and end the month on a down note.
Bitcoin’s price defies historical forecasts
In the world of Bitcoin, October has a nickname: “Uptober.” The price of BTC does indeed tend to rise—sometimes sharply—between October 1 and 31. In 2013, it gained 60% over the month, with a 50% increase in October 2017 and a 40% increase in October 2021.
But this month, the Bitcoin price has fallen 5.6% between October 1 and October 24. The largest cryptocurrency could therefore end the month down, for the first time since 2014.
It’s been a month full of twists and turns for the BTC price: it reached an all-time high on October 6, at $126,300… Before plummeting a few days later, crashing to $102,000. Since then, the Bitcoin price has been trading within a range between $103,500 and $113,000:
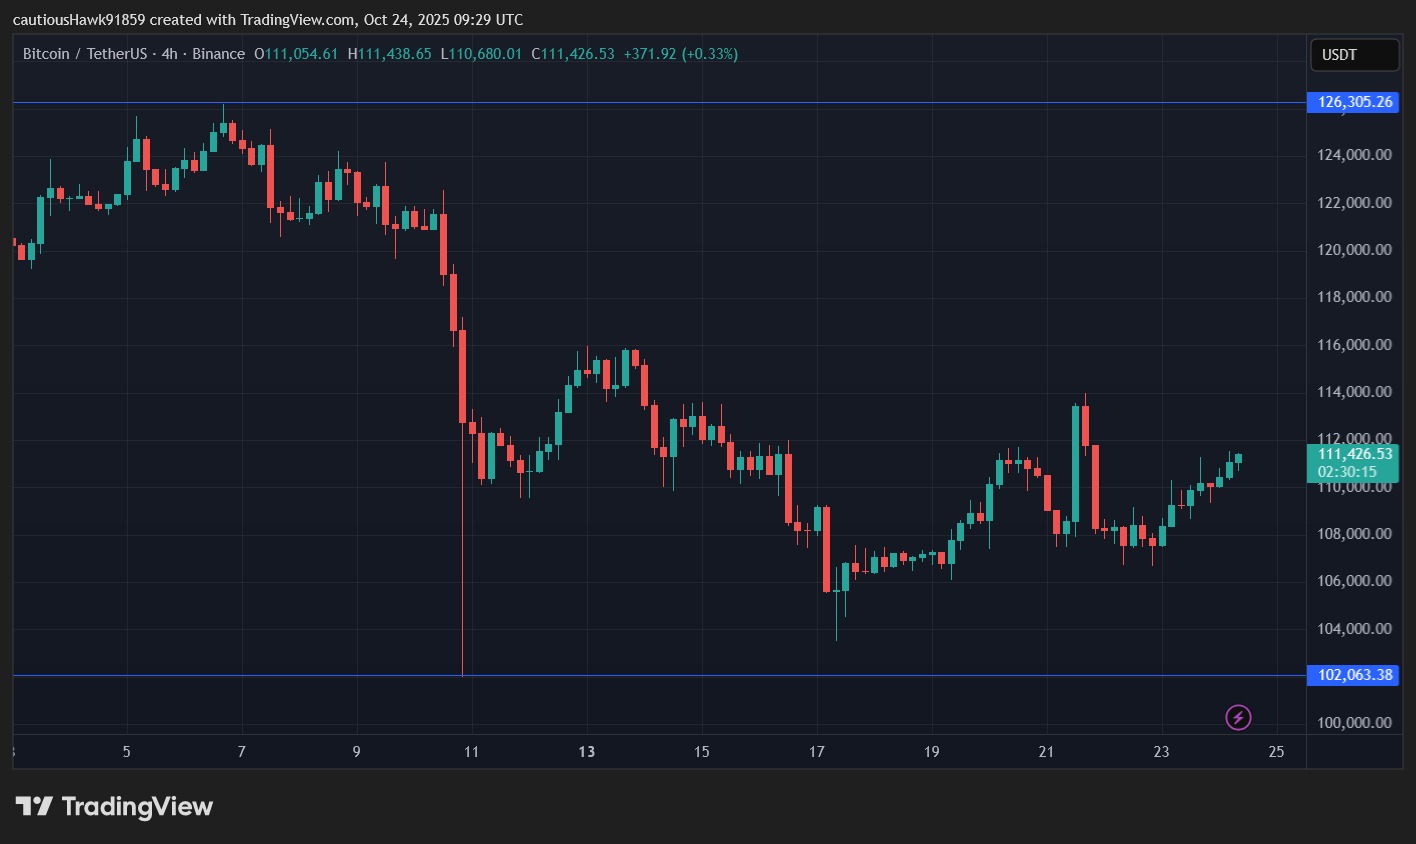
Bitcoin’s Strange October
As for the end of the year, forecasts are mixed. While some analysts agree that the price may eventually fall back below $100,000, the question is whether a rebound will occur between now and December. So, is this a slowdown following the frenzy of recent months, or a lasting trend? The macroeconomic situation will play a key role in determining the outcome.