
During Monday’s trading session, US spot Bitcoin (BTC) ETFs saw net outflows of $363.17 million. We take a closer look at this red day, which is currently the worst of September.
US spot Bitcoin (BTC) ETFs saw red on Monday
As the crypto market began a downward trend at the end of the weekend, we could expect outflows from ETFs. Bitcoin (BTC) ETFs saw $363.17 million in outflows, the worst day since August 19.
However, we can put these figures into perspective, as it was “only” the 13th worst trading day of 2025 and the 20th since the launch of ETFs in January 2024.
In terms of assets under management, US spot BTC ETFs now stand at just over $148 billion, down 6.65% from their all-time high (ATH) of $158.64 billion on August 13.
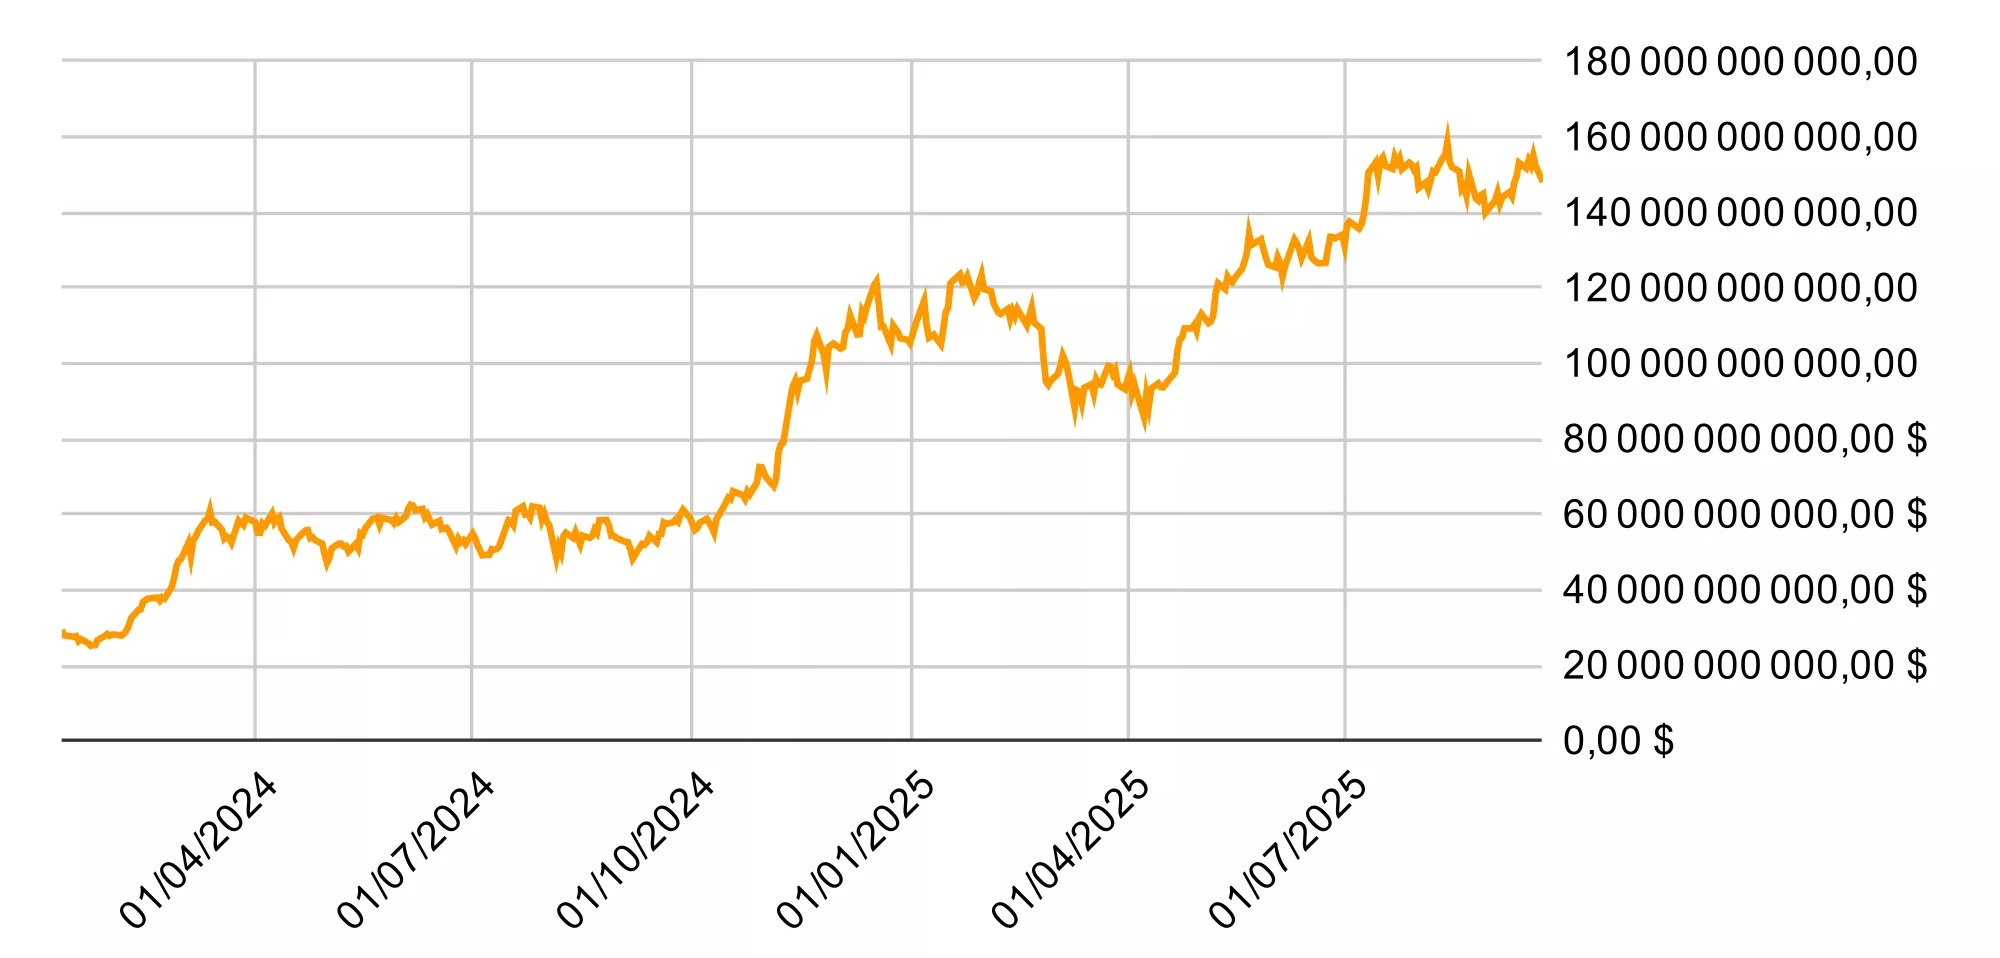
In comparison, the price of a bitcoin fell by 8.17% over the same period, suggesting a slight inflow of liquidity reported in BTC. At the time of writing, the asset is trading at $113,000, stable over the last 24 hours.
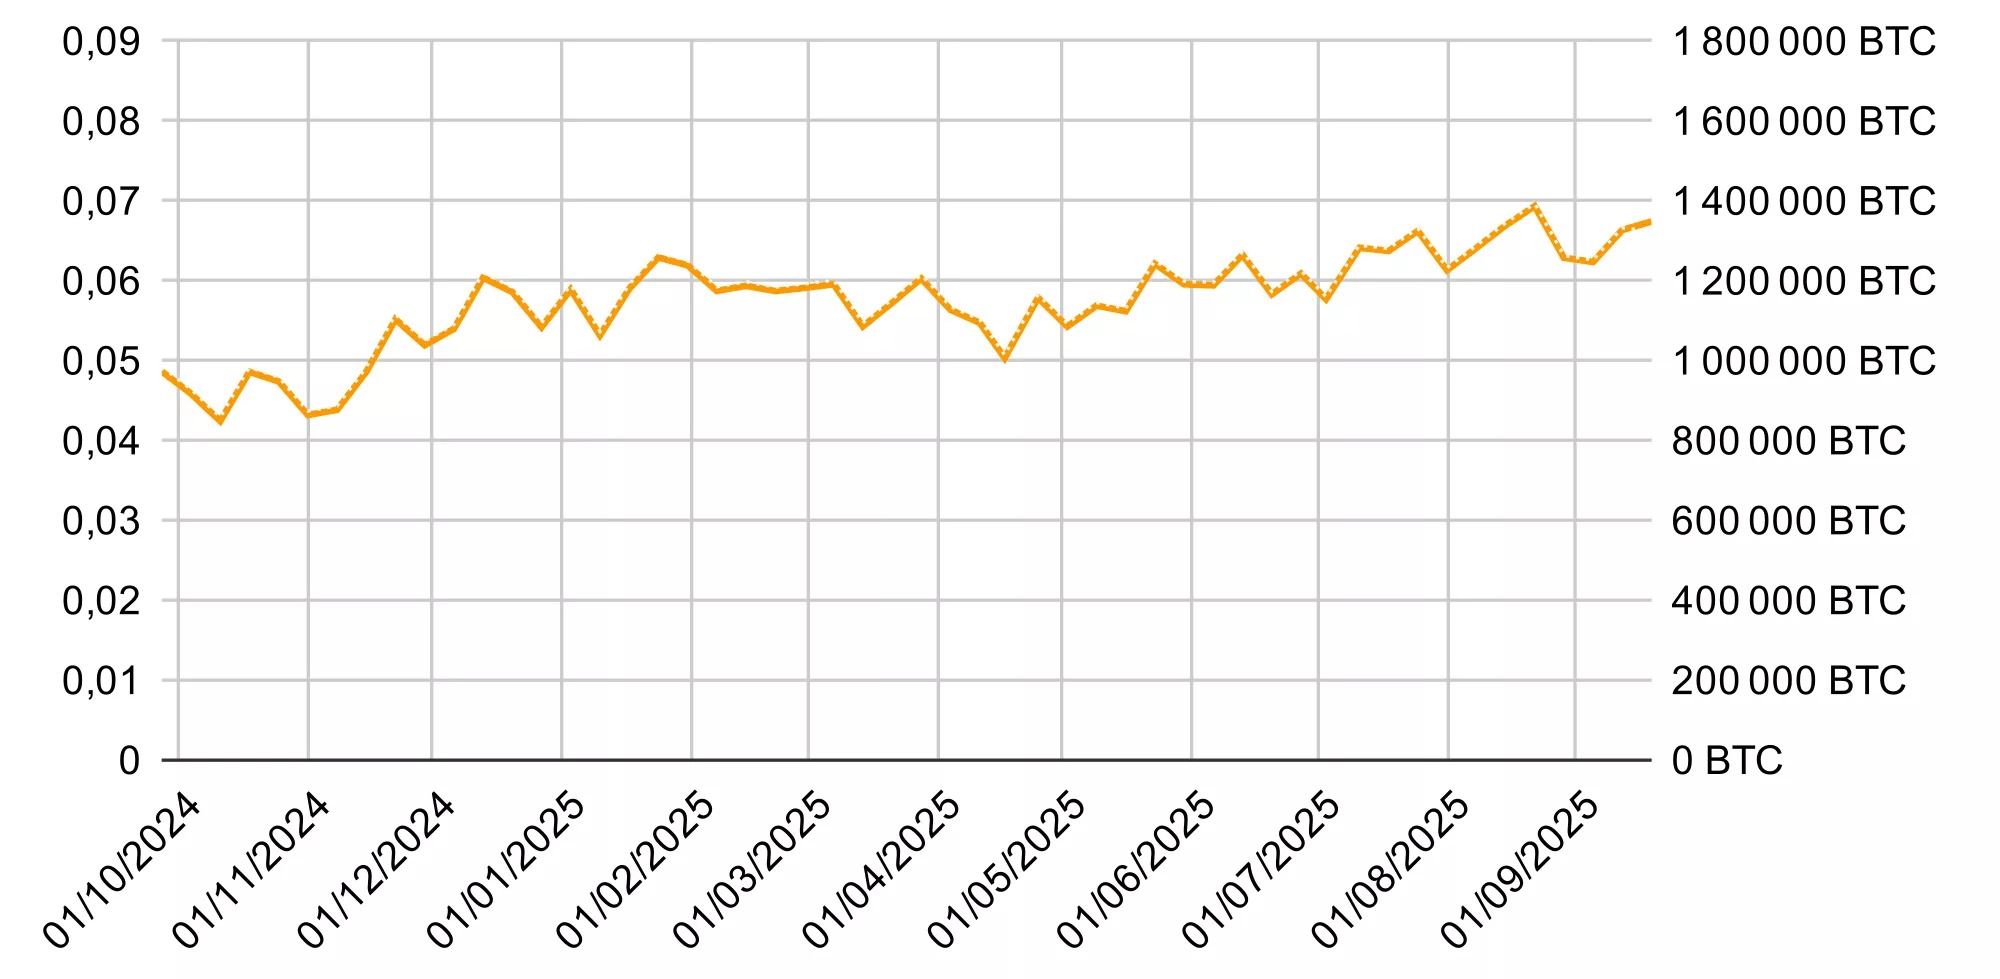
In terms of the equivalence of BTC ETFs, it may be interesting to compare this trend. To do so, we have linked SoSoValue data to CoinMarketCap’s price history.
However, CoinMarketCap data only allows weekly data to be extracted over a 12-month period. In addition, a slight margin of error must be taken into account, given that spot prices are fixed on Sunday evening, while ETF prices are fixed on Friday evening when the stock markets close. Nevertheless, all these factors do not betray the overall trend, and we can see that in the space of a year, US spot Bitcoin ETFs have grown from around 974,400 BTC to 1.35 million BTC, representing an increase of 38.5%, with the percentage of Bitcoin’s total capitalization rising from 4.93% to 6.63%:
To take this further, we can compare this change in the amount of bitcoins managed with that of the value of net assets under management in ETFs. In order to establish a common point of comparison, we have reported these two values on a base of 100.
This shows that the explosion of spot Bitcoin ETFs over the last 12 months has been driven more by the rise in BTC itself than by an influx of new bitcoins into these funds:
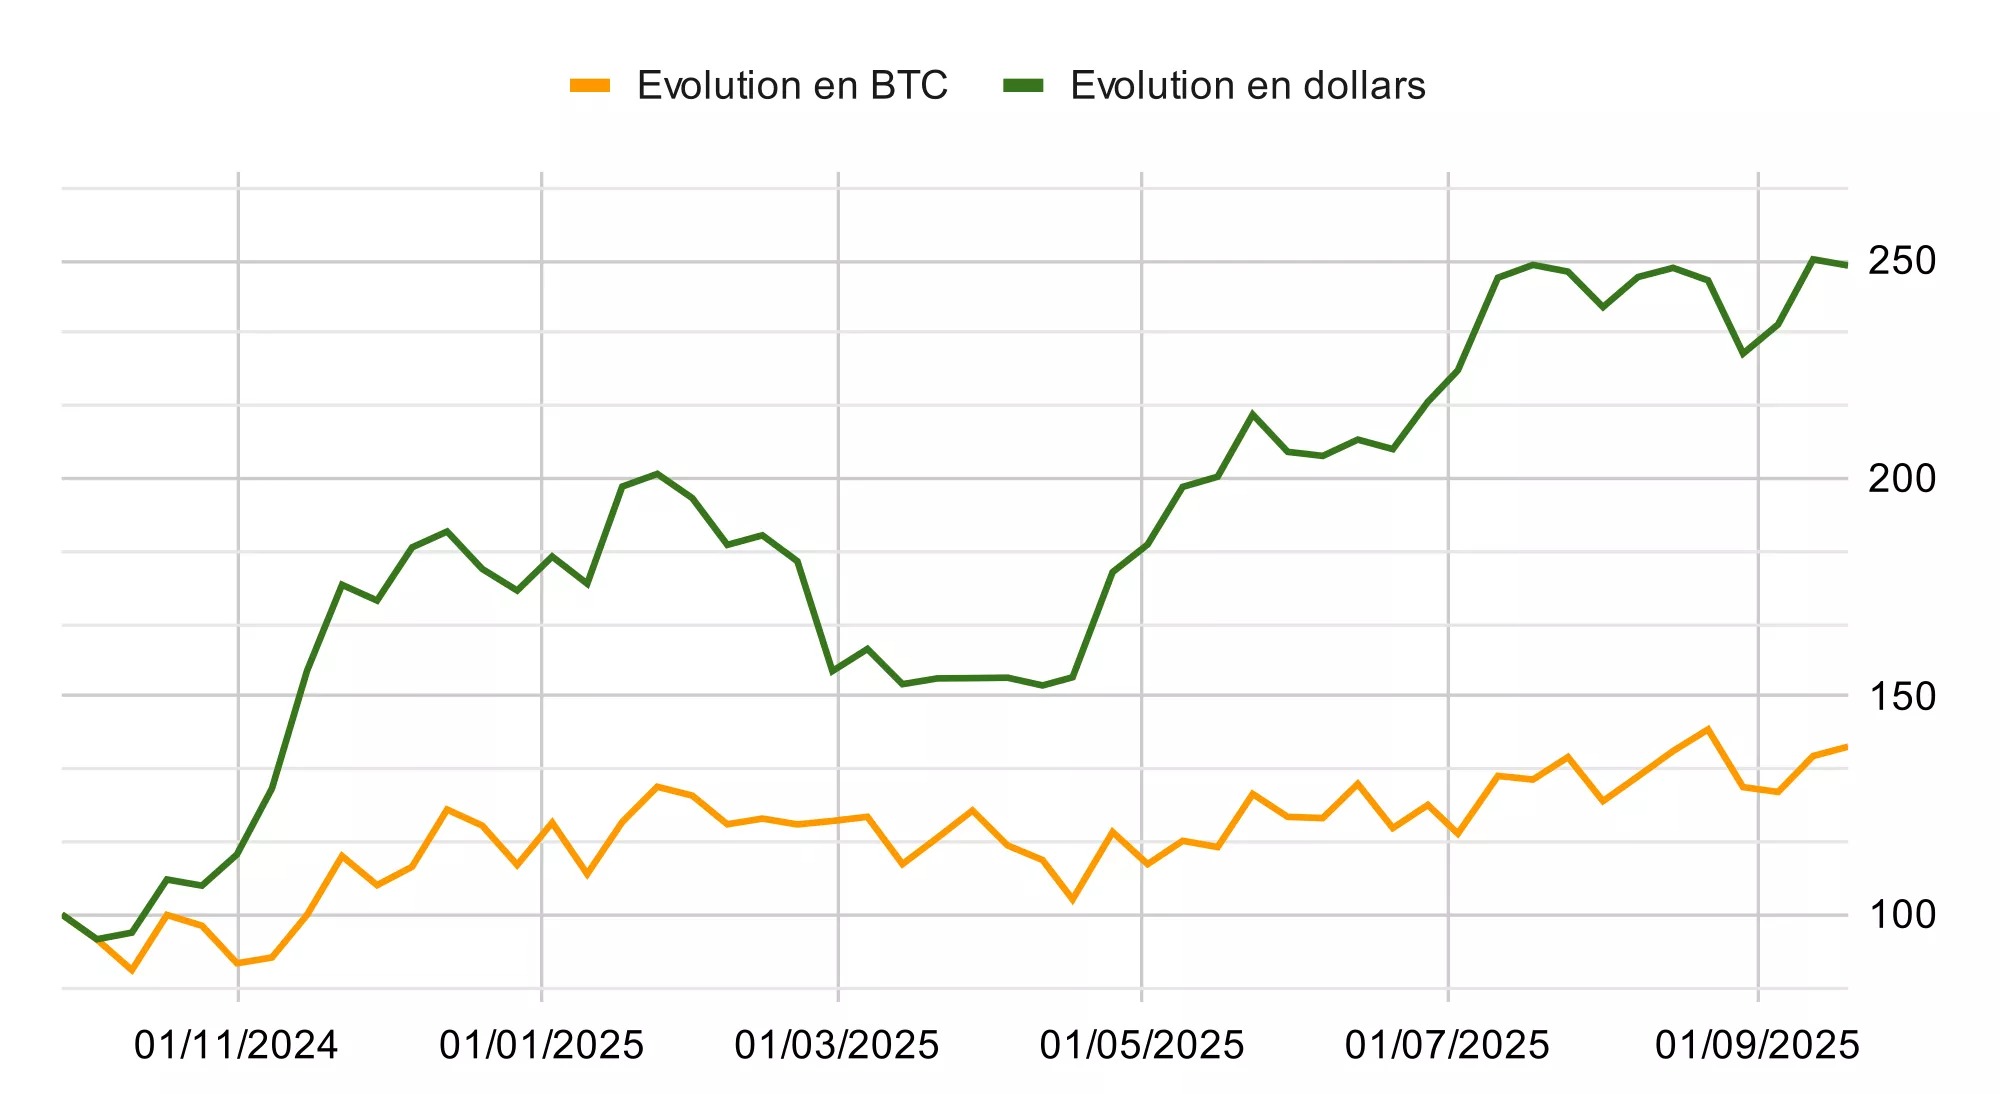
If prices continue to fall over the long term, we will be able to repeat this comparison to see whether, contrary to the current situation, the amount of assets under management by ETFs reported in BTC offers greater resilience than its equivalent in dollars.