
While in a range for several weeks, Bitcoin (BTC) and Ethereum (ETH) are showing still bullish targets. Will the crypto-currencies finally manage to soar above their psychological resistances or has the correction begun? Check out the different scenarios in this week’s analysis.
Bitcoin (BTC) is losing momentum
Still in an uptrend above the Kijun and the Ichimoku indicator cloud on a daily basis, the price of bitcoin (BTC) has failed to break through its psychological resistance of the $30,000 level. For almost a month now, BTC has been stable and has been trading in a range between $26,800 and $28,800. So will it manage to break through its resistance in the next few days or will it first offer us new buying opportunities during a correction?
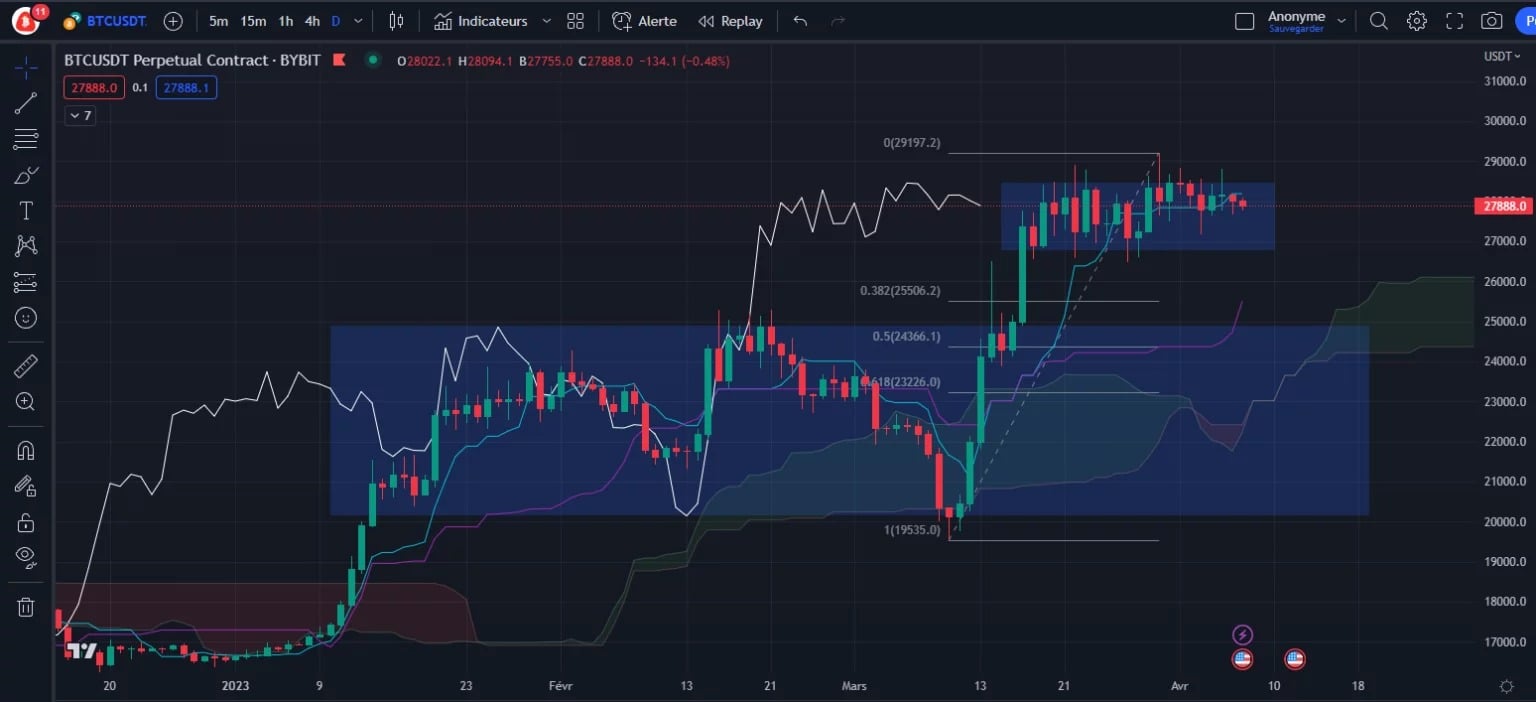
Figure 1 – Bitcoin Daily Price Chart
As of today, the price is showing a slowing trend after the strong rise of the previous weeks. With the Kijun away from the Tenkan and prices, this means that the market is currently in an overbought situation. The ongoing sideways movement is therefore a good thing as it allows for the accumulation of new liquidity to potentially move higher later on, but more importantly, it allows the Kijun to gradually move back up towards prices. This curve acts as a support and as long as it remains below price, we can say that the trend remains clearly bullish.
All that is needed in the next few days is for the price to finally break through its resistance at $28,800 and finally cross the psychological $30,000 level. If it fails, a Fibonacci retracement allows us to identify the various potential rebound levels to watch. There is the $25,500 (0.382) which represents a psychological support, the $24,366 (0.5) which would correspond to a 50% correction of the rise of the last few weeks, and then the famous 0.618 to $23,226 which is the healthiest correction level.
One thing is for sure, we will have to stay above the big blue rectangle as much as possible, as this is the previous price consolidation. Returning to it is never a good sign because we have much more liquidity than before, and a break below it is therefore ultimately likely. So we must avoid going back below $25,000 to avoid any risk of disillusionment.
$30,000 soon
We have been waiting for several weeks for the price to return above $30,000 following the breakout of a right-angled downtrend pattern at h4. In general, this type of chartist pattern offers good upside probabilities and as we can see, already 50% of the bullish movement has been achieved. The theoretical target for this pattern is at $30,620 and will remain valid until the price breaks back below $25,000.
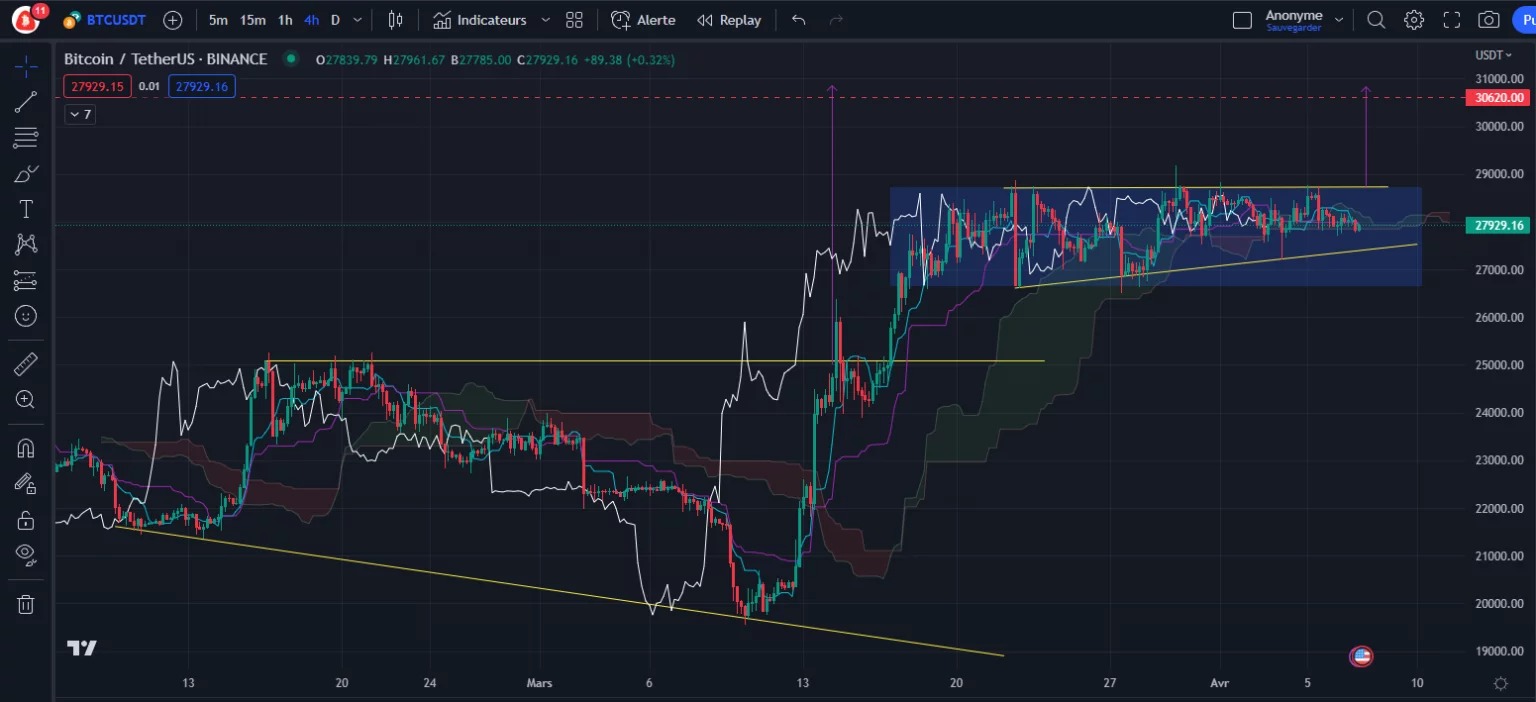
Figure 2 – Bitcoin Price Chart (h4)
Within the current uptrend, we can see the construction of a small ascending triangle in which the price has been moving since March 20. If the resistance level at $28,800 is broken, then the target of this pattern is also at $30,600. This is a double target for Bitcoin if it breaks out of this range.
If the price were to break through this consolidation from below, then a return to the $25,000 level would be preferred (0.382 of the Daily retracement), with the risk of invalidating our bullish target.
Ether (ETH) on its way to $2,000
Concerning the price of the Ethereum cryptocurrency, Ether (ETH), this week it broke a rising triangle from above on the h4 time unit. This breakout triggered a bullish target at around $2,024, which is the height at the entry of the triangle, carried over to its breakout.
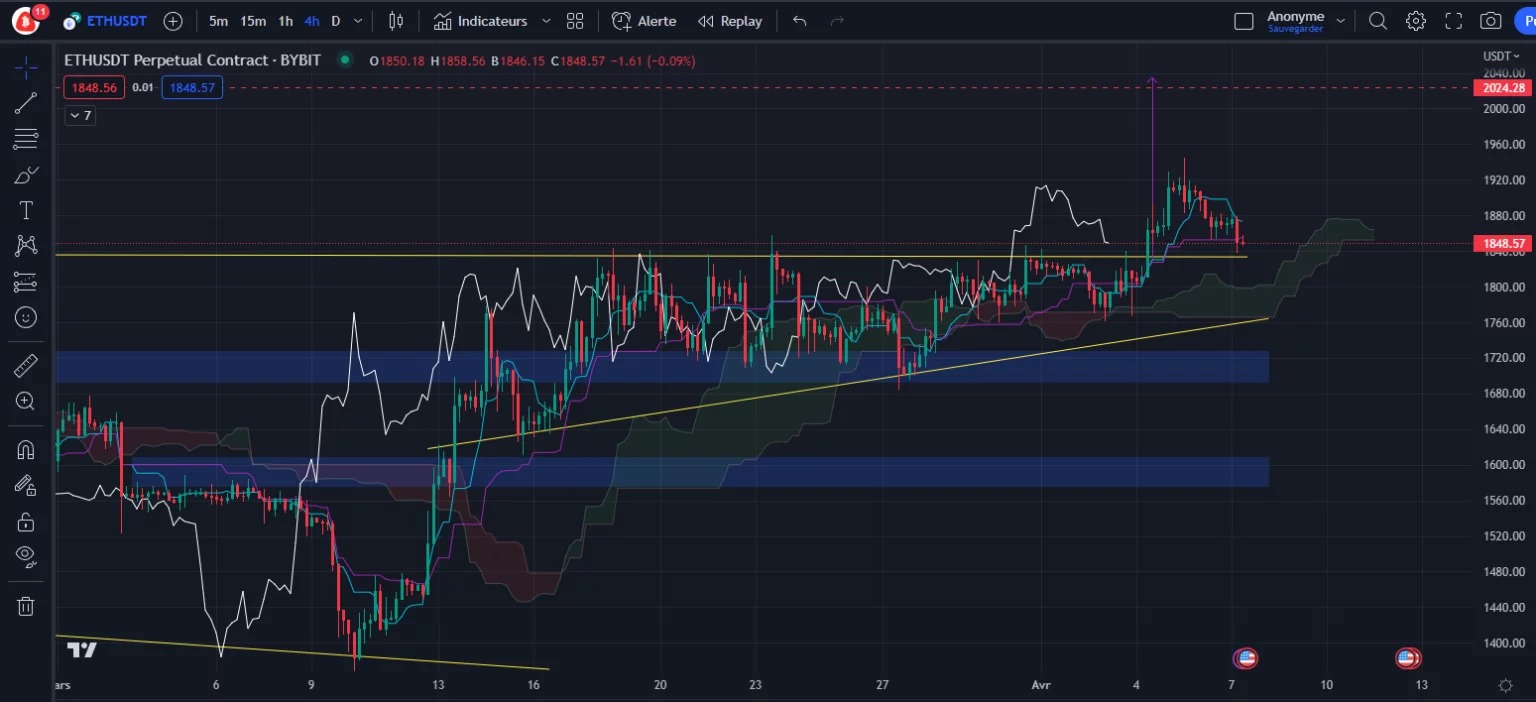
Figure 3 – Ether Price Chart (h4)
While the price had reached 50% of its target, however, the crypto-currencies started a correction, with here a perfect pullback of ETH on the previous resistance which has now become a theoretical support. So it will take a rebound here to keep the triggered target. For now, the trend remains bullish as long as the price does not break back below the cloud.
If the price does break back below the cloud it will then break the Kijun downwards, which is a sell signal not to be ignored. There would then be risks for the price to go back to test its next support at $1,700, or even the next one at $1,600.
Conclusion of this technical analysis
Cryptocurrencies are holding their bullish targets. However, prices have entered a consolidation phase and thus the trends have lost momentum. It will take a new bullish impulse to avoid losing important supports and the beginning of a correction.