Let’s not get ahead of ourselves. The “altcoin season” hasn’t started yet, and it could still be a while.
There are many indicators that could signal the start, but one stands out above the rest: Bitcoin dominance.
Bitcoin dominance, often referred to as “BTC dominance,” is an indicator that measures the share of the total cryptocurrency market capitalization represented by Bitcoin. Specifically, it is calculated by dividing the total value of Bitcoin by the cumulative value of all cryptocurrencies, then multiplying the result by 100 to obtain a percentage. Currently, BTC represents 64.57% of the total market capitalization of the crypto market. Historically, Bitcoin has always occupied a dominant position, as it was the first cryptocurrency and remains by far the most recognized by institutional investors through the demand for US spot Bitcoin ETFs. However, as the crypto ecosystem has diversified with the emergence of countless altcoins, BTC’s dominance has become an essential barometer for anticipating capital rotations from BTC to altcoins.
Indeed, a signal of a decline in Bitcoin’s dominance indicates that investors are partially turning away from Bitcoin to place their liquidity in altcoins.
This dynamic is generally interpreted as the potential start of an “altseason,” a phase during which many altcoins experience spectacular rises. Monitoring the evolution of BTC dominance therefore makes it possible to identify when the market becomes more favorable to altcoins, and technical analysis provides a lot of information on this subject.
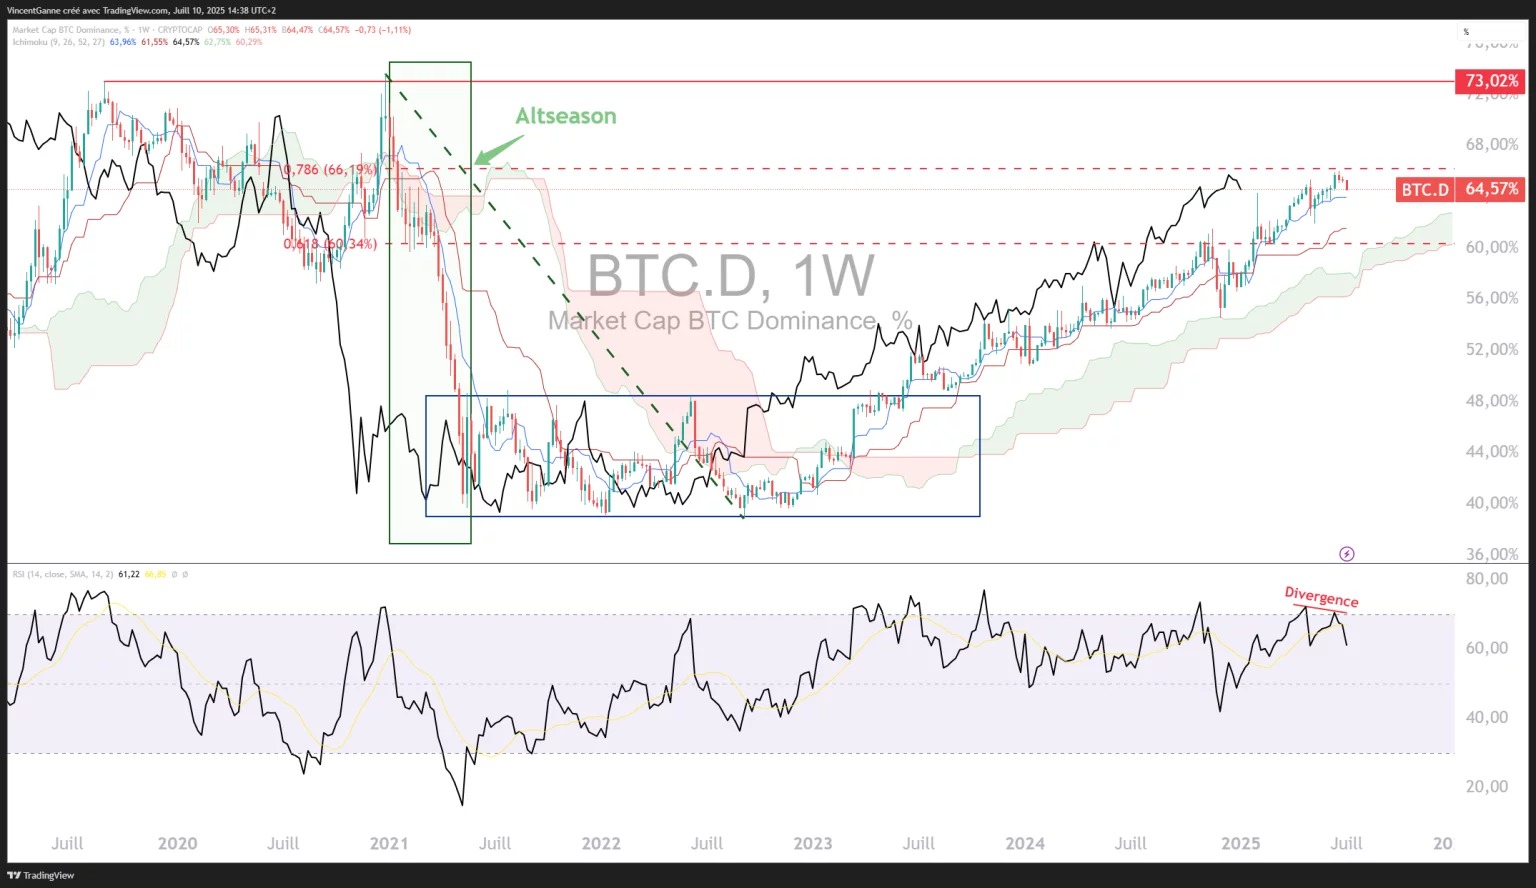
I see a potential bearish divergence in BTC dominance
The two charts below highlight technical pre-signals that are bearish for BTC dominance. Please note that these bearish signals have not yet been confirmed, so it is important not to jump to conclusions.
Here’s what to watch out for:
- A potential bearish momentum divergence on BTC dominance in daily data. The 63% dominance level would need to be broken to validate this and signal a drop towards 58%, arguing for a mini altcoin season.
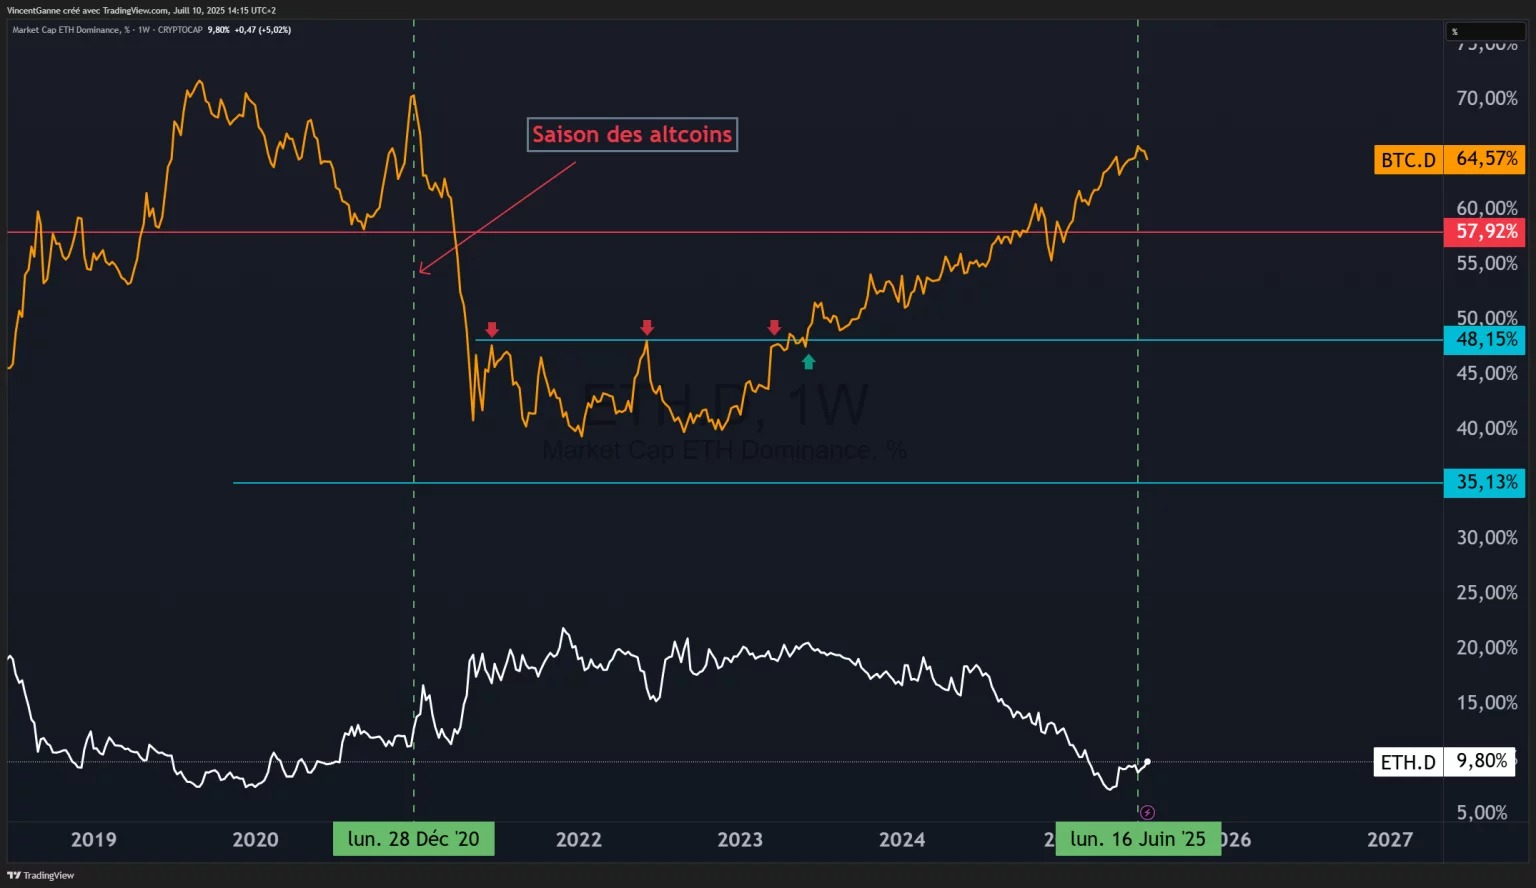
- The second chart compares the dominance of Ether (in white) and Bitcoin (in orange). The former is rebounding from a major historical support level, while the latter appears to be showing the beginnings of a bearish divergence in a fairly high historical zone.
These two pre-signals are still to be confirmed, but if they are confirmed, then we would have the starting point for a small altcoin season, perhaps similar to last November.