
For several weeks now, cryptocurrencies have been losing momentum and have entered a range phase. Will Bitcoin (BTC) and Ether (ETH) finally correct their psychological resistance? Find out in this week’s analysis
Bitcoin (BTC) still hasn’t broken through $30,000
Despite numerous attempts in April, the price of bitcoin (BTC) remains blocked for the time being by its daily Kijun around $29,100, as well as by its psychological resistance at $30,000.
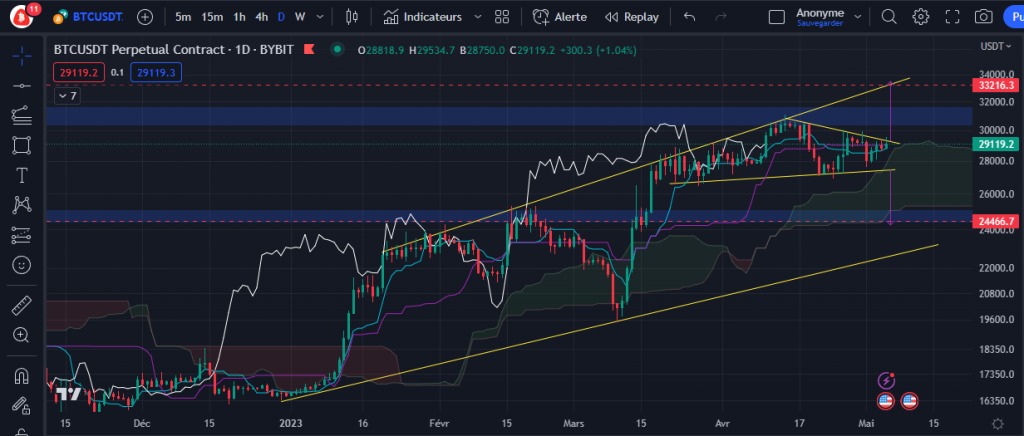
Figure 1 – Bitcoin Daily Price Chart
As long as the $30,000 area holds up prices, a return to around $25,300 (Tenkan Weekly) seems to be the preferred option, as we explained in our previous analysis. This would correspond to a retest of the same level which acted as resistance at the start of the year and which should now be confirmed as support.
If it breaks above $30,000, the way will be clear, with a chance of climbing to around $33,200, the next resistance level corresponding to the upper part of the ascending broadening in yellow.
Breaking back below $25,000 would be a risk of breaking the widening at the bottom, which could cause the price to fall much further below $18,000.
Compression coming to an end
If we look at the h4 time unit, BTC shows a well-defined range between $31,000 and $26,800. The price is moving without a clear trend as it waits to make its next move.
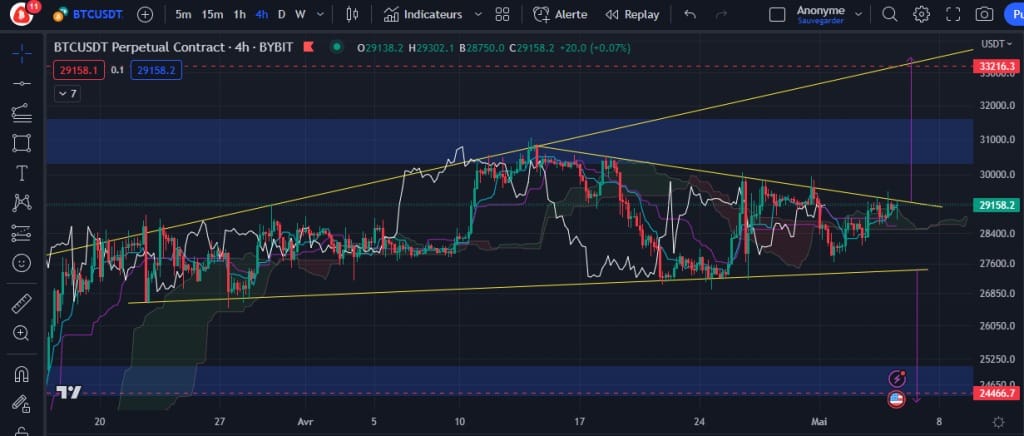
Figure 2 – Bitcoin price chart (h4)
Within this lateralisation contained in a large ascending broadening (a pattern that usually breaks at the bottom), the price is also moving in a triangle whose compression seems to be coming to an end. The price is becoming less and less volatile, which suggests that a strong move is in the offing.
While this type of pattern may suggest an imminent downside breakout due to its bearish probabilities, we will wait to see which way the price breaks this pattern. Of course, the Chikou Span (in white) will have to confirm the break to increase the chances of relevance.
Ether (ETH) about to correct?
For its part, the price of Ethereum’s cryptocurrency, Ether (ETH), is also still moving within an upward broadening. As with BTC, the breakout is more likely to be bearish
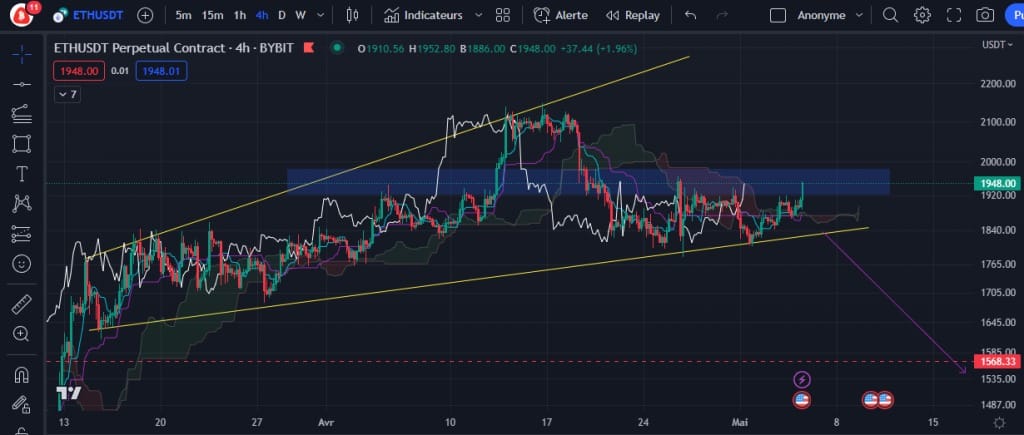
Figure 3 – Ether price chart (h4)
Although the price has managed to break back above all the Ichimoku obstacles, the $2,000 zone is a real psychological resistance and represents a risk of imminent correction in the event of a new rejection. With a pattern that tends to break from below, a correction to $1,568 would be beneficial to allow the market to breathe and gain liquidity.
If the ETH breaks above resistance at $2,000, then the next resistance to look for is at $2,120.
Conclusion of this technical analysis
Cryptocurrencies remain stuck in a range and still need to break their psychological resistances to finally take off. In the meantime, the market has lost speed and the risk of a correction is very real.
? Access our premium group with Vincent Ganne and our fundamental and on-chain analysis experts. They will provide you with exclusive information and analysis on the crypto market on a daily basis to optimise your knowledge.