
This week, Bitcoin (BTC) and Ether (ETH) prices look set to seek new bullish targets. Will the crypto-currencies manage to break the next major resistances along the way? Here’s the latest in this new analysis.
Bitcoin (BTC) still under resistance
As we explained in last week’s analysis, the price of Bitcoin (BTC) has recently reached its target of $21,500 which is now an important resistance. The latter corresponds both to the middle of the previous 6-month range (price lateralization without volatility) that has been reinstated, but more importantly it corresponds to an area that has rejected the price 5 times before. So will the price manage to break out this time, or will it end up being rejected again to go lower?
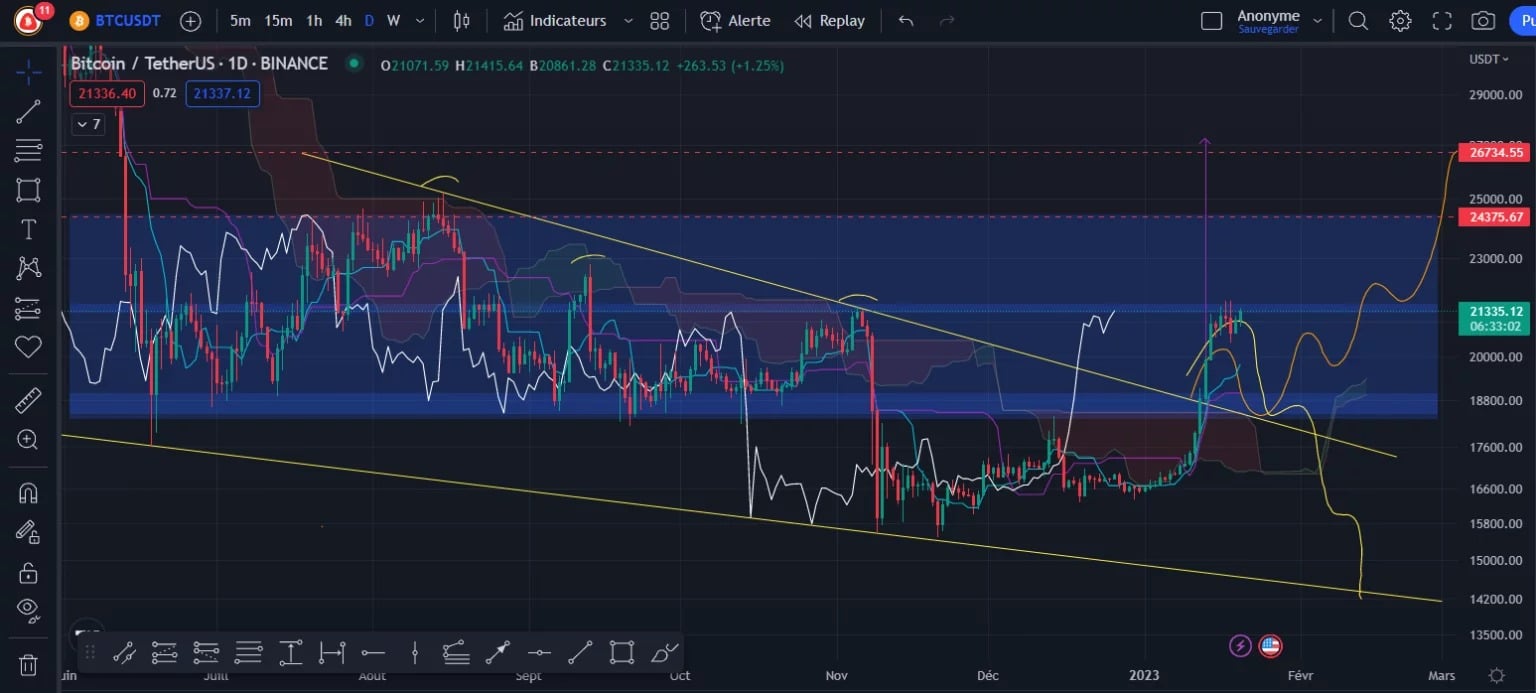
Figure 1 – Bitcoin Daily Price Chart
By re-entering the long range that lasted from June 2022 to November 2022, the price of BTC is signaling a potential reversal. Indeed, when the price re-enters an old range, there is a strong chance that the lower part of the range will become a support, which gives a greater chance to test the upper part. And since new liquidity has been recovered on the way with many short squeezes, then a breakout of the range from above could also follow.
But before that can happen, Bitcoin will need to break its mid-range resistance and then aim for the top of the range. Technically, BTC has triggered a bullish target at $26,730 following the break of a descending wedge from above, but it is best to remain vigilant until the $21,500 and the range are broken from above.
If the rejection at $21,500 is confirmed, then there is a strong possibility of a retest of the Tenkan Daily at $19,500. Indeed, this is a long way from the price, which is not usually the case. Still, the bottom of the range will have to be held as support, otherwise there will be a strong risk of going back to a new low around $14,300.
Ether (ETH) on its way to $1,650
The price of Ether (ETH) has also broken through a compression triangle from above. Thus, a new bullish target was triggered at $2,650 (height of the pattern reported at the breakout point).
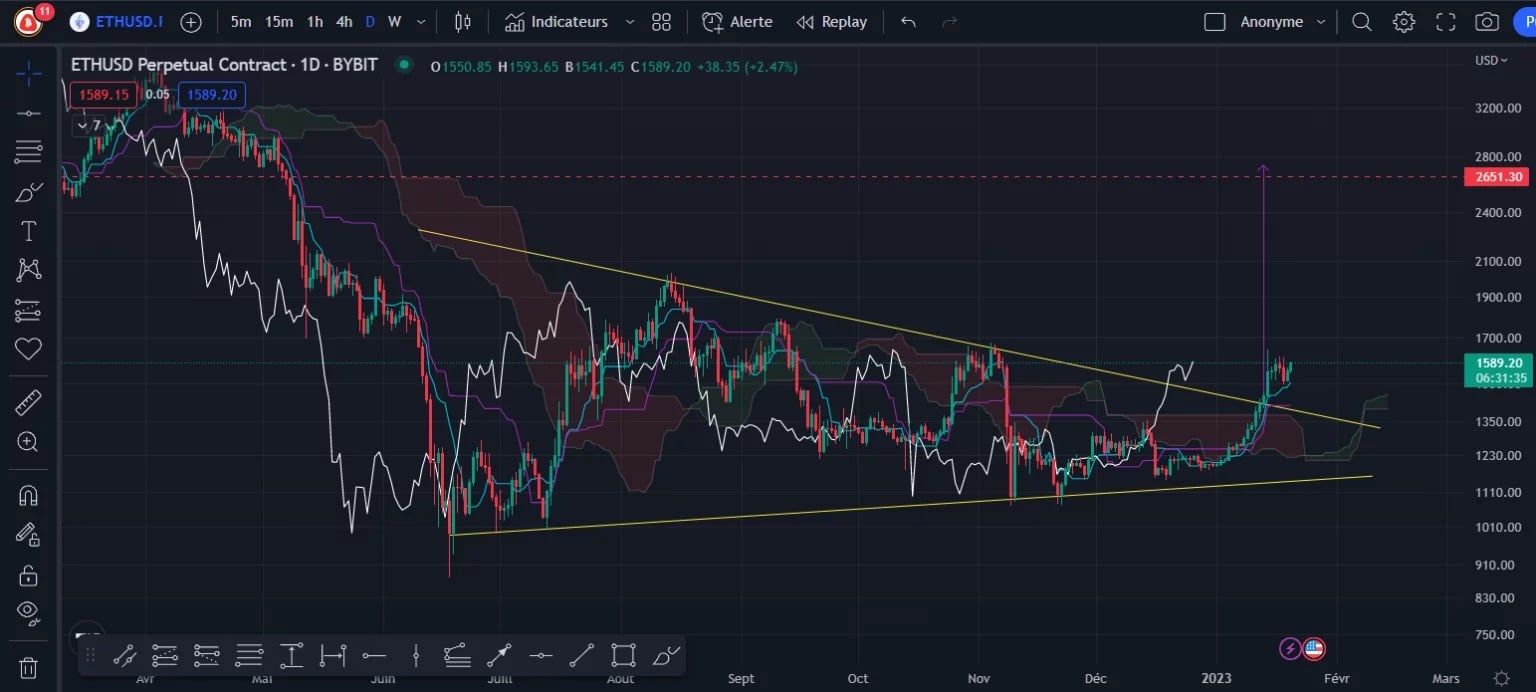
Figure 2 – Ether price chart (H4)
We can therefore target this bullish objective as long as the price remains above $1,400. Below, there will be a risk of invalidating this pattern and going back down to test the $1,000 support again.
Here again, we will have to take it step by step as the underlying trend is still bearish. We can also see that the $1700 area has been very difficult to break in the past as the price has been systematically rejected on this level.
Conclusion of this technical analysis
Bitcoin and Ether will need to break resistance in the coming days to go after their new short-term bullish targets. These scenarios should be favoured as long as the price does not break back below the supports identified earlier in this article