
Despite a sharp drop on January 30, gold and silver prices have crossed symbolic thresholds, with a meteoric rise over the past few months and record trading volumes. Beyond the monetary narrative, the current dynamic resembles a flow-driven market, set against a backdrop of the absorption of global excess savings. A powerful but unstable driver. Is this rise in precious metal prices coming to an end?
Gold is gaining momentum, silver even more so
Gold and silver have been on a meteoric rise for several months. The upward trend that began in recent years has accelerated significantly, to the point where the price of an ounce of gold has surpassed the $5,000 mark and the price of an ounce of silver has surpassed the $100 mark.
After rising more than 60% in 2025, the price of gold has already gained more than 15% year-to-date as of January 30. Silver, which had soared by more than 140% in 2025, has risen by about 40% since January 1.
This acceleration is also evident in the pace of price increases. It took gold nearly 1,700 days to rise from $2,000 to $3,000. It took only 207 days to reach $4,000, and then just 111 days to cross the $5,000 threshold.
This compression of the time needed to gain each $1,000 increment illustrates a shift in trend that goes beyond the simple debate over the metal’s intrinsic value.
On a linear chart, the rise in these metals naturally appears parabolic. The most useful information is found on the logarithmic chart, where the slope has also steepened markedly over the past several months, particularly for silver.

The relative spreads between gold and silver and their respective five-year moving averages have surpassed the 2011 peak but remain below the 1980 peak (Source: TradingView)
Historically, this type of pattern—characterized by both a sharp acceleration and an unusually large deviation from the long-term average (5 years on the chart)—is typical of periods of intense speculation, even when the underlying fundamentals are very real, as was the case with cocoa in 2023 or with gold and silver in the early 2010s.
A market driven by speculative flows fueled by an appealing narrative
It is tempting to explain the surge by a loss of confidence in U.S. assets, questions about the dollar’s status, or the perceived erosion of the Federal Reserve’s (Fed) independence. These factors exist and form a coherent narrative, but they do not, on their own, explain the extreme volatility observed in recent months.
Market data support a “flow” interpretation rather than a “fundamentals” one. The year 2025 was marked by record inflows into gold exchange-traded funds (ETFs). More recently, the CME Group announced an all-time high of 3,338,528 contracts traded on its metals complex on January 26.
The mechanism is simple: the more a market displays strong momentum and crosses symbolic thresholds, the more it attracts inflows, which further reinforces that momentum. The cycle is self-perpetuating and can last longer than expected, until the narrative underpinning it begins to fray—often even before the fundamentals change.
Gold and Silver as a “Reservoir” for Excess Savings
In addition to the speculative dimension, there is a more structural factor that is often underestimated: the absorption of global excess savings.
For many years, “beggar-thy-neighbor” policies have kept the dollar artificially strong by attracting capital inflows, preventing exchange rates from fully playing their role in adjusting trade imbalances. In this context, a sustainably strong dollar has become the norm, despite persistent U.S. trade deficits.
If these deficits are no longer automatically offset by inflows into dollar-denominated assets, then exchange rate adjustment once again becomes the dominant mechanism, which automatically puts downward pressure on the dollar.
In a world still dominated by mercantilist growth models, excess savings must be recycled. However, there is no reserve alternative deep enough to absorb this excess on a sustainable basis. At the same time, the U.S. administration is showing decreasing tolerance for the absorption of this savings without compensation. As a result, part of this excess savings could be redirected toward gold and silver, which are emerging as neutral reserve assets by default.
What Could Break the Upward Momentum
There is a solid fundamental foundation. But as prices rise, economic actors adapt.
The Financial Times recently noted that, with prices around $112 per ounce, silver now accounts for up to 26% of the total cost of a photovoltaic module. Faced with this increase, manufacturers are accelerating “thrifting” and substitution strategies, particularly through copper contact technologies. Industrial demand is therefore becoming more elastic.
In a flow-driven market, the end of the uptrend can also stem from a simple shift in perception. A geopolitical detente—such as a trade agreement between Donald Trump and Xi Jinping or a diplomatic breakthrough in Ukraine—could be enough to undermine the prevailing narrative. Similarly, a monetary policy shock—or simply a reassessment of the Federal Reserve’s trajectory—could trigger a coordinated wave of profit-taking.
In this context, the White House’s announcement on Friday, January 30, of Kevin Warsh’s nomination to chair the Fed may have undermined the narrative of an overly accommodative Fed. Warsh may have recently won over the U.S. president with partisan and accommodative remarks, but his track record places him more firmly in the camp of those favoring a restrictive policy, with heightened vigilance regarding inflation risks.
During the 2008 crisis, while serving as a governor, he was reluctant to extend monetary easing after the collapse of Bear Stearns, and he continued to emphasize inflationary risks in the fall following the collapse of Lehman Brothers—even as the economy shifted into a disinflationary environment. This contrast between a recent tone deemed accommodative and a past record of restrictive policy could be enough to destabilize a market already heavily positioned, thereby weakening the marginal driver of the movement.
Finally, technical factors matter. Stabilization—or even net outflows—in gold ETFs could undermine the confidence of recent buyers. Record levels of activity combined with high volatility also increase the risk of deleveraging episodes—that is, forced reductions in exposure.
In this context, an increase in margin requirements decided by the CME clearinghouse on gold and silver futures contracts—a common practice during periods of market stress—could act as a catalyst for normalization.
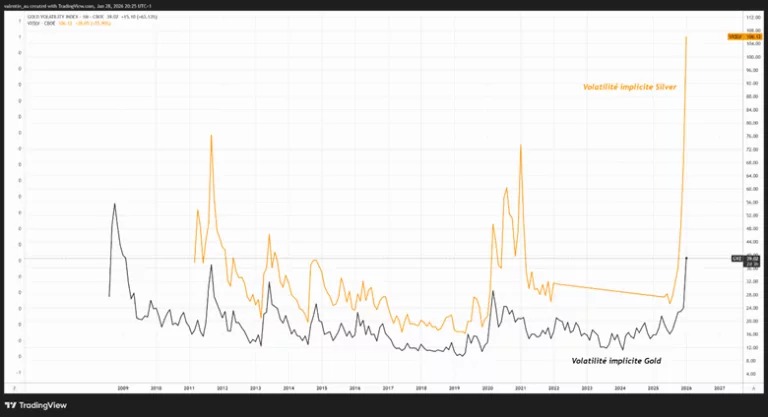
Implied volatility of gold and silver (Source: TradingView)
Conclusion
The bullish case for gold and silver is not based solely on geopolitics or monetary mistrust. It stems primarily from a combination of self-perpetuating speculation and the redeployment of global excess savings into “neutral” reserve assets. As long as the flows remain buying-oriented, the momentum can continue.
The breaking point will likely come from a single factor: a shift in ETF flows, a reversal in the dollar and real interest rates, a tightening of margins on derivatives, or a political or monetary shock that undermines the narrative. If these signals emerge, the normalization could be rapid, just as the rally was.