
After a rejection of Bitcoin (BTC) at $32,000, cryptocurrencies are heading back down. BTC and Ether (ETH) set to break out of chartist patterns: what targets to consider
BTC tries to preserve $30,000
After retesting $32,000, the price of Bitcoin (BTC) has unfortunately been rejected at the top of its h4 range, falling back below its resistance at $30,600. A level that will have to be crossed again in the next few days to hope for a new upward movement.
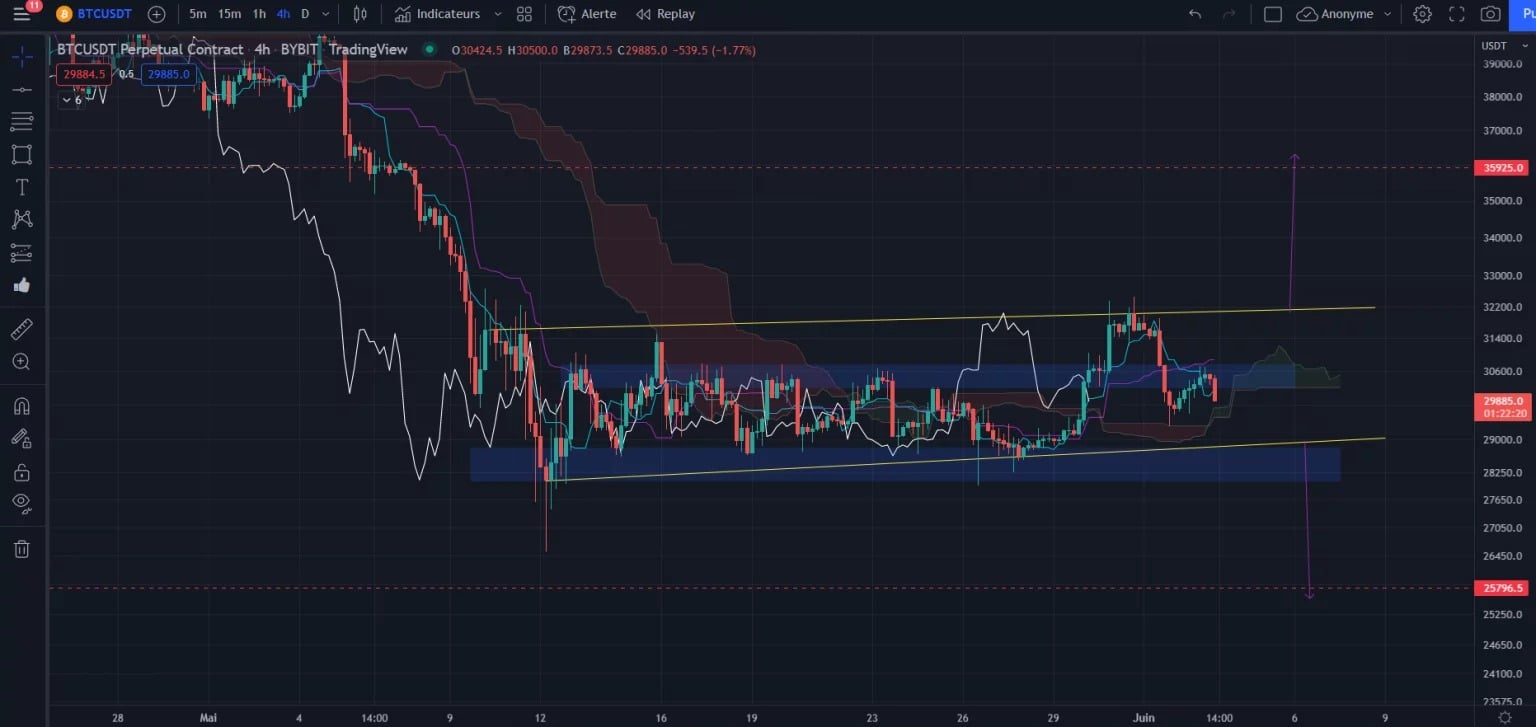
Figure 1: Bitcoin h4 price chart
While it has been moving horizontally for almost 3 weeks, Bitcoin is currently working in a neutral zone around $30,000. As the price is in a range, we expect a directional move in the next few days in order to determine a precise target.
In case of a break of the yellow range from below, the cloud, the Kijun and the Tenkan of the Ichimoku would act as resistance and thus cause a break of the support at $28,000 towards a bearish target at around $25,796 (height of the range carried over to its breakout point).
For the bullish scenario this time, we will have to wait for the price to go back above $32,200 at the close to have a clear break of this range towards $35,925 or so.
Ether (ETH) is still under resistance
For its part, the price of Ether (ETH) remains in a bearish dynamic with highs and lows that keep getting lower and lower. What are the scenarios to be observed in the coming days
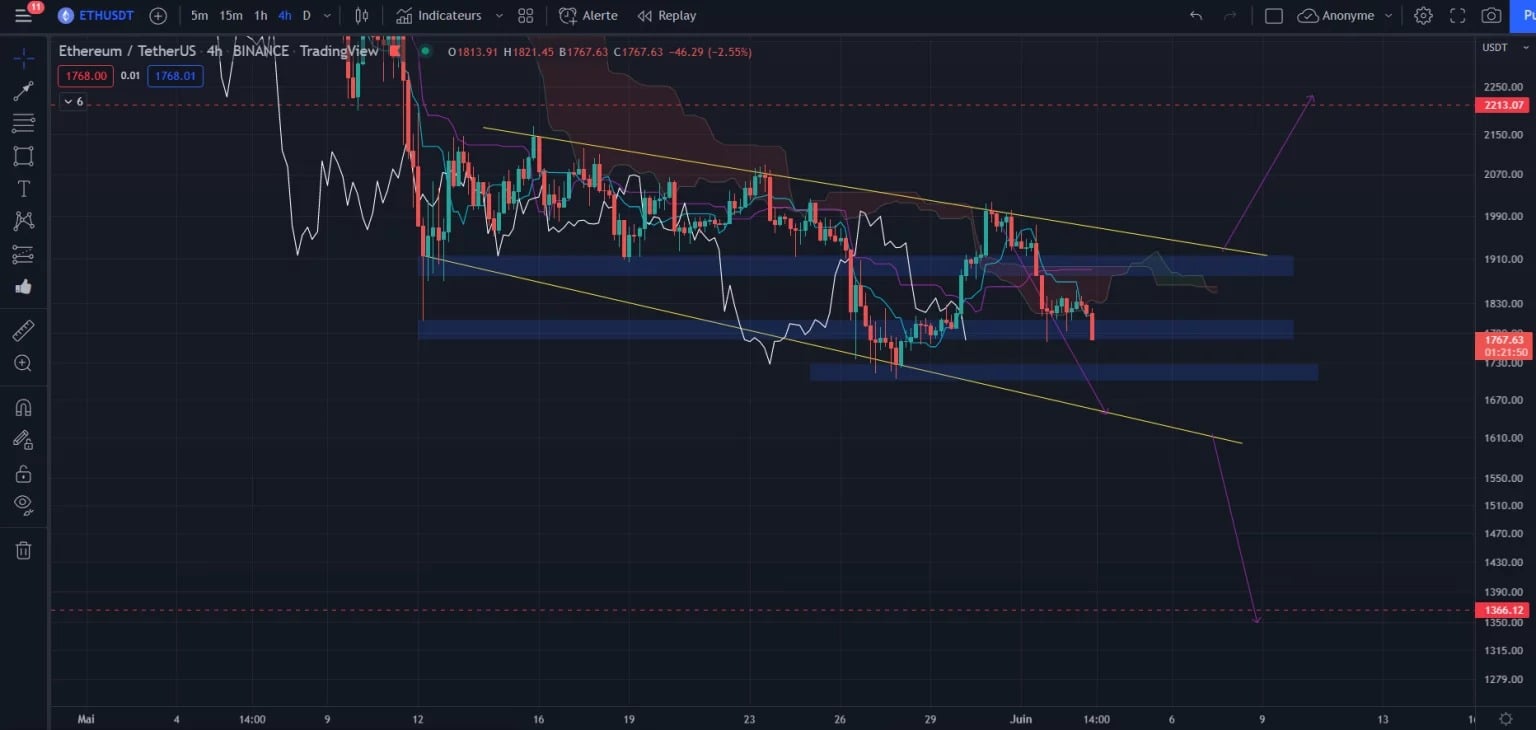
Figure 2: Ether price chart (h4)
Ether is moving in a broadening downward wedge. A chartist pattern that usually ends with an exit from the top. While these bullish exit probabilities are strong, ETH is still in a downtrend with the break of important support at $1,900. This rejection suggests a new low ahead, initially towards sideways support at $1,610.
However, there are supports to watch for on the way. The horizontal support at $1,770 (currently being tested for breakout) and the previous low at $1,730. If the price retests the bottom of the pattern as expected, it will then be necessary to rebound for a bullish break towards $2,213. Indeed, in case of a bearish breakout, the price would otherwise most likely return to the $1,366 level.
In conclusion
Cryptocurrencies continue to move in a downtrend and the breakout of chartist patterns is something to watch for in the coming days. Indeed, these signals will most likely set the direction of the market for the following weeks.