
BNB reached a symbolic milestone by breaking through the $1,000 mark. In the midst of a bullish trend, it is pulling back due to external market conditions, but in the short term, it is showing an interesting reversal pattern.
BNB: Strength and Resilience in a Turbulent Market
It is Friday, October 24, 2025, and the price of BNB is hovering around $1,120.
Binance Coin ranks among the top market caps in the cryptocurrency market. Backed by solid fundamentals, its utility within the Binance ecosystem gives it remarkable resilience, evident in its price performance.
Furthermore, the now-official presidential pardon granted by Donald Trump could pave the way for the return of its iconic founder to business.
Given Binance Coin’s recent gains amid a challenging market environment, the question of a classic “buy the rumor, sell the news” move seems entirely relevant.
Ranked among the top 4 most-traded assets currently—behind ETH, BTC, and SOL—BNB is the only one with negative funding rates, despite bullish weekly and daily trends.
This scenario suggests that the rally isn’t over yet and that there could be, at the very least, one final surge in buying pressure if the asset were to reverse and trigger a new downtrend in the medium or long term.
Now ranked fourth among cryptocurrencies, with a market capitalization of $157 billion, BNB is posting remarkable performance, even though, like the entire ecosystem, it has experienced major upheavals in recent weeks.
BNB is in the midst of a bull run
In our last analysis of BNB, we highlighted an interesting pattern in the 20- and 50-week moving averages, which pointed to a new phase of upward momentum for this asset.
Indeed, the absence of a bullish crossover and the realignment of the 7-, 20-, and 50-period moving averages suggested the emergence of a pronounced trend, which is currently still underway.
If we use these dynamic support levels as a reference, the 7-period SMA—shown in pink on our chart—is the support level that must hold to maintain the current momentum in the short term.
If it were to give way (two closes below the support level), then we could anticipate a pullback toward the 20-period moving average, which is trending strongly upward. Since these support levels are dynamic, they are likely to shift rapidly; it will be interesting to monitor any convergences.
In addition, the $1,000 level warrants close attention: it corresponds not only to the 1.618 extension of the last bear market but also to the 50% retracement of the most recent weekly leg and the latest low on the 3-day timeframe.
This is a threshold that must be maintained at the weekly close, or else—as BNB often does—the price risks entering a major consolidation phase.
Above this price, another key confluence zone to watch is the $1,200 level, which includes the 2 extension of the bear market—a target we had in our sights during this bull market.
The 0.236 Fibonacci retracement is also aligned with this psychological level, as is the 50% retracement of the latest bearish leg on the 3-day chart.
The latter could define a trading range between $1,000 and $1,375, with the price direction determined by the polarity at $1,200. Below this level, pressure builds on the $1,000 support; above it, a return to the all-time high (ATH) is possible.
If the all-time high were to be broken, a continuation of the uptrend toward the next Fibonacci extension, located at $1,500, is entirely possible.
If, however, the breakout were to fail—whether at the upper or lower boundary of this trading range—then a range-bound phase could materialize.
One positive factor that could support a rebound: the daily chart shows a change in structure following yesterday’s break above $1,143. The statistics therefore point to a rebound from the current zone.
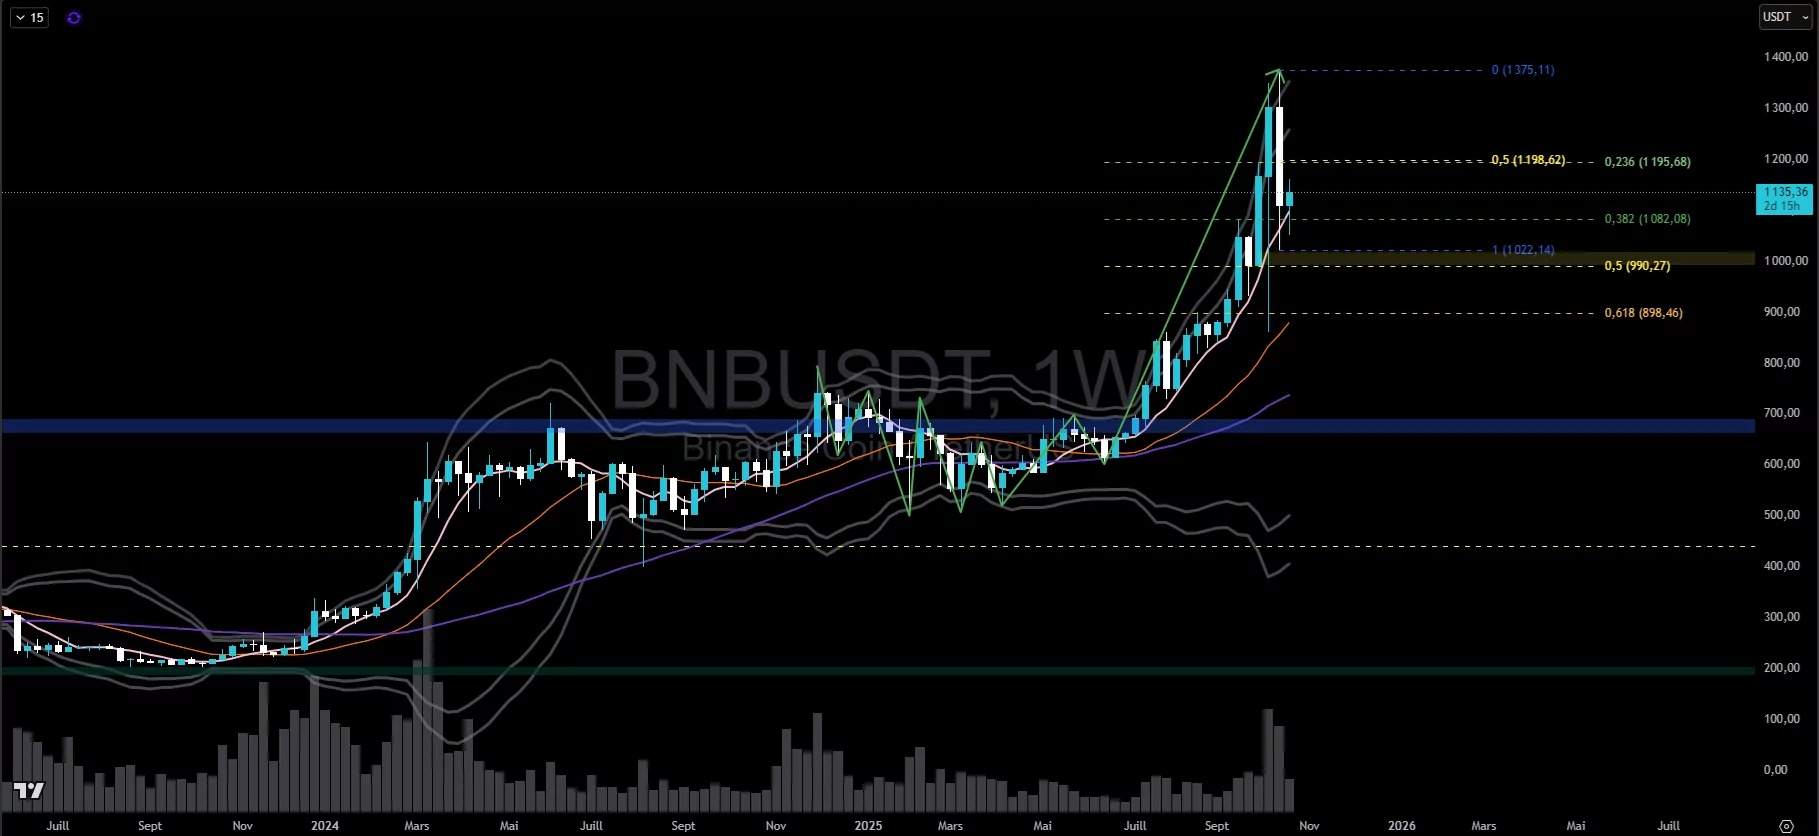
Weekly BNB price chart
In summary, BNB reached a symbolic milestone by breaking through the $1,000 mark. In the midst of a bullish trend, it is pulling back due to external market conditions, but in the short term, it could rebound from here.
So, do you think BNB could reach $1,500 soon? Feel free to share your thoughts in the comments.
Have a great day, and we’ll see you next week for another technical analysis of altcoins.