
Recent price movements have negatively impacted Ether’s chart, which is now oscillating between a drop back below $2,800 and a retake of the $4,000 level. If Ethereum is to return to its highs, it must maintain weekly closes above $3,500.
End of a cycle or just a pause?
It is Wednesday, November 12, 2025, and the price of Ether is hovering around $3,500.
Our last technical analysis of ETH was on October 15, 2025, when the price was around $4,100.
Since then, Ether has fallen back below the $4,000 mark, affected by a generally more uncertain market, in a crypto environment divided between holders anticipating the end of the cycle and more ambitious newcomers aiming for unprecedented highs in 2025 or 2026.
This ambivalent climate, exacerbated by traditional markets that have lost their bearings, continues to weigh on price movements.
The topic of Ether’s outperformance relative to Bitcoin remains relevant, but there has been little change since this summer, a period during which ETH began a significant rebound that it has now been consolidating for twelve weeks.
Now trading near the 50-week moving average and the trend’s polarity threshold, the ETH/BTC pair must quickly show renewed strength.
Last week’s low represents a relevant reference point that could serve as a invalidation level. A slight dip below this level may be tolerated, given the proximity to the 50-week SMA, but no close should occur below it if we wish to avoid the development of statistics favoring a new phase of sustained underperformance.
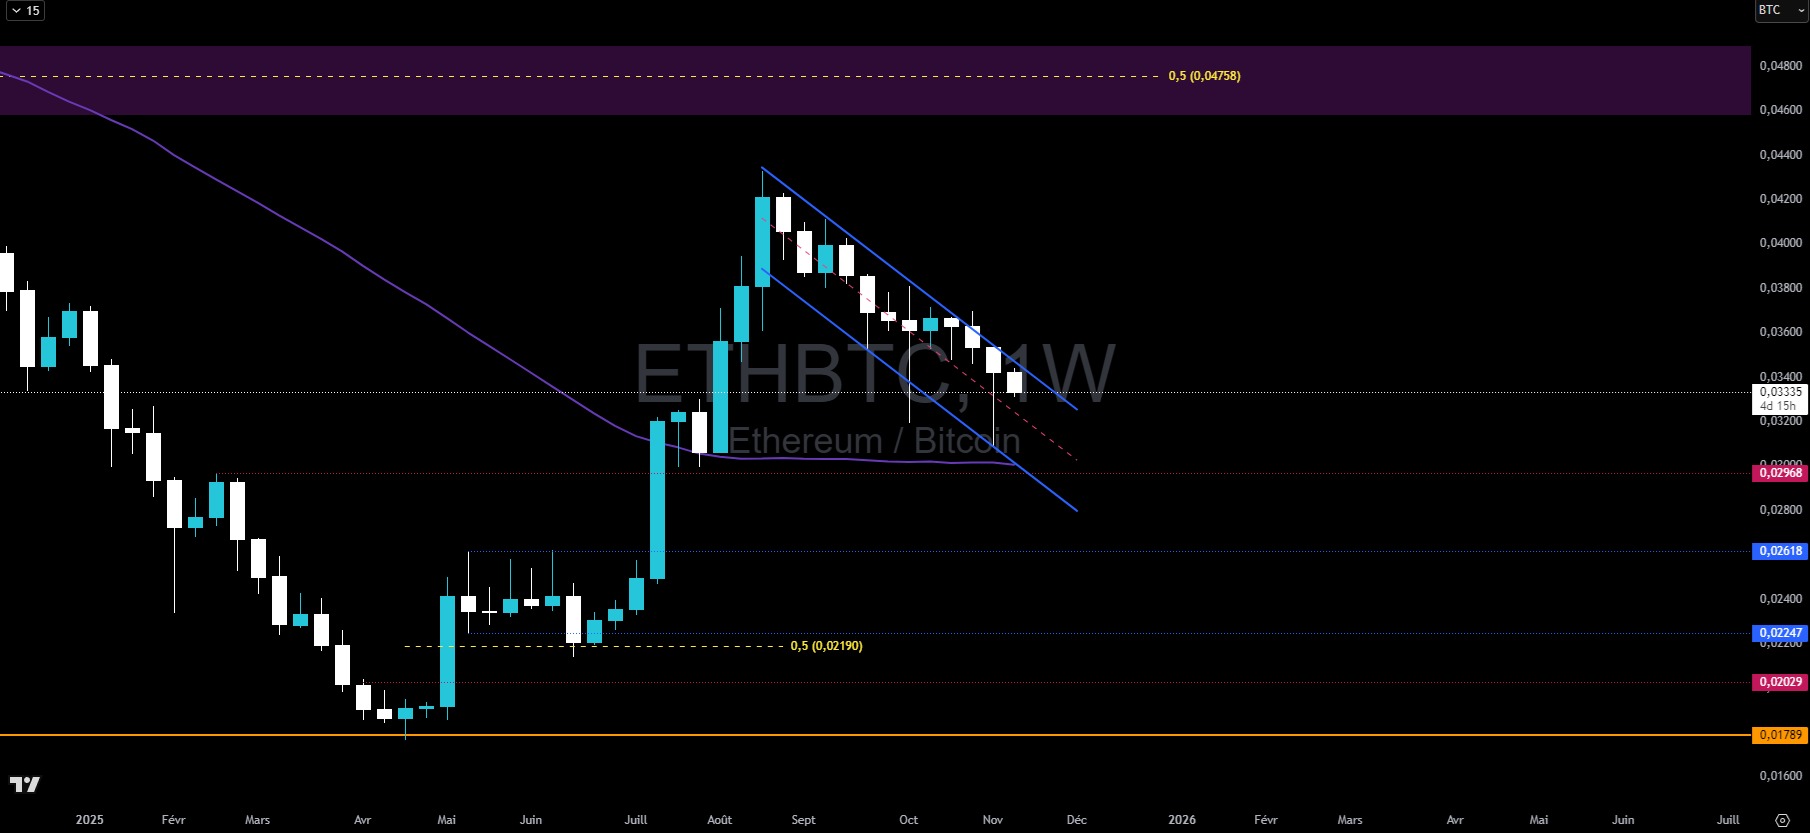
Weekly ETH/BTC price chart
Unsurprisingly, Ether firmly holds its second place in the cryptocurrency rankings, with a market capitalization of $420 billion. However, it is currently in a consolidation phase relative to both BTC and the U.S. dollar.
Ethereum is trading in a bearish trend.
Ether has been trading in a weekly bearish trend since the confirmed break below $4,200.
Now back below $4,000, the possibility of a dip into the $2,800 zone—the confluence of the 50% retracement of the bear market and the major pivot point of the past 18 months—is within the realm of possibility.
This zone must hold to prevent the price action from falling even further (bear market).
For now, market signals do not seem to indicate that such a scenario could occur in the immediate future, as the 50-week moving average has managed to boost the price.
To maintain the prospect of a short-term rebound, ETH must sustain weekly closes above $3,500.
This threshold is a key level that will act as a pivot between the scenarios of a retest of $4,800 and more bearish scenarios toward $2,000.
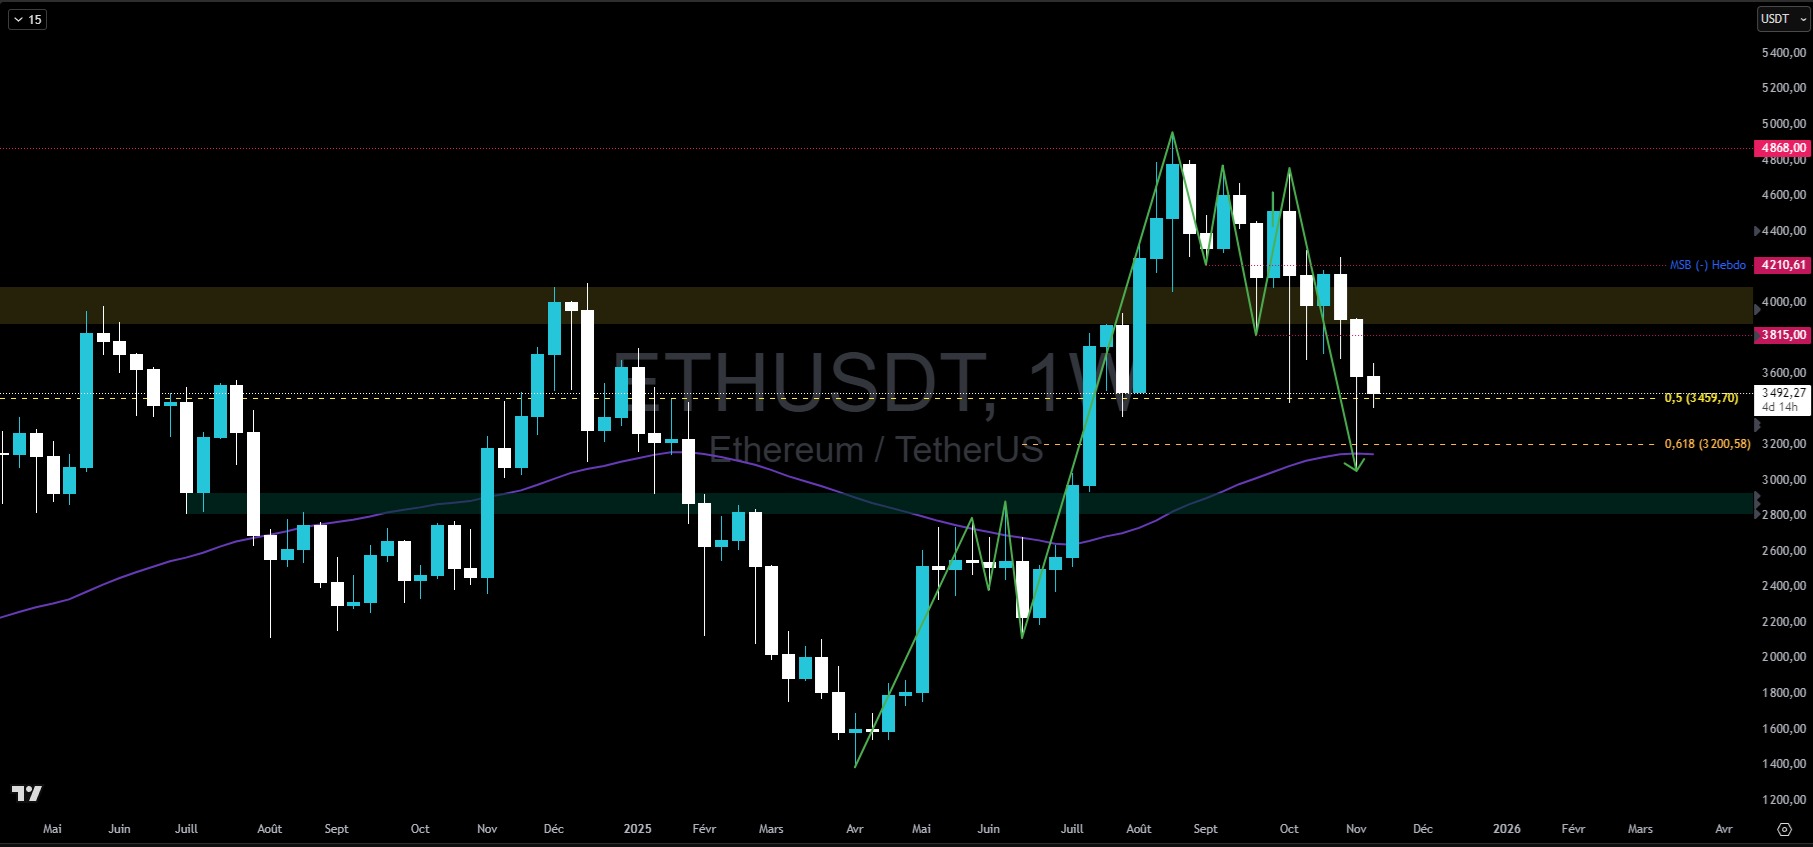
Weekly ETH price chart
Market dynamics, however, remain influenced by recent movements, and the bearish trend that has developed may take time to reverse.
Furthermore, the zone between $3,815 and $4,210 is expected to present significant resistance, likely causing friction before a resolution can occur.
To set the stage for such a move, Ethereum must rebuild its daily structure and realign its bullish highs and lows.
A first step—the formation of a high on Monday—has just been completed.
Now, the asset must form a low and break above $3,658 to validate an attempt at a bullish daily-chart recovery.
Let’s not forget, however, that at this stage, the trend remains bearish. Failing to establish a new high above the previous one implies that, at best, we could see a sideways consolidation phase; at worst, the correction could continue.
If the downtrend continues, the $2,800 area is a likely candidate for the price to find support.
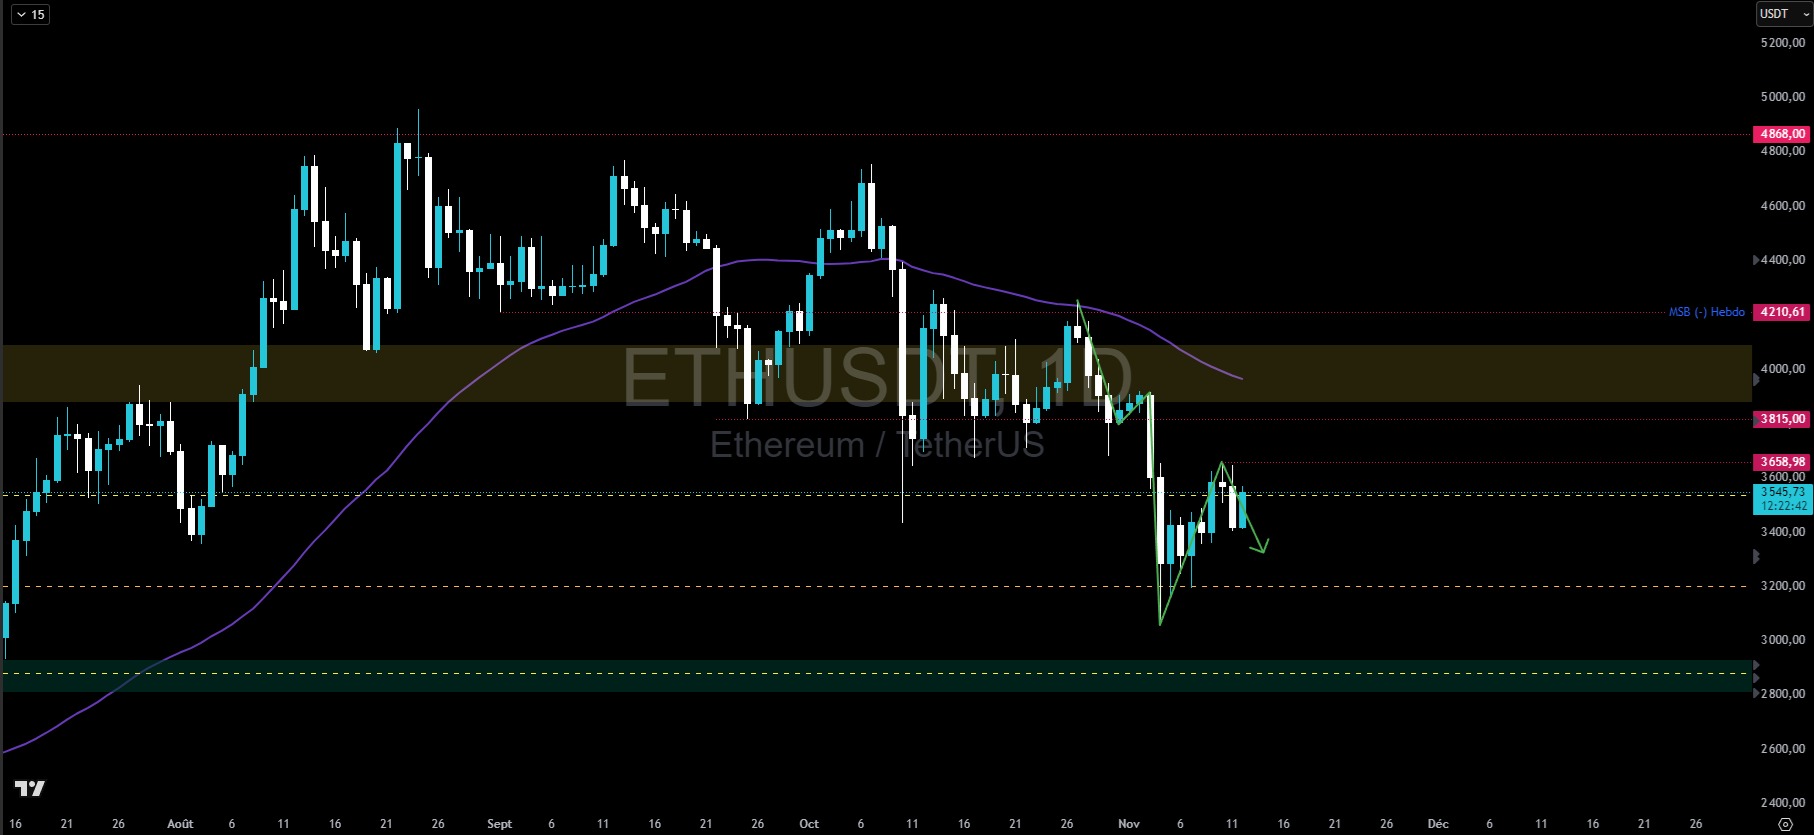
ETH daily price chart
In summary, recent price movements have weakened Ether’s chart pattern, which is now caught between a potential pullback below $2,800 and an attempt to reclaim the $4,000 threshold. To have any hope of returning to its highs, Ethereum must absolutely maintain weekly closes above $3,500.
So, do you think ETH can outperform the crypto market again? Feel free to share your thoughts in the comments.
Have a great day, and we’ll see you next week for a new technical analysis of Ethereum.