
Today, Ethereum’s ETH once again attempted to spend the $2,400 mark, with no lasting success so far. With this short-term outperformance of the asset, it’s an opportunity to look back at some current blockchain stats.
Ethereum: ETH tries again to break through the $2,400 mark
Today, Ethereum’s ETH made its 2nd attempt of December (and by extension of the year) to break through the $2,400 barrier, up 6.7% over the last 24 hours.
After briefly crossing the $2,446 mark, at the time of writing, assets were trading at $2,386, for a total capitalization of almost $287.5 billion:
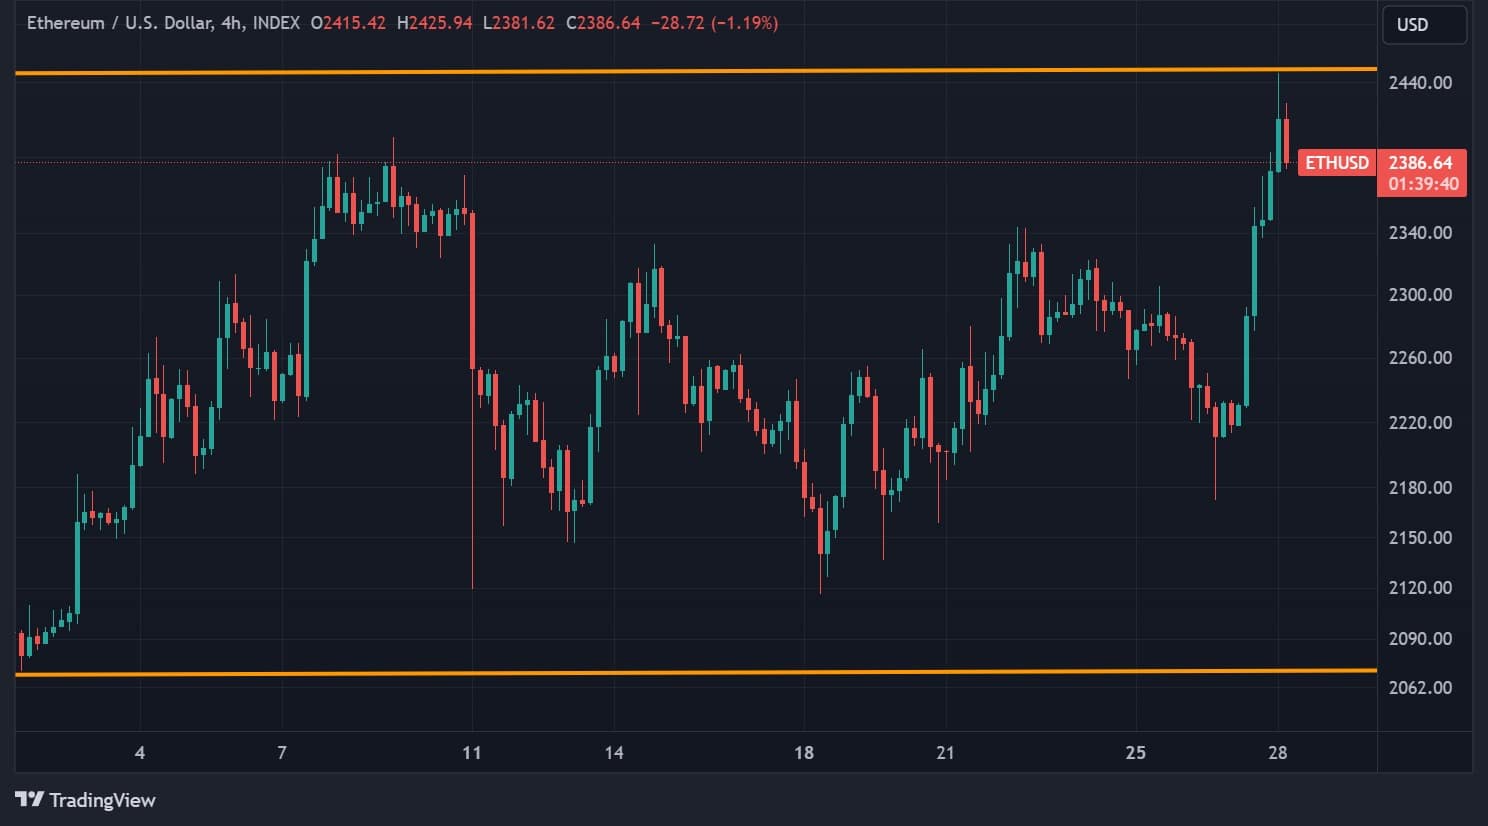
Figure 1 – ETH price in H4 data for December
When it comes to staking, Glassnode data shows levels on their all-time highs (ATH) with over 28.6 million ETH securing the network, equivalent to almost 23.8% of supply in circulation.
However, we can also observe a slowdown in deposits from mid-October onwards, and even some withdrawals, which could suggest profit-taking:
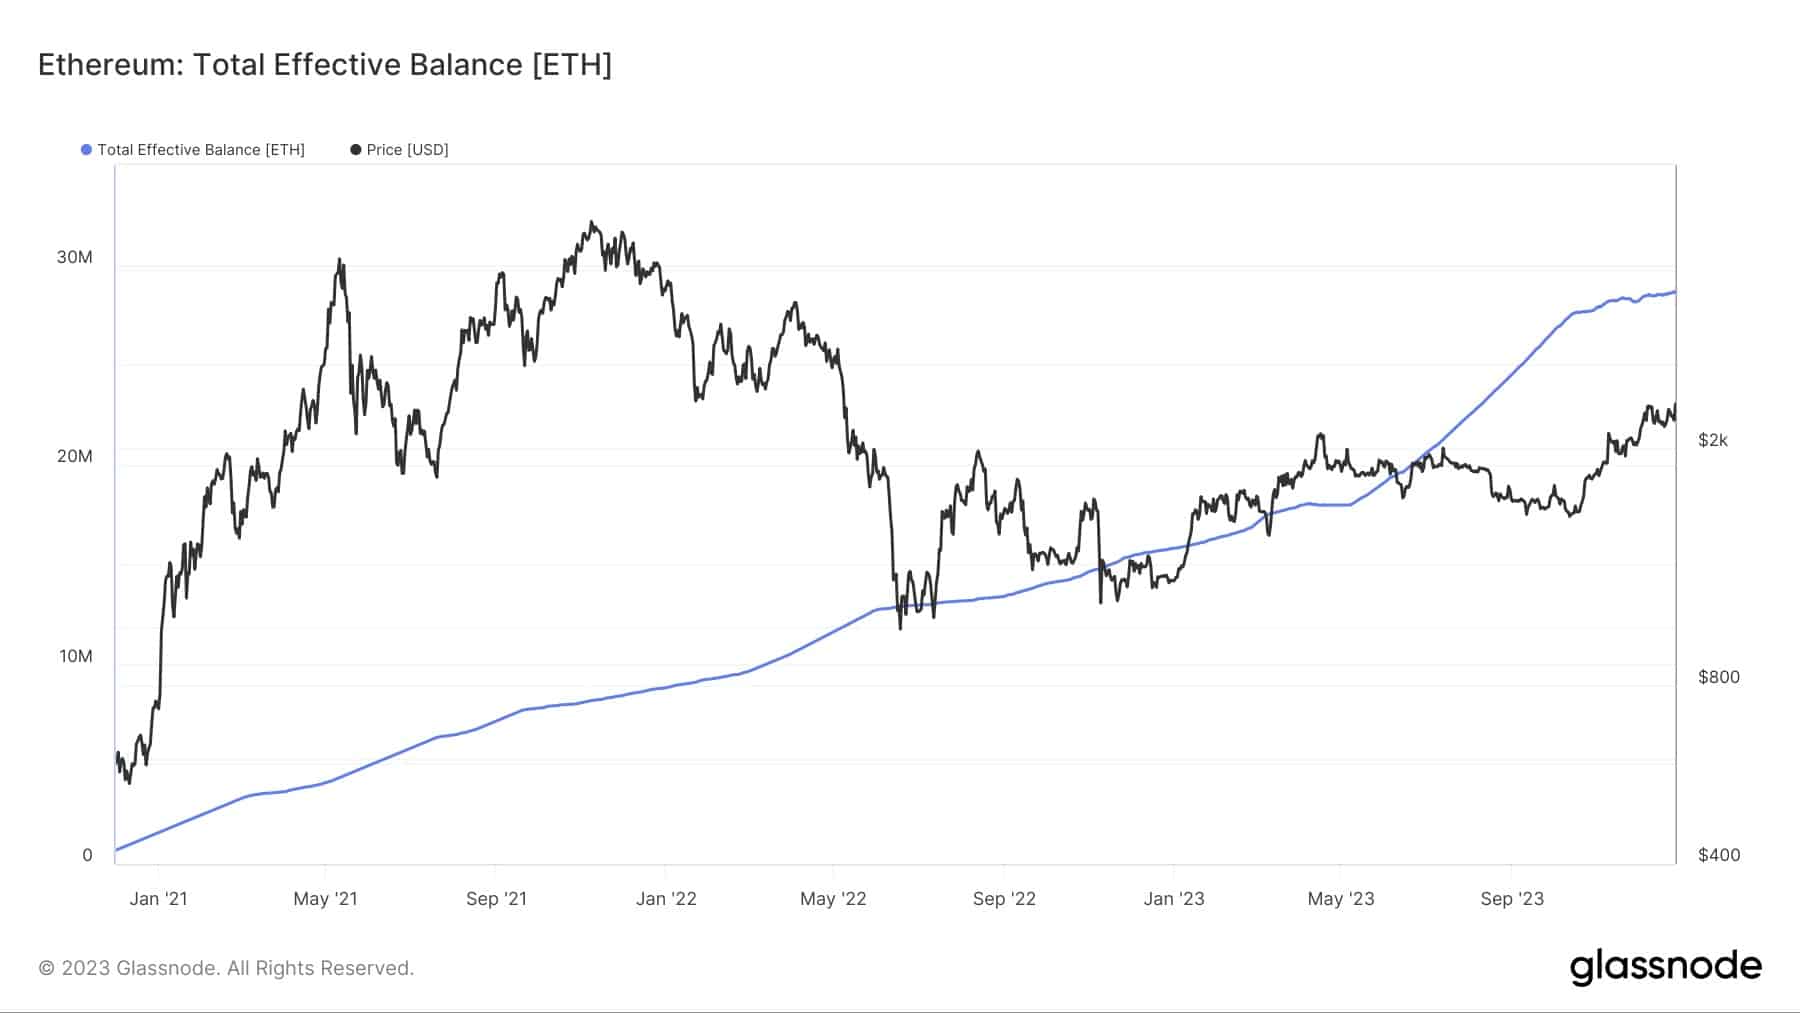
Figure 2 – ETH staking deposits compared to asset price
To date, more than 895,100 validators are active on the network, which surpassed 250 million addresses created on November 16, and now counts some 253.6 million.
What’s the current state of decentralized finance (DeFi)?
With a total locked-in value (TVL) of $29.71 billion, DeFi is certainly on the rise, too, but not on its highs for the year, unlike the ETH price.
Moreover, while the asset will have to slightly more than double to regain its own ATH, this same TVL will have to be multiplied by more than 3.6 to regain its own:
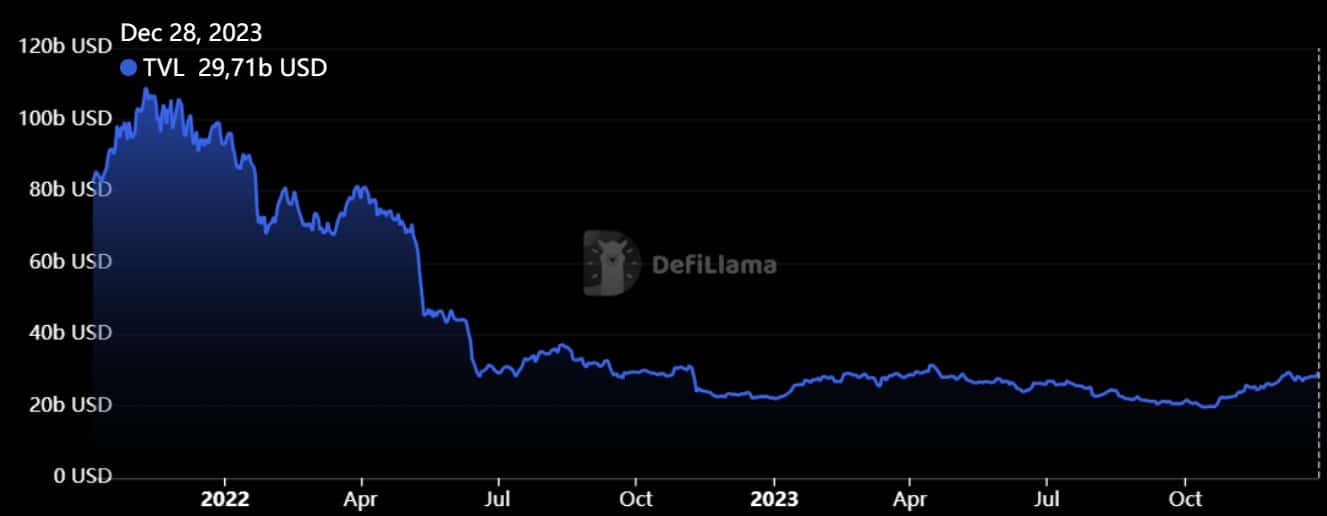
Figure 3 – TVL of DeFi on Ethereum
As always, Ethereum remains far ahead in the DeFi sector, with a dominance of 54.38% according to DefiLlama data. Its direct pursuers are Tron (TRX), as well as BNB Smart Chain, with a TVL of $8.07 and $3.55 billion respectively.
Activity on this DeFi can also be seen in gas prices. The average cost of a transaction was $7.07 on Wednesday. Although a drop was observed over the holiday period, the said gas price has nevertheless tended to follow the ETH’s rise over the last two months:
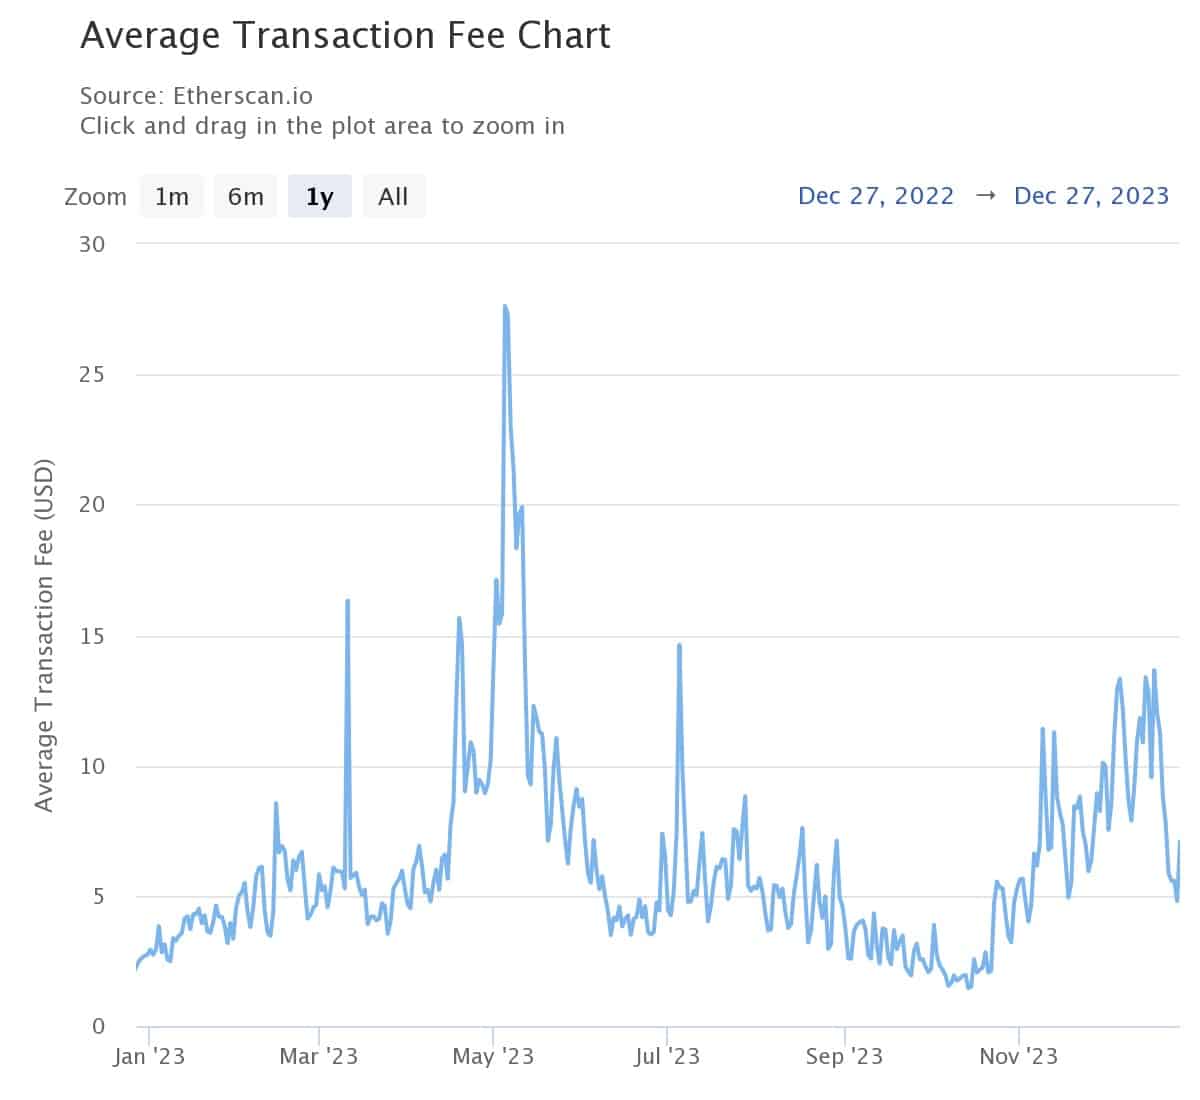
Figure 4 – Average cost of an Ethereum transaction in 2023
As all this data shows, Ethereum as a whole seems to be ending 2023 on a very positive note, although there are still a few days left to confirm this.
On the other hand, it’s important not to get caught up in the positive news and the fear of missing out (FOMO) syndrome. With the markets quiet at this time of year, trends can be distorted, and the return of the vacations can give more visibility on the choice of one direction rather than another.